Assessing ecological vulnerability in the Kulsi River Basin, Assam using an MCDM-based analytical hierarchical approach
Abstract
The Kulsi River basin, situated in the South Kamrup district of Assam, India, is noted for its rich fish diversity and significant deposits of Pre-Cambrian quality sand in its headstreams. These deposits gradually make their way downstream, acting as a catalyst for local livelihoods. However, the intricate ecosystem fostered by the Kulsi River is under significant ecological threat due to urbanization, population growth, and associated environmental stressors such as rampant sand mining, deforestation, and soil erosion. These changes pose a risk to the basin's ecological sustainability, increasing its vulnerability. This study employs the Analytical Hierarchical Process (AHP), a GIS-based multi-criteria decision analysis method, to assess and monitor the basin's ecological vulnerability. It seeks sustainable methods to rejuvenate ecological sustainability in the basin. Criteria such as slope, C factor, stream density, proximity to roads, soil erosion, literacy rate, soil erodibility factor, and rainfall were analyzed. The findings reveal varied vulnerability across the Kulsi River basin, with 6.24% of the area classified as extremely vulnerable, 25.56% as highly vulnerable, 24.56% as moderately vulnerable, 32.67% as low vulnerable, and 10.94% as non-vulnerable. Highly vulnerable zones are notably in newly developed suburban areas adjacent to national highways. However, non-vulnerable zones are primarily in the upper river course and its surrounding regions in the southern direction. The findings highlight the urgent need for targeted mitigation strategies to address the adverse effects of human activities and natural processes on the basin's ecological integrity. This study maps the vulnerability of the Kulsi River basin. It provides valuable insights into sustainable management and hazard mitigation. The study highlights the link between human activity, ecological sustainability, and geomorphological hazards.
1 INTRODUCTION
Studies aimed at assessing the level of ecological vulnerability of any spatial unit is, in fact, a great way to adhere with the goals of Sustainable development. Human adaptation to ecological vulnerability is now a new key to one's sustainability in the ever-changing ecology of the planet. Article 4.4 of the UNFCCC states that developed countries should assist developing countries vulnerable to climate change in meeting adaptation costs (Sands, 1992). Ecological vulnerability assessment measures how likely an area is to degrade into a fragile or destroyed ecosystem. Zhang et al. (2022) define ecological vulnerability as a region's sensitivity to natural and human disturbances and its ability to recover within a specific time and space. According to Hu et al. (2021), ecological vulnerability refers to changes in the ecosystem caused by natural and human factors that negatively impact both the ecosystem and humanity over time. Highly vulnerable environments increase the risk of disasters like desertification, land degradation, deforestation, extreme temperature rise, and water scarcity. Identifying vulnerability zones with varying intensities is crucial for designing strategies to mitigate environmental vulnerability (Chapi et al., 2017).
The selection of vulnerability indicators is crucial because they vary widely with the purpose of assessing general or specific vulnerability. For local and micro-scale studies, field-based observations help identify viable indicators negatively affecting the area, supported by a sufficient literature review. Scholars like Nguyen et al. (2016), Ghosh and Maiti (2021), and Bora and Goswami (2017) have categorized the eco- environmental vulnerability influencing factors or criteria into two categories: internal (natural factors) and external vulnerabilities (socioeconomic factors) mainly induced by man- made activities. Any kind of hazard or vulnerability causes massive damage to the physical and socio-economic aspects of the human life. Therefore, studies pertaining to such concern must incorporate socioeconomic factor which better synergize for adaptive measures (Dutta & Deka, 2024; Sanyal & Lu, 2005; Varis et al., 2012).
Environmental vulnerability can be assessed using various methods. These include principal component analysis (Li et al., 2006), multi-criteria decision making methods (Debnath et al., 2024; Wang et al., 2022; Yadav et al., 2022), index-based approaches (Juwana et al., 2011; Sullivan et al., 2003), frequency ratio (Sarkar et al., 2022), and Artificial Neural Networks (Jahangir et al., 2019). Each method has its own strengths and limitations. The MCDM method facilitates participant decision-making and allows them to express personal preferences. It can also identify environmental zones with minimal effort (Kaur et al., 2020; Tomar et al., 2021). Azarnivand et al. (2015) stated that the AHP method is helpful for breaking down complex problems into a systematic hierarchical structure. Debnath et al. (2024) analyzed flood susceptibility in the Brahmaputra basin using machine learning and MCDM approaches like VIKOR, AHP, and TOPSIS. Among these, MCDM combined with AHP provided the best results for addressing the basin's susceptibility issues.
The growing fragility of Earth's ecological balance has spurred extensive research on ecological vulnerability. Xue et al. (2019) observed increasing vulnerability in the Tarim River basin (2005–2015), demonstrating the utility of the F-AHP and Pressure-State-Response methods. Rehman et al. (2022) identified rainfall, temperature, slope, and disturbance index as key vulnerability factors in the tectonically active Bhagirathi sub-basin, India. Ghosh and Maiti (2021) assessed risk in the Mayurakshi River with AHP and Fuzzy AHP, achieving 95% model accuracy. Zema et al. (2024) used machine learning to predict postfire soil erosion, while He et al. (2024) applied the InVEST model to assess soil dynamics in the Ganjiang River basin. Min et al. (2024) analyzed soil erosion on the Loess Plateau using RUSLE and land-use simulation. Luo et al. (2024) used the SRP model to map Loess Plateau vulnerability (2000–2020), and Wang et al. (2024) created an ecological vulnerability map for Zhongwei City using AHP-EW methods. Xie et al. (2024) evaluated Liaoning Province's vulnerability (2000–2022) with a sensitivity-degradation model. Das and Behera (2024) integrated AHP, CRITIC, and AHP-TOPSIS to assess geo-environmental and anthropogenic vulnerabilities. Liu et al. (2024) applied AHP to assess ecological vulnerability in the three river source regions of China. Coelho et al. (2024) developed an ecological vulnerability index map using four variables, that is, land use adequacy, burned area, erosion susceptibility, and quantitative water balance for the headwater region of the Sao Francisco River basin, Brazil based on AHP multicriteria analysis.
The Kulsi River basin has an undulating topography, interconnected wetlands, and tributaries, creating a unique ecosystem. It serves as a habitat for the Gangetic dolphin and various ornamental fishes (Jayachandran et al., 2007; Wakid, 2009). In the past, high rainfall, abundant water discharge, and dense vegetation supported a sustainable and healthy ecosystem in the basin. However, recent climatic changes and a decline in vegetation cover (2002–2018) have caused water scarcity in many parts of the basin, especially in densely populated areas (Chowdhury et al., 2024). Similar findings by Imchen et al. (2020) show that water bodies in South Kamrup declined from 32.07 sq km in 1999 to 17.30 sq km in 2019, with further declines predicted due to forest destruction. Socioeconomic factors like population growth (15.12% from 2001 to 2011) have worsened ecosystem sustainability. About 80% of the basin's inhabitants rely on forest and sand resources, as agriculture is declining, with poor income returns. Rapid urbanization in nearby Guwahati has increased demand for sand, leading to illegal excavation, even in remote areas of the basin. Officials report that upstream sand excavation has reduced downstream water flow, affecting fish availability, increasing turbidity, and causing water scarcity. These issues require urgent attention.
The present study is unique as it assesses the ecological vulnerability of the Kulsi River basin, considering all relevant parameters. It identifies ecological vulnerability zones based on their status. The study also validates its findings and suggests innovative solutions to address the issues. Previous studies on the Kulsi River basin mainly focused on the declining river dolphin population and increasing sand mining. These studies (Islam et al., 2012; Wakid, 2005) primarily blamed sand mining for environmental degradation without considering other factors or providing proper solutions for stakeholders. This study takes a new approach by assessing the ecological vulnerability of the basin comprehensively.
The AHP analysis was used to assess environmental vulnerability and classify regions into different vulnerability stages. This helps identify vulnerable zones and apply suitable management techniques for each zone. The goal is to restore sustainability in the basin and make it suitable for aquatic life again.
2 DESCRIPTION OF STUDY AREA
River Kulsi is a prominent south-bank tributary to the mighty Brahmaputra (Duarah & Phukan, 2007). The Kulsi Catchment shares a latitudinal extension of 26°30'N to 26°10'N and a longitudinal extension of 90°50'E to 91°40'E (Figure 1). The elevation of the watershed ranges from 50 to 1900 m. The Kulsi basin covers an area of 1016.81 sq km. Kulsi River originates at a place called Ukiam, which is situated in the Assam–Meghalaya border zone, where with the confluence of two headstreams called the Khri (locally called Ghoga) and the Umsiri River at Ukiam (Imsong et al., 2018). In addition to this, Kulsi River is fed by numerous tributaries like Batha, Singra, and Kharkari (Medhi, 2022). Besides this, the watershed consists of various wetlands like Chandubi Lake, Dora Beel, and Sol Beel connected to the river Kulsi via small rivulets. The total river length is 132.01 km from source (Ukium) to mouth (Nagarbera).
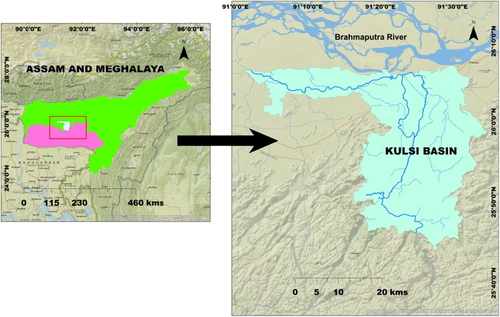
The Kulsi basin falls in the foothill zone of the Khasi hills. As per the study made by (Imsong et al., 2018) the Kulsi basin has got broadly two distinct physical zones: (a) the upstream and mid-stream segment (dominated by bedrock); (b) the downstream segment (dominated by alluvium). The upstream section of the Kulsi basin falls in the Khasi hills of the Meghalaya, while the downstream section of the basin falls in the foothill and plain areas of Assam. The bedrocks of the drainage basin consist of Precambrian Gneissic Complex (Imsong et al., 2018). This area is also the source of various lineaments and fault zones, giving rise to strong geomorphic relief of a young terrain in the area (Duarah & Phukan, 2011). While the downstream portion of the Kulsi River is mostly composed of alluvial deposits. This portion has very gentle slope (0° to 5°) and hence this portion is relatively tectonically stable compared to its upper stream catchment. This portion mostly contains the teak forest cover and newly built-up areas consisting of settlements, cultivated lands and road networks in the basin.
3 DATASETS AND METHODOLOGY
The methodology adopted in the present study includes a field visit to the various parts of the basin, a literature review, followed by the selection of the variables that have the potential to cause vulnerability situation in the basin. A total of nine criteria were selected, which were divided into two subcategories, namely physical and socio-economic factors. It was followed by the conduction of the multicollinearity test of the selected variables, construction of the pairwise matrix table for the assignment of weights (Saaty, 1980), preparation of the thematic layers of the selected layers using Jenk's classification method, construction of the environmental vulnerability map using overlay function, validation and accuracy assessment of the generated map using the ROC curve. The above-mentioned methodologies have been discussed in detail under the following sub-heads. The data sources used in the construction of the various independent variables (criteria) have been given in Table 1.
| Data description | Resolution | Extracted factors | Sources |
|---|---|---|---|
| SRTM DEM | 30 m × 30 m | Slope, Drainage Density, & Distance to River | United States Geological Survey (USGS) Retrieved from: https://earthexplorer.usgs.gov |
| IRS Resource sat 1 image for the year 2021 | 23.5 m × 23.5 m | LULC map, & Cover Management Factor (C factor) | Indian Space Research Organization (ISRO) Retrieved from: https://bhuvan.nrsc.gov.in/wiki/index.php/Free_Satellite_Data_Download |
| Gridded Rainfall datasets (0.25 × 0.25) | Rainfall | Indian Meteorological Department (IMD) Retrieved from: https://www.Imdpune.gov.in |
|
| Digital soil map of Kulsi basin | Soil Map, & Soil Erodibility Factor (K factor) | Food and Agricultural Organization Retrieved from https://www.fao.org |
|
| Literacy status of the Kulsi basin | Literacy | Census of India (2011) Retrieved from https://censusindia.gov.in |
|
| Distance to road | Digital road network shape file | Open Street Map (OSM) |
3.1 Natural factors
The details of the natural factors selected for the present study are given below.
3.1.1 Slope
Slope is a great medium through which one can access the geological setup of a river basin, and is a great way to understand the ecological susceptibility status of the river basin. Debnath et al. (2024), mentioned that slope influences the environmental vulnerability of a region as it regulates the movement of water where the gentle slope areas lead to percolation of water thereby increasing the ground water table of the area whereas it is the reverse in the steep slope areas. Steeper slopes often trigger soil erosion and landslides, which causes socioeconomic havoc, leads to the removal of topsoil, thereby declining the fertility of soil and leaching out the important minerals present in the soil, increases the turbidity level of the river, and thus affects the biota of the water body. DEM has been used to create the slope map for the study area in the ArcGIS platform by using the spatial analyst tool, and was later transformed into a UTM 46N projection system using the WGS1984 datum.
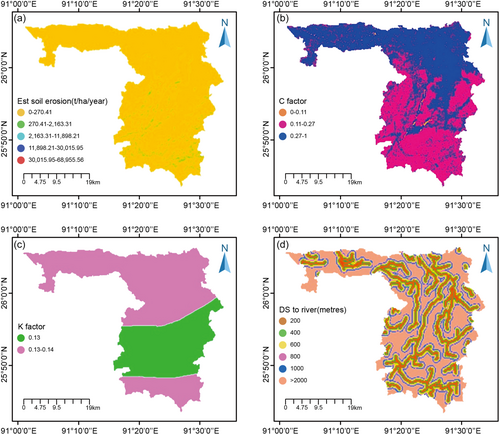
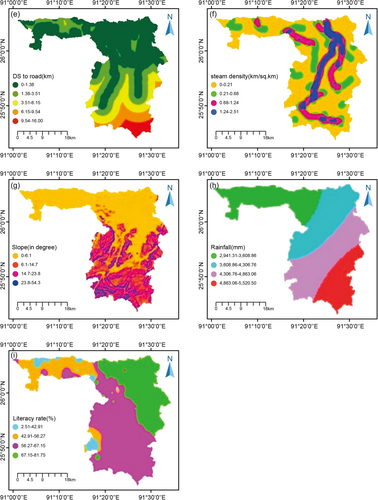
In the present study, slope (degree) has been found to range from 0° to 54.38° (Figure 4g), indicating a very low to high slope (determined by consulting V. Zhuchkova and E. Rakovskaya, 2004 slope classification list). The majority of the area in the Kulsi basin (68%) comes under very gentle slope areas, whereas only 0.03% of the area comes under very steep slope areas.
3.1.2 Rainfall
Rainfall is a dominant climatic factor that regulates the climate of any area by lowering the temperature. Rainwater percolates inside the soil, which helps in the growth of vegetation and regulates the bio-geochemical cycles of the ecosystem. The scanty rainfall in the Kulsi basin, especially in the winter season, has already created a water scarcity scenario in the nearby villages (Wakid, 2009). Hence, rainfall distribution has been incorporated as a factor for the AHP analysis.
The rainfall distribution map was constructed with the help of the gridded rainfall data at an interval of (0.25 × 0.25) obtained from IMD. Finally, the gridded datasets were applied with the interpolation method (IDW) to prepare the final layout map. In the Kulsi basin, the rainfall is high on average, and it was found to range from 2941.3 to 5520.5 mm (Figure 4h). The rainfall was found to be higher in the southern portion of the basin compared to its northern counterpart (Figure 2).
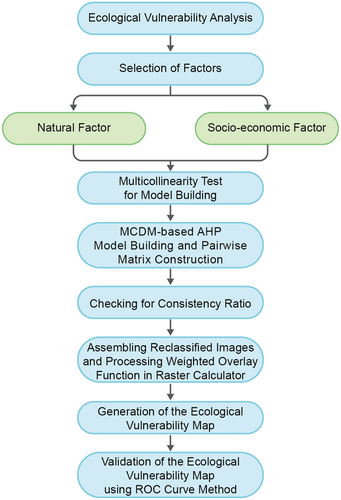
3.1.3 Soil erodibility factor (K factor)
fcsand is a factor that gives low soil erodibility factors for soils with high coarse-sand contents and high values for soils with little sand.
fcl-si is a factor that gives low soil erodibility factors for soils with high clay to silt ratios.
forgc is a factor that reduces soil erodibility for soils with high organic carbon content.
fhisand is a factor that reduces soil erodibility for soils with extreme high sand contents.
The K factor was found to lie between (0.134851–0.140876) in the Kulsi basin in the present study.
3.1.4 Distance to the river
In the present time, rivers and wetlands, apart from source of irrigation, provide a host of services which are covered under the umbrella term called the ecosystem service (Chatterjee & Mukherjee, 2010). The areas situated near the river system will undoubtedly can have access to the maximum ecosystem services (compared to distant areas) such as better regulation of the nutrients between water and land, recreational opportunities, regulating climate, creation of micro water biome, carbon storage which is highly conducive to ecological sustainability of any area. The distance to the river map was generated using the DEM data by the stream network estimated from the SRTM DEM data. Later on, Buffer was taken at various intervals to generate the final map. It has been observed that about 50.51% of the basin is at a distance of 2000 m from the river, and about 13.21% are located just at a distance of 200 m from the river.
3.1.5 Stream density
Drainage density is indicative of the number of streams and rivulets per unit size of the area. High drainage density, especially in the monsoon season, increases the probability of occurrence of floods due to increased stream flow and can be environmentally susceptible (Arthington et al., 2010). Besides this, Drainage density has profound influence on the lineament density which greatly determines the ground water availability (Das, 2011). The drainage density map was prepared with the application of the Arc Hydro tool to the DEM of the study area, followed by the application of the line density tool in the Arc GIS platform. In the present area, the drainage density varies from 0 to 2.5 km/km2 (Figure 4f). The maximum portion of the Kulsi basin shows very low stream density, and very high stream density is mostly seen in the source area of the Kulsi River and the densely populated villages around the Kulsi reserve forest, where the Kulsi River actually bifurcates into branches.
3.1.6 Soil erosion
C factor or the conservation factor implies the effects of vegetation, management, and erosion control practices on soil loss (Wischmeier & Smith, 1978). The process to prepare the C factor has already been discussed under the heading C factor or cover management factor.
Lastly, the P factor or the practice factor indicates the ratio of soil loss after implementing conservation practice to soil loss from straight-row cultivation running up and down a slope (Wischmeier & Smith, 1978). The P-factor value ranges from 0 to 1 (Ganasri & Ramesh, 2016), the value approaching 0 indicates good conservation practice, and the value approaching 1 indicates poor conservation practice (Figure 3).
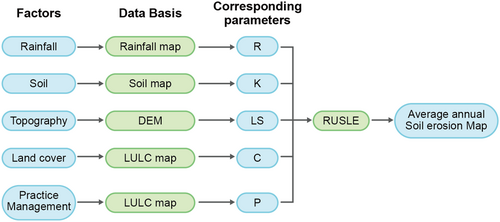
In the end, after computation of all the five factors as mentioned above, the RUSLE equation is computed in the raster calculator in the Arc Map, and the soil erosion map is obtained. The estimated soil erosion in the Kulsi basin was found to lie between 0 and 68955.6 (t/ha/yr) after the computation of the equation (Figure 4a).
3.2 Socioeconomic factors
3.2.1 C factor (Cover Management factor)
The C-factor specifies the effects of vegetation, management, and erosion control practices on soil loss (Wischmeier & Smith, 1978). The cover management factor(C) depends on the land use and it is the ratio of soil loss from a cropped land in a particular condition to the soil loss in the continuous tilled fallow on the same soil and slope (Pandey et al., 2007). Land cover change of the basin has the strongest influence on the C-factor, leading to a significant increase in the C-factor and an increase in soil loss. It has serious repercussions on the soil fertility and soil health. Cover management factor is, in fact, the new yardstick that human beings need to adopt (which is, to a large extent, controlled by humans) to retain the sustainable ecological status of the basin.
In this study, to determine the C factor, a first land use and land cover map has been prepared having five classes such as Forest, Cultivable land, built up Area, Water bodies, and Barren land by adopting supervised classification method. Once LULC map is prepared the C factor is assigned to each class by consulting the C factor list prepared by Wischmeier and Smith (1978) for different land use types. The C factor in the present study was found to vary from 0 to 1.
3.2.2 Distance to road
Areas located near highways often suffer from disruption of the habitats and migration corridors of various species (Liu et al., 2020) thus it is detrimental to the environment. Moreover, highways increase traffic which disturbs the air quality and the charcoal used in the construction of the highways often increases the normal temperature range thereby becoming a potential factor in ecological vulnerability.
Road distance to the national highway has been constructed with the help of the Open Street Map (OSM) from where the digitalized national highway files have been extracted, and the distance of various places was calculated by using the Euclidean distance and has been expressed as kilometers. In the Kulsi basin, the places lie within the range of 0–16 km from the national highway, and the maximum portion of the Kulsi basin comes within the range of 0–3.2 km (Figure 4e).
3.2.3 Literacy rate
The literacy rate is not a direct criterion to influence or impact the ecosystem, but it has the potential to measure the degree of adaptability to changing ecology (Chakraborty & Joshi, 2016). Literacy rate has the potential to spread awareness and evaluate the vulnerability of the ecosystem, thus it becomes an important criterion in assessing the vulnerability of the environment. Information on the literacy rate has been acquired from the census report of Kamrup district (2011). The literacy map has been prepared by the interpolation method with the help of the neighborhood values instead of the Choropleth map. It is so because the extreme southern portion of the basin comes under the jurisdiction of the Meghalaya, and information on the literacy rate of those areas is not available. However, interpolation has been carried out by consulting related literature.
3.3 Multicollinearity testing of the selected criteria
| Criteria | VIF | TF |
|---|---|---|
| Distance to river | 1.34 | 0.74 |
| K factor | 1.40 | 0.71 |
| Rainfall | 2.74 | 0.36 |
| Slope | 1.01 | 0.98 |
| Literacy | 1.04 | 0.95 |
| Distance to road | 2.24 | 0.44 |
| Drainage density | 1.27 | 0.78 |
| Soil erosion | 1.05 | 0.95 |
| C factor | 1.27 | 0.78 |
- Abbreviations: TF, tolerance factor; VIF, variance inflation factor.
3.4 Preparation of pair-wise matrix table
In the present study, nine multi-criteria have been chosen and they are arranged in a 9 × 9 matrix. This is mainly done to compare the weights of each class in a single theme layer as well as between different thematic levels (Debnath et al., 2024). Each pair is given a scale rating or intensity importance which ranges from 1 to 9 based on its relative importance or weight by using the intensity scale developed by Saaty (1980). It is also important to mention here that the final rating is invested with the researcher who will rate the criteria or factors based on his understanding, experience, and expertise in the field of study. When the factor on the vertical axis is more important than the factor on the horizontal axis, this value varies between 1 and 9, and in other cases, the value varies between the reciprocals 1/2 and 1/9, where 9 means the most important, 8 the second most important, and so on down to 1/9, the least important. In the judgment matrix, 1 is the value of the diagonal (Table 3).
| Selected factors | Slope | C factor | Rainfall | Stream density | Distance to road | Distance to river | Soil erosion | K factor | Literacy |
|---|---|---|---|---|---|---|---|---|---|
| Slope | 1 | 3 | 3 | 2 | 2 | 3 | 2 | 5 | 4 |
| C factor | 0.33 | 1 | 6 | 4 | 3 | 3 | 2 | 6 | 5 |
| Rainfall | 0.33 | 0.17 | 1 | 2 | 2 | 2 | 2 | 4 | 3 |
| Stream density | 0.5 | 0.25 | 0.5 | 1 | 3 | 5 | 3 | 5 | 4 |
| Distance to road | 0.5 | 0.33 | 0.5 | 0.33 | 1 | 5 | 5 | 8 | 6 |
| Distance to river | 0.33 | 0.33 | 0.5 | 0.2 | 0.2 | 1 | 2 | 3 | 3 |
| Soil erosion | 0.5 | 0.5 | 0.5 | 0.33 | 0.2 | 0.5 | 1 | 8 | 4 |
| K factor | 0.2 | 0.17 | 0.25 | 0.2 | 0.13 | 0.33 | 0.13 | 1 | 2 |
| Literacy | 0.25 | 0.2 | 0.33 | 0.25 | 0.17 | 0.33 | 0.25 | 0.5 | 1 |
| Total | 3.95 | 5.95 | 12.58 | 10.32 | 11.69 | 20.17 | 17.38 | 40.5 | 32 |
3.5 Preparation of the synthesized matrix and normalized weight (Wi)
Each of the cell values of the pair-wise comparison matrix (Table 3) is divided by the sum of the values of their respective rows to form a synthesized matrix, which is shown in Table 4. Next, each row corresponding to each multi-criterion that has the synthesized matrix value is added up, and the column will be named as total weight. Next, the total weight column will be summed up and each value will be divided by the summation value to find the normalized weight (Wi).
| Selected Factors | Slope | C factor | Rainfall | Stream density | Distance to road | Distance to river | Est. Soil erosion | K factor | Literacy | Total Weight (Twi) | Normalized Weight (Wi) |
|---|---|---|---|---|---|---|---|---|---|---|---|
| Slope | 0.25 | 0.50 | 0.24 | 0.19 | 0.17 | 0.15 | 0.12 | 0.12 | 0.13 | 1.87 | 0.21 |
| C Factor | 0.08 | 0.17 | 0.48 | 0.39 | 0.26 | 0.15 | 0.12 | 0.15 | 0.16 | 1.94 | 0.22 |
| Rainfall | 0.08 | 0.03 | 0.08 | 0.19 | 0.17 | 0.10 | 0.12 | 0.10 | 0.09 | 0.96 | 0.11 |
| Stream density | 0.13 | 0.04 | 0.04 | 0.10 | 0.26 | 0.25 | 0.17 | 0.12 | 0.13 | 1.23 | 0.14 |
| Distance to road | 0.13 | 0.06 | 0.04 | 0.03 | 0.09 | 0.25 | 0.29 | 0.20 | 0.19 | 1.26 | 0.14 |
| Distance to river | 0.08 | 0.06 | 0.04 | 0.02 | 0.02 | 0.05 | 0.12 | 0.07 | 0.09 | 0.55 | 0.06 |
| Est. Soil erosion | 0.13 | 0.08 | 0.04 | 0.03 | 0.02 | 0.02 | 0.06 | 0.20 | 0.13 | 0.70 | 0.08 |
| K factor | 0.05 | 0.03 | 0.02 | 0.02 | 0.01 | 0.02 | 0.01 | 0.02 | 0.06 | 0.24 | 0.03 |
| Literacy | 0.06 | 0.03 | 0.03 | 0.02 | 0.01 | 0.02 | 0.01 | 0.01 | 0.03 | 0.24 | 0.03 |
| Total | 9.00 | 1.00 |
- Abbreviation: AHP, Analytical Hierarchical Process.
3.6 Consistency ratio (CR)
In the case of the AHP analysis, the computation of the CR is very crucial because there is a chance of serious inconsistencies in the pair-wise comparison. CR is used to ensure that the probability that the matrix judgments have been given was randomly generated (Dai et al., 2001). The formula to calculate the consistency ratio (CR) after Saaty (1980) is listed below:
Typically, if the CR is less than 0.10, the model is accepted. Higher CR values (>0.10) result in a recalculation of the entire mathematical model and an adjustment to the relative weights of the characteristics. In the present study, the CR value was found to be 0.09, and hence the model has been accepted.
3.7 Overlay of weights and map generation
3.8 Model validation using ROC curve
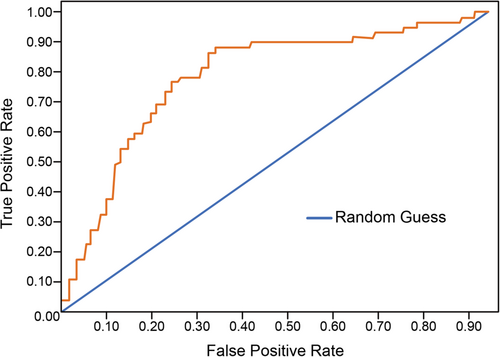
Here, TP is the true positive case, TN is the true negative case, FP is the number of false positive cases, and FN is the number of false negative cases. A steeper ROC curve indicates a higher number of Environmental Vulnerable Zones. The predictive precision of AUC ranges is between 1 and 0.9 (excellent), 0.9–0.8 (very good), 0.8–0.7 (good), 0.7–0.6 (moderate), and 0.6–0.5 (weak). In the present study, AUC range is 0.785, and hence it falls under the good category.
4 RESULTS
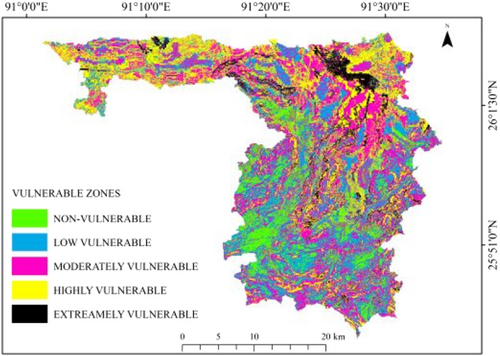
In the present study, the Kulsi River basin has been grouped into five classes, such as extremely vulnerable, highly vulnerable, moderately vulnerable, low vulnerable, and non-vulnerable, respectively, (Figure 5) based on the environmental vulnerability index value, which lies between 1 and 4.07. The lower the value of the index lowers the risk of environmental vulnerability and vice-versa. The AHP model showed that 10.94% area of the basin comes under non-vulnerable areas, 24.56% of the area comes under low vulnerable areas, 32.67% of the area comes under moderately vulnerable zones, 25.56% of the area comes under highly vulnerable areas and 6.24% of the areas are extremely vulnerable in the Kulsi basin (Table 5). The description of each zone is given below.
| Zones | Area (km2) | Area (%) |
|---|---|---|
| Non-vulnerable | 108.99 | 10.94 |
| Low vulnerable | 244.61 | 24.56 |
| Moderately vulnerable | 325.42 | 32.67 |
| Highly vulnerable | 254.63 | 25.56 |
| Extremely vulnerable | 62.21 | 6.24 |
4.1 Non-vulnerable and low vulnerable zone
These zones are mostly seen in the Pantan Reserve Forest, which is located towards the south-western part of the Basin. This zone is the foothill zone, from where many rivers like Drun, Khri, and other small rivulets come into the plain areas after crossing their difficult hilly terrain courses. These areas are heavily forested zones, and hence they have high rainfall. Moreover, this zone is located very near to river, and hence this region has the highest benefit of the ecosystem service being provided by the river streams. It is also to be noted that this zone also has high stream density, but the relatively higher slope of this area prevents this area from getting flooded in the monsoon season.
4.2 Moderately vulnerable zone
The moderately vulnerable zones are present throughout the Kulsi basin as depicted by the pink shade in Figure 5. The share of this zone is wider near the Kulsi reserve forest, where the Kulsi river bifurcates into two branches. Thin patches of this zone can also be seen in the extreme southern portion near by the Meghalaya border, consequent upon population growth, as it has deteriorated the low ecologically vulnerable areas. Similarly, a narrow linear patch of this zone has also penetrated along the Chamaria, Santoli, and Nagarbera area, consequent upon the increasing population and conversion of forest to agricultural land and built-up areas in recent times. The presence of low literacy rate has been responsible for the lack of awareness regarding environmental sustainability in this area, and natives are seen to be more inclined towards the home-based industries like suphari making and brick kiln industries in this area, further aggravating the situation.
4.3 High and extremely vulnerable zones
These zones are highly concentrated in the extreme eastern and western parts of the basin. These zones show a total absence of forest cover and a complete dominance of agricultural and built-up areas. Furthermore, these zones are also the most heavily populated parts of the Kulsi basin, comprising densely populated villages such as Kukurmara, Amtola, Tarigaon, Bihdia, Makeli, Balasiddhi, and Gumi on the eastern side, while villages like Jamlai, Khemari, Pijupara, Hekera, etc., are located on the western front. These areas are situated very close to national highways, which increases traffic and consequently affects air quality, leading to a rise in temperature in the surrounding areas. Improved road connectivity has further accelerated the rate of sand mining in these areas, posing significant environmental risks (Figure 5). EVI of the Kulsi River basin.
4.4 Validation of the AHP model
The ROC–AUC curve derived for the Kulsi basin using the ARC-SDM toolbox in the arc map 10.8 validates the prepared ecological vulnerability index map of the Kulsi basin (EVI). The AUC value stands at 0.785 and it is acceptable (Figure 6). Thus, it can be said that the AHP model has been able to identify the ecological vulnerability zones that match with that of the ground points collected during field visits to those areas.
5 DISCUSSION
5.1 Relevance of the MCDM-AHP in the environmental vulnerability assessment
The present study can be considered as a holistic, comprehensive, precise, and cross-validated study on the environmental vulnerability assessment of the Kulsi basin. The multicollinearity test has confirmed that the selected factors for the assessment of the vulnerability status of the Kulsi basin have been adequate and capable of explaining the environmental vulnerability status of the basin. The ROC curve also confirms that the AHP model has correctly identified the vulnerability zones based on the selected criteria. This validated approach can act as a milestone in devising and formulating developmental activities in the basin, which can safeguard the sustainability of the basin.
5.2 Spatial variations in EVI
The multi-criteria-based AHP analysis has shown that the high vulnerability areas have been identified in the lower and middle course of the Kulsi River compared to the upstream areas. The high and extremely vulnerable areas (31.8% of the basin) are concentrated in the areas having high population concentration, proximity to the roads, LULC dominated by agricultural and built-up areas, low rainfall, gentler slope, and higher percentage of literacy rate among the dwellers. The growing population of this zone cannot be supported by mere cultivation and hence other means of livelihood like rising construction industry, sand mining excavations (mostly illegal) have started growing at a rapid pace in this zone (Figure 7). Assured high economic returns, requisition of low skills, and very low investment needed in the sand mining excavations have led to wide adoption of this mode of livelihood in this zone. Extensive sand excavation in the northern part of the basin has resulted in the lowering of water availability in its downstream section. Moreover, the ground water table in various parts of the basin such as Boko, Rajapara, Bamunigaon, and Rani where it reduced from 1.46, 1.45, 1.61, and 1.49 m to 3.75, 2.5, 3.14 and 2.19 m, respectively during the period 1994 to 2017 as per the records of Indian Water Resource Department.
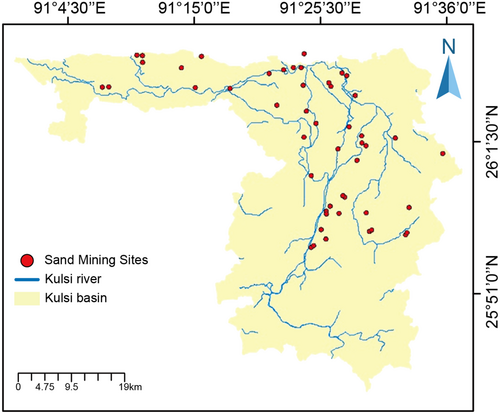
In addition to this, the Government of Assam to expand industries in the state has opened up an Industrial growth center at Chatabari which spans a total area of 53.15 hectares and is engaged in the production of Automobile ancillary, Engineering goods, Plastics products, Paper products, Synthetic and Rubber based products, Agro based products. All of these industrial prospects are contributing significantly to the conversion of the forest land to built-up areas and thus making the lower reach of the Kulsi River highly vulnerable to ecological sustainability. It is very important to monitor that among the vulnerability classes as mentioned above, the areas under the moderately vulnerable zone are the highest and are evenly distributed in the upper, middle, and lower courses of the river. Therefore, with proper planning and implementation of the eco-friendly strategies, a huge area of worth 32.67% of the Kulsi basin can be transformed into low-vulnerable areas, which will be highly helpful in reversing the vulnerability status of the basin.
5.3 Ways to improve environmental vulnerability status
The ways to transform the moderately vulnerable areas into low or non-vulnerable areas mainly rests with the socioeconomic factors as they are directly controlled and determined by human-induced activities. Studies addressing the sustainability vulnerability status have often condemned that, compared to the natural factors, it is the socio-economic factors that devastate the ecological sustainability. For instance, the C factor or the cover management factor is directly derived from the LULC of the area concerned. Moreover, LULC has been contributing a lot in influencing environmental sustainability and often pushing environmental sustainability into highly vulnerable zones (Das et al., 2018; Rehman et al., 2022). The detrimental impact of the LULC on the environment can, however, be reduced with eco-friendly cover management strategies. Studies made by Chen et al. (2006) have confirmed that the adoption of methods like reclamation of barren land and converting it into low-vulnerability land use, limiting the area of coal mining, and improving forest productivity has greatly improved the vulnerability issues in the Datong City in China. Xue et al. (2019) discussed a very detailed proposal about ecological sustainability by classifying the area in the order of preference to be obtained for ecological restoration like Buffer and transition zone, Key ecological restoration, and absolute ecological restoration, which was helpful in the case of the Tarim River basin.
The Kulsi River basin can address the issue of environmental vulnerability status by dividing the watersheds into various zones as Core areas, Buffer zones, and peripheral zones based on the zones identified by the AHP method (Figure 5). The core areas will represent the extremely vulnerable areas; Buffer zones will depict moderately vulnerable areas, and peripheral areas will depict low vulnerable areas. Core areas should focus on the monitoring and evaluation of the vulnerability status using scientific approaches rather than quickly switching to eco-friendly measures as suggested by (Padmalal et al., 2008). Once the evaluation is completed, the government should lay policies that emphasize the restoration and upgradation of the already cultivated lands using traditional methods, restriction on the movement in the core zone, and limiting permission for unhealthy cover management factor. Moreover, the already existing dense and highly literate populace in the vulnerable zone, through their knowledge and awareness, can better adapt to vulnerable situations and can train the natives to concentrate and adhere to ideas of sustainable goals and development for environmental sustainability. Thus, it can be said in a nutshell that this core zone should be treated first by measuring the vulnerability level and its various aspects using research and analytical approaches.
Secondly, the cover management methods need to be focused upon for uplifting the buffer zone. This zone is crucial as, from this point, the vulnerability status can be reversed back if we properly adhere to eco-friendly measures such as Agro-forestry, Aquaculture, intercropping, and permaculture, which can greatly help in the reduction of the C-factor and thereby lower the risk of the environmental vulnerability in this zone. In the Kulsi basin, especially in the upper reaches of the river, the above-mentioned factors can be quite effective as this zone is already surrounded by low vulnerable areas and is surrounded with good natural conditions like abundant rainfall, nearness to streams, low k factor and situated at a distance from the main road which are congenial for restoration of ecological sustainability.
In addition, stakeholders and policymakers can play a significant role in reducing the ecological vulnerability of the Kulsi basin by conducting a detailed survey and prioritizing zone-specific restoration measures. The government's failure to regulate sand mining activities can only be addressed by introducing alternative, lucrative employment opportunities, such as aquaculture and agroforestry, to absorb the unskilled youth in the basin, ultimately improving the basin's vulnerability status. Furthermore, restoring ecological stability will help rejuvenate the river's aquatic diversity and attract policymakers and stakeholders to develop the riverine tourism potential that once flourished. Proper restoration, through concrete steps by stakeholders, can facilitate river navigation and preserve connecting streams that link the wetlands and Kulsi River, which are vital for ongoing biogeochemical cycles in the basin.
6 CONCLUSIONS
This study has elucidated the emerging environmental vulnerabilities within the Kulsi River basin, highlighting a gradual but significant development of vulnerability zones. These zones predominantly coincide with areas of high population density and economic development. The escalation of vulnerable zones poses a multifaceted threat to the basin, potentially leading to water scarcity, pollution, and habitat destruction. Addressing these vulnerabilities necessitates a concerted effort from policymakers, emphasizing the need for innovative and sustainable economic opportunities that align with ecological preservation and resilience. The introduction of eco-friendly initiatives, such as boating, the development of animal corridors, meditation spaces along the riverbanks, and eco-tourism, is recommended to mitigate the adverse impacts of human activities, particularly sand mining. These initiatives not only promise to enhance the river's ecological sustainability but also offer viable economic alternatives for the local youth, steering them away from environmentally detrimental activities. Furthermore, the study serves as a critical tool for policymakers, aiding in the identification of areas with extreme vulnerabilities that require immediate attention. It also projects the potential future vulnerabilities of the basin, should the status quo persist. The application of an ensemble of criteria for assessing ecological vulnerability, chosen for their lack of multicollinearity, underscores the robustness of our methodological approach. This comprehensive assessment framework is pivotal for crafting informed; evidence-based policies aimed at mitigating geomorphological hazards while promoting the sustainable management of the Kulsi River basin's natural resources. Thus, the findings from this study underscore the urgent need for integrated management strategies that encompass ecological conservation, hazard mitigation, and sustainable development. By fostering effective collaboration among stakeholders, it is possible to secure a resilient and sustainable future for the Kulsi River basin, safeguarding its valuable ecosystems against the increasing threats of environmental vulnerabilities and geomorphological hazards.
ACKNOWLEDGMENTS
The authors sincerely acknowledge the Geological Survey of India (GSI) for providing toposheets and the United States Geological Survey (USGS) for offering satellite images at no cost. They also extend their heartfelt thanks to the local people for their enthusiastic cooperation during field verification. Financial support from the Department of Science and Technology (DST), Government of India, under the FIST (Fund for Improvement of S&T Infrastructure) Program, is gratefully acknowledged. Author JD is especially thankful to the University Grants Commission (UGC), New Delhi, for awarding him the Dr. D.S. Kothari Post-Doctoral Fellowship (UGC-DSKPDF).
CONFLICT OF INTEREST STATEMENT
The authors declare that this study work is original and have duly acknowledged all the sources of information used in the paper. The authors declare no conflicts of interest.
ETHICS STATEMENT
Not applicable.
Open Research
DATA AVAILABILITY STATEMENT
The data that support the findings of this study are available from the corresponding author upon reasonable request.


