Spatial distribution and pollution assessment of nitrogen, phosphorus, and heavy metals in the surface sediments of Xiaonanhai Lake, Hubei Province
Abstract
Located in Nanhai Town, Songzi City, Hubei Province, Xiaonanhai Lake is the largest natural lake in Songzi. It was once severely polluted due to the discharge of urban and rural domestic sewage, disorderly development of agricultural planting, unregulated aquaculture, and poultry farming. However, relevant estimations of the pollutant content in its sediment have not been carried out. This study analyzed the spatial patterns of heavy metal pollution and eutrophication at 36 water sampling sites in the Xiaonanhai Lake area, focusing on eight heavy metals: Cd, Cr, Cu, Ni, As, Pb, Hg, and Zn. The nutrient status of the lake area was evaluated using the nitrogen-phosphorus comprehensive pollution index, and heavy metal pollution status of the lake area was evaluated using geo-accumulation and the potential ecological risk index. Spatial autocorrelation analysis revealed the spatial correlation and aggregation of eutrophication levels in Xiaonanhai Lake. The results showed that the overall trophic state of the Xiaonanhai Lake area was moderate eutrophication, with a gradually decreasing eutrophication level from north to south. The Chengnan Wastewater Treatment Plant in the northern part of the lake area and surface source pollution from aquaculture were the main nitrogen and phosphorus sources. The overall ecological risk index of heavy metal pollution was medium and gradually weakened from north to south, consistent with the thickness of the bottom mud. The heavy metal pollution load was mainly precipitated from the bottom mud in the lake area. The eutrophication and heavy metal pollution levels in the lake area showed significant positive spatial autocorrelation, the influence range of the regional eutrophication level was small, and the spatial heterogeneity of the eutrophication and heavy metal pollution levels in Xiaonanhai Lake was relatively high. The northern part of the lake was a hotspot (high/high aggregation) of eutrophication (p < 0.01) while the southern part was a cold spot (low/low concentration; p < 0.05). The middle and northern part of the lake area was the hot spot (high/high concentration) of heavy metal pollution level (p < 0.1) while the southern part was the cold spot (low/low concentration; p < 0.1). Therefore, when carrying out water environment management in Xiaonanhai Lake, the northern area and the middle area should be prioritized for eutrophication prevention and control and dredging.
1 INTRODUCTION
Lake pollution has become increasingly severe globally due to climate change, agricultural activities, industrial emissions, and domestic sewage. As lakes constitute nearly 90% of the Earth's surface freshwater resources, they play a crucial role in creating economic, social, and ecological benefits. However, over the last 100 years, the resilience of global lake ecosystems has been declining due to many stresses. This has led to many prominent ecological and environmental problems, which have become significant constraints to sustainable development both globally and regionally (Huang et al., 2022).
According to a global survey, 63% of lake water bodies worldwide had eutrophication issues (Wang et al., 2018). Similarly, heavy metal pollution is also a global problem for lakes. Global surveys between 1970 and 2018 demonstrated an increasing trend in the concentrations of lead, mercury, chromium, and manganese in lake sediments, while the levels of cadmium, zinc, and arsenic showed a declining trend (Niu et al., 2021).
Most lakes in China are facing ecological and environmental problems, such as deterioration of water quality and degradation of ecological functions (Ding et al., 2020). A 2019 survey showed that 69.5% of Chinese lakes were eutrophic, higher than the global average. Data published in 2017 indicated that 38 of 138 monitored lakes and reservoirs in China had heavy metal concentrations exceeding the Grade V water quality standard (Niu et al., 2021; Wang et al., 2018).
As an important part of lake ecosystems, sediments are vital for the survival of many aquatic organisms (Xiong & Li, 2020). Globally, lake sediments have increasingly become a prominent concern as a major pollutant source. Prof. Hou studied the relationship between the pollution characteristics of urban lake sediments and the depth of sediment dredging, noting that after the external pollution source of urban lakes was blocked, diffusion of pollutants from sediments into the overlying water body would become the main threat to water quality (Hou et al., 2023). The study investigated the spatiotemporal variations of eutrophication and sediment pollution in Baiyangdian, indicating that sediment pollution played an important role in the eutrophication process of a water body (Liu et al., 2020). Prof. Chang, Yin, Fang, Wang, and Liu respectively conducted systematic evaluations and analyses of the spatial and temporal distribution of surface sediments, ecological risks, pollution sources (Chang et al., 2023), potential ecological risks (Yin et al., 2011), seasonal variations in heavy metal concentrations (Fang et al., 2017; Wang et al., 2014), and the impact of water transfer on sediment pollution in the Taihu Lake Basin (Liu et al., 2020). Prof. Li and Xu respectively conducted systematic evaluations and analyses of the sediments in the inner lake and tributary basins of Dongting Lake to determine the spatial distribution of heavy metals in the Dongting Lake Basin, and used combined multivariate statistical techniques to identify the natural and/or anthropogenic sources of these heavy metals (Li et al., 2013; Xu et al., 2018).
These studies collectively highlight that pollutants released from sediments are a key issue for the health of lake ecosystems and water quality protection, requiring integrated management measures.
Representative pollutants in sediments include nutrients (e.g., nitrogen and phosphorus) and heavy metals, which exist in various forms (Yang et al., 2020). The “source-sink” effect on the overlying water bodies influences the cycling of nutrients and heavy metals in the whole water body. Changes in hydrological conditions and environmental factors lead to the rerelease of nutrients and heavy metals from sediments into the water body, resulting in secondary pollution that can easily lead to eutrophication of the water body and bioconcentration of aquatic organisms (Christophoridis et al., 2009; Wang et al., 2020). Therefore, identifying the spatial patterns and pollution characteristics of nutrients and heavy metals in sediments is important for the comprehensive remediation of lake water environments.
Located in the uppermost part of the Dongting Lake Ecological and Economic Zone, Xiaonanhai Lake is an important ecological conservation area (Ding et al., 2019). Xiaonanhai Lake was formed by the siltation of flood water caused by the Yangtze River dike breach in 1870, which has never been dredged or desilted. As an important ecological protection area in the Dongting Lake Ecological and Economic Zone, Xiaonanhai Lake faces pollution problems caused by agricultural tailwater and domestic sewage (Ding et al., 2019). Its unique historical background, policy guides, and typical nature of pollution sources make it an ideal case for studying lake pollution. This study aims to comprehensively determine the pollution status of nitrogen, phosphorus, and heavy metals in the surface sediments of Xiaonanhai Lake, providing support for the prevention and control of eutrophication and heavy metal pollution in the lake.
2 MATERIALS AND METHODS
2.1 Study area and sampling points
Xiaonanhai Lake (30°03′–30°08′ N, 111°47′–111°53′ E) is located in Xidawan, Nanhai Town, southeast of Songzi City, Hubei Province, at the intersection of Jianghan Plain and Dongting Lake Plain. It has a subtropical transitional monsoon climate, with four distinct seasons, an average annual temperature of 16.0°C, and an average annual precipitation of 1206.00 mm. The water area of Xiaonanhai Lake is 8.03 km2, and its normal storage level is 38.20 m. The water system of Xiaonanhai Lake is primarily a crisscrossing artificial water system composed of inlet ditches and outlet channels. The main inlet ditches are the Hongqi, Zhongcao, and Haozi ports, and the outlet channel is the Nanhaizha Gutter, which is finally discharged into the Songzi River (Ding et al., 2019).
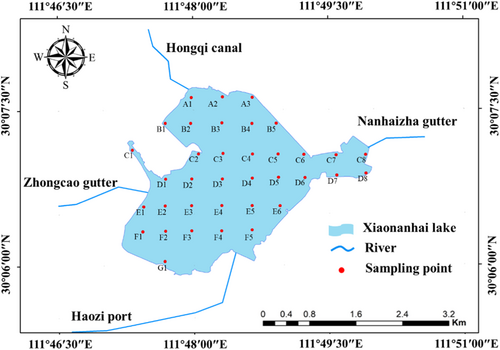
In August 2018, taking into account the spatial characteristics of Xiaonanhai Lake's morphology, the inlet and outlet rivers, and the purse seine farming, surface sediment samples were collected from 36 sampling points (as shown in Figure 1) using a Van Veen sediment sampler (with a sampling depth of 0–20 cm), with 5 kg of surface sediment collected at each point. At each sampling point, three parallel samples were collected, mixed together, and then stored in low-temperature self-sealing bags before being brought back to the lab for analysis.
2.2 Sample processing and evaluation methods
The mixed sediment samples were freeze-dried to remove impurities, ground using an agate mortar, processed through a 100-mesh nylon sieve, and sealed in self-sealing bags for measurement. The concentrations of (Cd), (Cr), (Cu), and (Ni) were determined by using microwave digestion, and inductively coupled plasma mass spectrometry. (Hg) was digested with a mixture of nitric and hydrochloric acids, (As) was digested with aqua regia, and (Pb) and (Zn) were digested with a mixture of nitric and perchloric acids. The concentrations were then measured by using atomic fluorescence spectrometry after digestion. SMT TP was used to determine total phosphorus (TP); and the semi-micro Kjeldahl method was used to determine total nitrogen (TN), following the adoption of the method described in (Li et al., 2023). In this experiment, all measurements were repeated three times, and the relative standard deviation of the measured values was below 5%, indicating a high degree of reproducibility and precision in the measurement process. The nutrient status of the surface sediments in Xiaonanhai Lake was evaluated by using the comprehensive pollution index method. The correlations between heavy metal elements were measured by using Pearson correlation analysis, and the pollution and ecological risk status of heavy metals in the sediments were assessed by applying the geoaccumulation index method and the potential ecological risk index method.
2.2.1 Comprehensive pollution index method
| Rating | STN | STP | FF | Hierarchy |
|---|---|---|---|---|
| 1 | <1.0 | < 0.5 | <1.0 | Clean |
| 2 | 1.0–1.5 | 0.5–1.0 | 1.0–1.5 | Lightly polluted |
| 3 | 1.5–2.0 | 1.0–1.5 | 1.5–2.0 | Moderately polluted |
| 4 | >2.0 | >1.5 | >2.0 | Heavily polluted |
2.2.2 Potential ecological risk index method
2.2.3 Geo-accumulation index method
2.2.4 Spatial autocorrelation analysis
Spatial autocorrelation analysis was used to study the eutrophication aggregation characteristics and analyze the spatial patterns of the Xiaonanhai Lake area. Spatial autocorrelation is a spatial statistical method, which refers to the potential interdependence between the observations of certain variables in the same or different distribution areas. It is an important indicator to test whether the attribute value of a variable is significantly associated with the attribute values of its neighboring spatial points. It can be divided into positive correlation and negative correlation, with the former indicating that the attribute value of a certain unit has the same trend of change as its neighboring spatial units, and the latter indicating the opposite. Spatial autocorrelation includes global and local autocorrelation, and the measurement indices are Global Moran's Index (Global Moran's I) and Local Moran's Index (Local Moran's I), respectively (Islam et al., 2022).
- (1)
Global spatial autocorrelation
Global Moran's I is a region-wide measure of the degree of aggregation or dispersion of spatial element attribute values (Liu et al., 2023). Global Moran's I is used to measure global spatial autocorrelation. It can be calculated as follows:
()()where n is the number of spatial units, xi and xj are the attribute values of spatial units i and j, respectively, and Wij is the matrix of spatial weight coefficients, which denotes the proximity of each spatial unit (An et al., 2023). Global Moran's I ranges from [−1, 1]; I > 0 indicates a positive spatial correlation: the larger the value, the more obvious the spatial correlation, that is, the spatial elements are aggregated in the overall spatial region; I < 0 indicates a negative spatial correlation: the smaller the value, the larger the spatial difference, that is, the spatial elements are dispersed in the overall spatial region; and I = 0 indicates that the spatial is stochastic, that is, the spatial elements are distributed in the overall spatial region. - (2)
Local spatial autocorrelation
Local Moran's I can be further used to determine the distribution of spatial agglomerations or isolated areas of spatial element attribute values (Zhang et al., 2022) and anomalies It can measure various agglomeration values and regions where agglomeration occurs. Local spatial autocorrelation uses Local Moran's I to analyze the spatial distribution status of each spatial unit in the study area within the overall area (Zhang et al., 2022) and to analyze the spatial pattern based on the value of each spatial unit. Local Moran's I can be calculated as follows:
()where n is the number of spatial units, xi and xj are the attribute values of spatial units i and j, and Wij is the spatial weighting coefficient matrix (Fen et al., 2018). I > 0 indicates a strong positive spatial autocorrelation between regional spatial unit i and neighboring spatial unit j, presenting local spatial agglomeration, and I < 0 indicates a strong negative spatial autocorrelation.
3 RESULTS
3.1 Nitrogen and phosphorus
3.1.1 Nitrogen and phosphorus distribution characteristics and pollution assessment
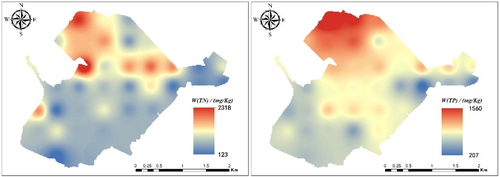
The TN and TP contents of surface sediments w(TN) and w(TP) varied from 123.27 to 2320.46 and 207.00–1560.00 mg/kg, respectively, with mean values of 846 ± 513.88 and 770 ± 266.38 mg/kg, respectively. The spatial distribution is shown in Figure 2. w(TP) showed a decreasing trend from the inlet of the Hongqi Canal to the lake along the inlet direction, and the concentration of w(TN) was much higher at the inlets of the Hongqi Canal, Zhongcao gutter, and the outlet. The concentration of w(TN) was much higher at the lake inlet and outlet of the Hongqi Canal than at the Zhongcao Gutter and Haozi ports.
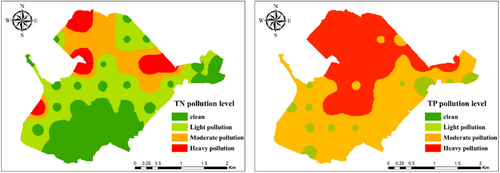
The single pollution indexes of TN and TP ranged from 0.12 to 0.85 and 0.49–1.83 (Figure 3). TN was in a heavily polluted state at the inlets and outlets of Hongqi canal and Zhongcao gutter, and a clean- to mildly polluted state at the outlet of Haozi port in the southern part of the lake area. TP was in a heavily polluted state in the central and northern parts of the lake area, and a mildly- to moderately polluted state in the southern part of the lake area.
3.1.2 Integrated assessment of nitrogen and phosphorus pollution and spatial autocorrelation analysis
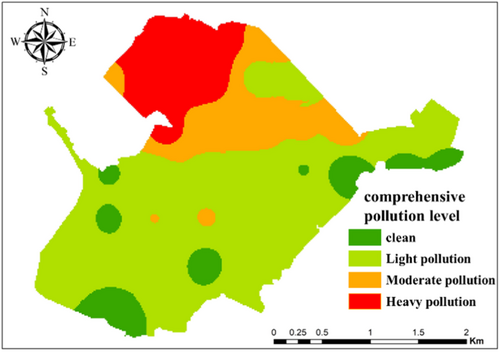
The comprehensive pollution index of Xiaonanhai Lake ranged from 0.13 to 7.39. The spatial distribution of the comprehensive pollution level of Xiaonanhai Lake was consistent with the pollution levels of TN and TP (Figure 4). The northern part of the lake was in a state of moderate to heavy pollution while the other areas were in a state of clean to light pollution.
GeoDa software was used to analyze the global spatial autocorrelation of the nitrogen and phosphorus composite pollution indices of the 36 sampling points in Xiaonanhai Lake. The results showed that the Global Moran's I of the composite pollution indices of the 36 sampling points in Xiaonanhai Lake was 0.45, indicating that the nitrogen and phosphorus pollution level of Xiaonanhai Lake was spatially and significantly positively correlated with spatial autocorrelation (p < 0.001). The composite pollution indices of the various points tended to be spatially aggregated. The spatial aggregation of the comprehensive pollution index at each point indicated that the spatial structure of the eutrophication level of the lake was well reflected at the sampling scale of this study.
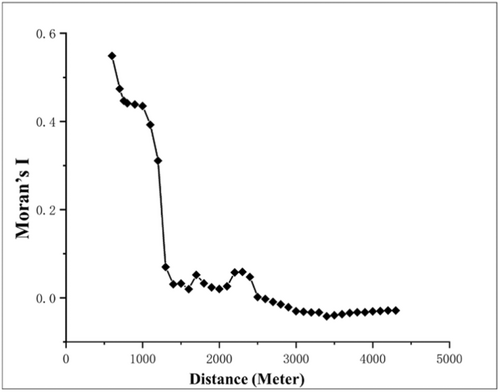
The relationship between the spatial autocorrelation and distance of the nitrogen and phosphorus indices of Xiaonanhai Lake is shown in Figure 5. In the range of 0–2.40 km, Local Moran's I > 0, indicating positive spatial autocorrelation and spatial aggregation; in the range of 2.40–4.30 km, Local Moran's I < 0, indicating negative spatial autocorrelation and spatial isolation.
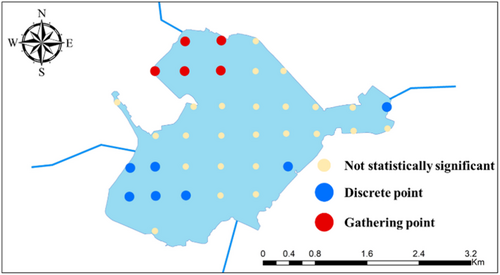
Local spatial autocorrelation was analyzed to quantify the degree of spatial aggregation of the nitrogen and phosphorus composite pollution index in the lake area. The spatial distribution of cold hotspots was divided according to the two-sided test at 99% confidence level, as shown in Figure 6. The hot spots (high/high aggregation) of the comprehensive pollution index were mainly distributed in the lake mouth area of the Hongqi Canal Lake Entry Area, and the cold spots (low/low aggregation) were mainly distributed in the lake mouth area of the Zhongcao Gutter Lake Entry Area.
3.2 Heavy metals
3.2.1 Heavy metal distribution characteristics and pollution assessment
The mean w(Cu), w(Zn), w(Pb), w(Cr), w(Cd), w(As), w(Hg), and w(Ni) in surface sediments were 35.99 ± 16.42 (mg/kg), 86.96 ± 30.32 (mg/kg), 28.92 ± 5.57 (mg/kg), 87.28 ± 28.72 (mg/kg), 0.09 ± 0.04 (mg/kg), 10.96 ± 3.57 (mg/kg), 0.09 ± 0.09 (mg/kg), and 37.37 ± 12.10 (mg/kg), respectively. w(Hg) and w(Ni) were 1.36 and 1.44 times higher than their respective background values in Hubei Province. Except for w(As) and w(Cd), they were all higher than the environmental background values of soil heavy metals in Hubei Province. Referring to the Canadian freshwater sediment heavy metal quality guidelines (as shown in Table 2), the proportions of sampling sites where concentrations of w(Hg), w(Cu), w(Pb), w(Cd), and w(Zn) fall below their respective TEL criteria (TEL indicates the threshold concentration of pollutants in environmental media at which minor adverse effects may occur in ecosystems or receptors; below this level, adverse effects are unlikely or minimal) were 86.11%, 50.00%, 91.67%, 100.00%, and 97.22% respectively, indicating that negative biological impacts are nearly non-existent. For w(Cr) and w(As), the proportions of sampling sites with concentrations ranging between TEL and PEL (PEL signifies the concentration at which pollutants in environmental media are likely to cause significant adverse effects on ecosystems or receptors) were 50.00% and 86.11% respectively, suggesting that negative biological effects occur occasionally. The proportion of sampling sites where w(Ni) exceeds the PEL criteria was 69.44%, indicating that negative biological effects occur frequently.
| Item | Cu | Zn | Pb | Cr | Cd | As | Hg | Ni |
|---|---|---|---|---|---|---|---|---|
| Background value | 23.4 | 64.8 | 22.0 | 75.6 | 0.085 | 9.4 | 0.025 | 32.8 |
| TEL | 36 | 123 | 35 | 37 | 0.6 | 5.9 | 0.17 | 18 |
| PEL | 197 | 315 | 91 | 90 | 3.5 | 17 | 0.49 | 36 |
- Note: TEL is the threshold effect concentration; PEL is the probable effect concentration; both are Canadian freshwater sediment-quality benchmarks.
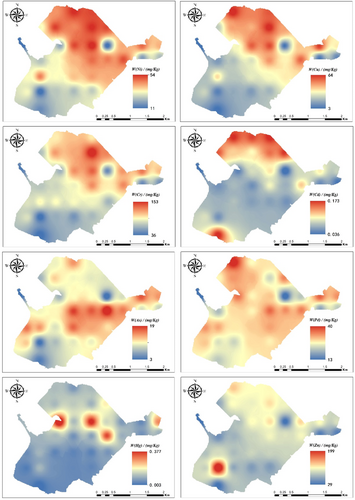
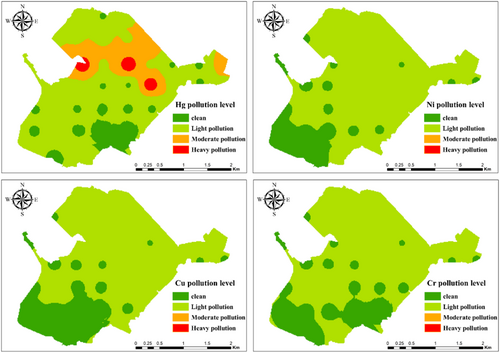
The content of each heavy metal in Xiaonanhai Lake was high, and pollution was relatively serious (Figure 7); w(Cu), w(Pb), w(Cr), w(Cd), and w(Ni) pollution were higher in the northern part of the lake area and w(As) and w(Hg) pollution were more prominent in the central part of the lake area. In the southern part of the lake area, except for some areas where w(Cd) and w(Zn) were higher, the contents of the other six heavy metals were lower, and the pollution was lighter. Correlation analyses (see Table 3) showed that there was no correlation between As and Cd and Zn or between Cd and Zn, whereas the remaining five heavy metals were significantly correlated with each other.
| Heavy metal | As | Hg | Cu | Pb | Cd | Zn | Ni | Cr |
|---|---|---|---|---|---|---|---|---|
| As | 1 | |||||||
| HG | 0.025 | 1 | ||||||
| Cu | 0.501** | 0.224 | 1 | |||||
| Pb | 0.644** | 0.237 | 0.658** | 1 | ||||
| Cd | 0.051 | −0.042 | 0.597** | 0.364* | 1 | |||
| Zn | 0.214 | 0.151 | 0.582** | 0.464** | 0.299 | 1 | ||
| Ni | 0.669** | 0.141 | 0.920** | 0.627** | 0.551** | 0.482** | 1 | |
| Cd | 0.557** | 0.195 | 0.921** | 0.530** | 0.491** | 0.474** | 0.911** | 1 |
- ** At the 0.01 level (two-tailed), the correlation is significant. **At the 0.05 level (two-tailed), the correlation is significant.
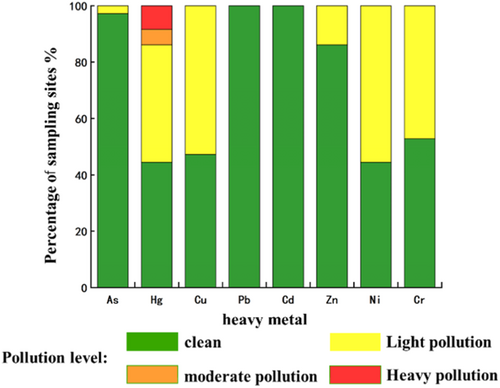
The evaluation results of the ground accumulation index method are shown in Figure 8. All six heavy metals were in a polluted state and in the order Hg > Ni > Cu > Cr > Zn > As, of which Hg, Ni, Cu, and Cr were the main pollutants. Hg was in a mildly polluted state at 41.67% of sites, moderately polluted state at 5.56% of sites, and heavily polluted state at 8.33% of sites. For Ni, Cu, and Cr, 55.56%, 52.78%, and 47.22% of sites were in a mildly polluted state (Figure 9). As and Zn were less polluted, with 80.00% of sites in a clean state.
3.2.2 Spatial autocorrelation analysis of potential ecological risk index of heavy metals
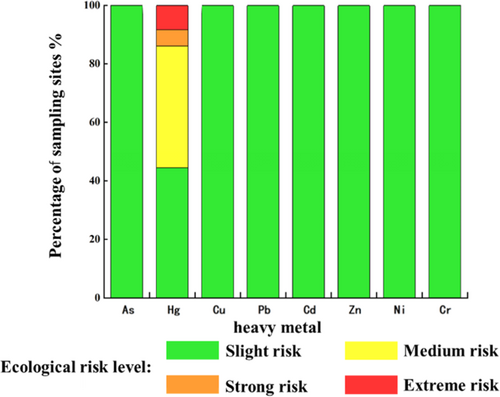
As can be seen from the evaluation results of the individual potential ecological risk index method in Figure 10, all heavy metals except Hg were at slight ecological risk and the average ecological risk index of Hg was 54.37, representing a medium ecological risk level. Among all the sampling points of Hg, 44.44%, 5.56%, and 8.33% were at medium, strong, and very strong ecological risk levels, respectively. The average value of the potential ecological risk index ranged from 48.12 to 366.18, with a mean value of 48.12, indicating a medium risk level.
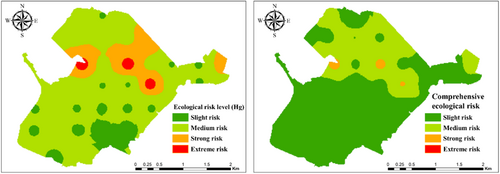
The spatial distribution and evaluation of the potential ecological risk indices of heavy metals in Xiaonanhai Lake are shown in Figures 11 and 12, respectively. Overall, the potential ecological risk index of the north-central part of the lake was higher than that of the southern part, and most of the potential ecological risk index of heavy metals was at a slight risk level. The average potential ecological risk index of the sampling points of the lake was 166.60, indicating a medium risk level, and the spatial distribution of the integrated contamination index was similar to the pattern of the bottom silt and elevation of the lake.

GeoDa was used to analyze the global spatial autocorrelation of the heavy metal potential ecological risk index of the 36 sampling points in Xiaonanhai Lake. The Global Moran's I of the heavy metal potential ecological risk index of the 36 sampling points in Xiaonanhai Lake was 0.12, indicating that the level of heavy metal contamination in Xiaonanhai Lake was spatially autocorrelated (p < 0.1), and that the heavy metal potential ecological risk index of each point tended to be spatially aggregated.
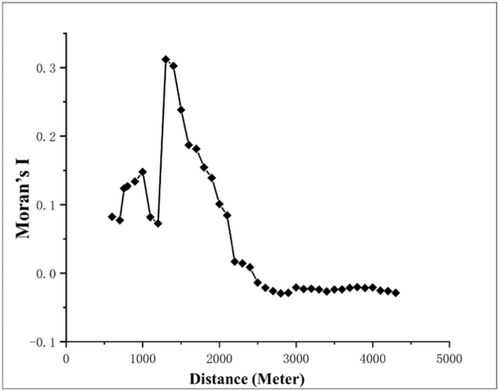
The relationship between the spatial autocorrelation and the distance of the potential ecological risk index of heavy metals in Xiaonanhai Lake is shown in Figure 13. In the range of 0–2.10 km, Local Moran's I > 0, indicating positive spatial autocorrelation and spatial aggregation. In the range of 2.10–4.30 km, Local Moran's I < 0, indicating negative spatial autocorrelation and spatial isolation.
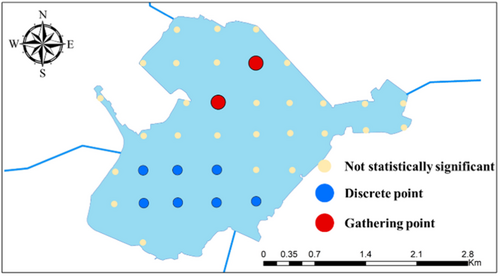
To further analyze the degree of spatial aggregation of heavy metal pollution levels in Xiaonanhai Lake, local spatial autocorrelation analysis was used to quantify the degree of spatial aggregation of the potential ecological risk index in the lake area. The spatial distribution of hot and cold spots was divided according to the two-sided test at 90% confidence level (Figure 14). The hot spots (high/high aggregation) of the potential ecological risk index were mainly distributed in the northern and central parts of the Xiaonanhai Lake, while the cold spots (low/low aggregation) were mainly distributed in the southern part.
4 DISCUSSION
4.1 Characterization of the spatial distribution and autocorrelation of nitrogen and phosphorus in Xiaonanhai Lake
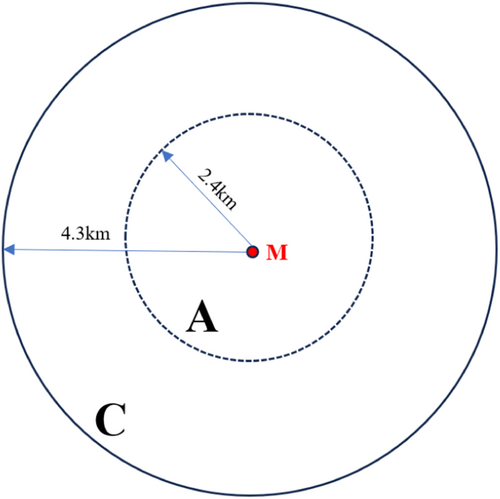
The overall nitrogen and phosphorus pollution of Xiaonanhai Lake was high in the north and low in the south. The main pollution load was concentrated at the inlet of Hongqi Canal into the lake. The total load of phosphorus pollution was higher than that of nitrogen pollution. The spatial structure and eutrophication exhibited a strong spatial correlation. Figure 15 shows the spatial characteristics of eutrophication in Xiaonanhai Lake, where M is an arbitrary point in the lake area, A is a circular area centered on M with a radius of 2.40 km, and C is a circular area centered on M with an outer diameter of 4.30 km and an inner radius of 1.90 km. M was positively correlated with the eutrophication level at any point in area A and negatively correlated with the eutrophication level at any point in area C. The spatial characteristics of lake area eutrophication levels were as follows: eutrophication levels at closely located points showed a significant positive correlation. As the distance increased, eutrophication levels gradually exhibited a negative correlation. The positive correlation reflected the radius of influence of the eutrophication level in Xiaonanhai Lake, which was approximately 2.40 km. The negative correlation reflected the average distance between the regions with large differences in eutrophication levels in the lake area; the distance indicated that the eutrophication levels differed in the northern and southern parts of Xiaonanhai Lake. The spatial differences in the eutrophication levels of Xiaonanhai Lake were strong due to the small radius of influence of the regions with the same or similar eutrophication levels.
The local autocorrelation results showed that the hotspot (high/high concentration) areas of the integrated trophic state index were mainly distributed in the northern part of Xiaonanhai Lake, that is, the area where the Hongqi Canal entered the lake (p < 0.01). According to the literature (Ding et al., 2019), the total amount of TN entering the lake of Xiaonanhai Lake was 141.20t/a, of which most of the sewage in the old city flowed into the Hongqi Canal through the pipeline network due to lack of rainwater and sewage diversion to the wastewater treatment plant; the treated reclaimed water met the discharge standard of Grade IB in the “Discharge standard of pollutants for municipal wastewater treatment plant” (GB18918-2002), and was discharged into Xiaonanhai Lake through the inverted siphon pipe. At the same time, the largest fish pond in the northeast of Xiaonanhai Lake led to the highest TP pollution load and the most serious eutrophication in the northern part of the lake. Urban sewage is mainly discharged into the New River. As Xiaonanhai Lake is recharged from the New River through the Zhongcao gutter, some of the low-concentration pollution loads entered Xiaonanhai Lake and mixed with the high-concentration pollution loads of the Hongqi Canal, leading to insignificant spatial autocorrelation of nitrogen and phosphorus in the central part of the lake area. Although the pollution load in the Haozi port catchment was slightly higher than that in the Zhongcao gutter catchment, the flow self-purification of the pollution load in the northern part and the confluence in the central part of the water body caused low-low aggregation in the southern part.
4.2 Characterization of spatial autocorrelation of heavy metal pollution in Xiaonanhai Lake
According to the distribution characteristics of heavy metals in Xiaonanhai Lake, evaluation of geo-accumulation, ecological risk index (Aftab, et al., 2023), and correlation analysis, it can be seen that except for Zn element, heavy metal pollution was mainly concentrated in the central and northern part of the lake. w(Hg) and w(Ni) were 1.36 and 1.44 times their respective background values, and Hg, Ni, Cu, and Cr were the main pollutants of the geo-accumulation, and except for Hg, other heavy metals were at a slight ecological risk level. The average ecological risk index of Hg was 54.37, indicating a state of medium ecological risk, and the correlation between Hg and the other seven heavy metals was significant, except for the correlation between As and Cd, Zn, and Cd and Zn, and the correlation between the other five heavy metals was significant.
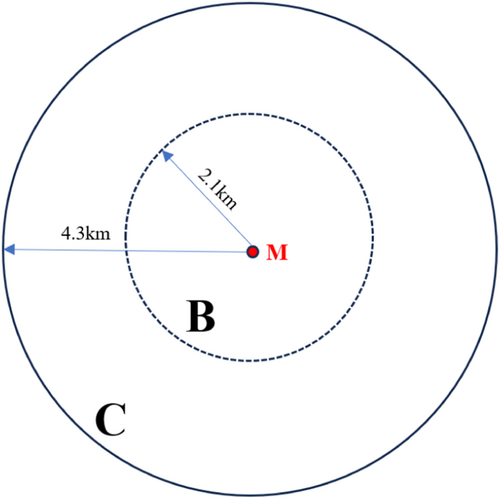
The average value of the potential ecological risk indices of the sampling points in the Xiaonanhai Lake area was 166.60, indicating a moderate ecological risk level. The Global Moran's I of the potential ecological risk index of heavy metals at the 36 sampling points in Xiaonanhai Lake was 0.12, with a positive spatial autocorrelation on the spatial structure, indicating that the eutrophication level of Xiaonanhai Lake had some spatial correlation. Figure 16 shows the concept of spatial characteristics of heavy metal pollution in Xiaonanhai Lake: M is an arbitrary point in the lake area, B is a circular area centered on M with a radius of 2.10 km, and C is a circular area centered on M with an outer diameter of 4.30 km and an inner radius of 2.20 km. M showed a positive correlation with the level of heavy metal pollution at any point of the area B, and a negative correlation with the level of heavy metal pollution at any point of the area C. The spatial characteristics of the heavy metal pollution levels in the lake area were as follows: the heavy metal pollution levels at closely located points were positively correlated, and the eutrophication level was negatively correlated with the distance. The positive correlation of proximity reflected the radius of influence of the area with the same level of heavy metal pollution as Xiaonanhai Lake, which was about 2.1 km in radius. From this distance, it can be seen that the eutrophication level of Xiaonanhai Lake had a large difference between the northern and southern parts, and it also reflected that there was a spatial difference in the heavy metal pollution level of Xiaonanhai Lake, owing to the smaller radius of influence of the area with the same or similar heavy metal pollution levels, which caused the spatial heterogeneity of the heavy metal pollution level of Xiaonanhai Lake.
The local autocorrelation results showed that the hotspot (high/high concentration) areas of the potential ecological risk index were mainly distributed in the middle and northern parts of Xiaonanhai Lake, consistent with the depth distribution of the bottom sediment of the lake. The bottom sediment of Xiaonanhai Lake was mainly silted near the outlet, followed by the northern lake area and near the inverted siphon pipe outfall of the Hongqi Canal. The least silted areas were near the Zhongcao gutter in the southeastern part of the lake. Considering the low pollution load of heavy metals in the lake, the main cause of heavy metal pollution was the precipitation of heavy metals from the bottom sediment, thus forming hot spots (high and high aggregation) in the northern and northeastern parts of the lake, and cold spots (low and low aggregation) in the southern part.
4.3 Significance of identifying the spatial pattern of pollution
Identifying the spatial patterns and distribution characteristics of heavy metal and nitrogen-phosphorus pollution holds multiple implications. First, it can help precisely locate the pollution sources. For example, when the pollution concentration suddenly increases at a certain inlet of a lake, the pollution enrichment caused by the inflow can be considered. Through correlation analysis of multiple elements and spatial autocorrelation analysis, it is possible to identify the pollution sources of the incoming water. When there are autocorrelated hotspots within the water area, it could be due to the release of the lake sediment. Meanwhile, by grading the pollution levels, not only can the locations of pollution sources be determined, but also the contributions of different pollution sources can be distinguished, thus clarifying the goals for pollution control.
Second, it enables the optimization of the layout of the monitoring network based on the pollution spatial patterns. In areas with severe pollution, the monitoring points can be increased, while in areas with light pollution, the monitoring frequency and the number of monitoring points can be appropriately reduced.
Furthermore, it can facilitate the effective implementation of pollution control measures and provide a basis for selecting appropriate treatment technologies and measures. For instance, if heavy metal pollution is concentrated in the river sediment, the dredging method can be adopted. If nitrogen–phosphorus pollution is caused by the direct discharge of domestic sewage, the construction of sewage treatment facilities can be strengthened. For lake eutrophication, the input of nitrogen and phosphorus can be reduced by building an ecological buffer zone along the lakeshore.
5 CONCLUSION
The main conclusions of the study are as follows:
- (1)
The overall eutrophication level of Xiaonanhai Lake was moderate; the highest level was observed in the northern part of the lake and the lowest level in the southern part. The global Moran's I index of the comprehensive nitrogen and phosphorus pollution status index of Xiaonanhai Lake was 0.45, indicating that the eutrophication level of the lake showed a significant positive spatial autocorrelation at the sampling scale. At this sampling scale, the positive spatial autocorrelation of the eutrophication level of Xiaonanhai Lake was significant at approximately 2.40 km in the near-distance direction. There were spatial differences in the eutrophication levels of Xiaonanhai Lake, and the spatial heterogeneity was strong.
- (2)
The potential ecological risk index of heavy metals in Xiaonanhai Lake was medium; the northern part of the lake had the highest level of heavy metal pollution (strong ecological risk), and the southern part of the lake had the lowest level (slight risk). The Global Moran's I index of the potential ecological risk index of Xiaonanhai Lake was 0.12, indicating that the heavy metal pollution level in the lake area showed a positive spatial autocorrelation at the sampling scale. At this sampling scale, the positive spatial autocorrelation of eutrophication level in Xiaonanhai Lake was significant at a distance of approximately 2.10 km. The spatial heterogeneity in the differences in the eutrophication level was strong.
- (3)
Hot spots (high/high concentration) of eutrophication and heavy metal pollution levels in Xiaonanhai Lake were mainly distributed in the central and northern parts of the lake (p < 0.01, p < 0.1), while cold spots (low/low concentration) of eutrophication and heavy metal pollution levels were mainly found in the southern part of the lake (p < 0.01, p < 0.1).
The findings indicate that dredging should be carried out in the northern part of the lake to support the prevention and control of eutrophication and heavy metal pollution in Xiaonanhai Lake.
ACKNOWLEDGMENTS
The study is funded by the China Institute of Water Resources and Hydropower Research (IWHR), “Innovative Team for Theoretical and Technological Research on Ecological Landscape Construction of Urban and Rural Water Systems.” Grant/Award Number: WE0145B042021.
ETHICS STATEMENT
We hereby confirm that this submission complies with all applicable international and national ethical regulations.
-
Human embryos/foetus, including human embryonic stem cells: No
-
Recombinant DNA: No
-
Empirical work, medical studies, surveys or questionnaires involving human beings: No
-
Human cells and tissues: No
-
Empirical work or medical studies with animals: No
All data and materials presented in this study were obtained and analyzed in accordance with ethical standards, and no human or animal subjects were involved. The authors declare that this manuscript has not been published elsewhere and contains no plagiarized content.
Open Research
DATA AVAILABILITY STATEMENT
The data used in this study involve privacy and cannot be publicly disclosed.


