Fine-scale damage assessment of urban flooding based on the 1D/2D coupled hydrodynamic model
Abstract
Due to the high population density and economic property in urban environments, urban flooding can result in substantial economic losses. However, accurate urban flood modeling and assessing the associated damages are challenging due to complex urban layouts and rugged topography. Furthermore, the rapid development of urban underground spaces has introduced additional complexities. To address the demanding need for accurate flood modeling and damage assessment in cities, a fine-scale flood damage assessment method was proposed in this study, based on the 1D/2D coupled hydrodynamic model, which can not only assess the flood damage on the ground surface but also evaluate the flood loss in underground spaces. Taking the Gangxi drainage area in Wuhan City, China as a case, this study extensively discussed the flood inundation processes on the ground surface as well as in the buildings and underground spaces, under different rainfall scenarios with the return period ranging from 2 to 200 years. Based on the high spatial-temporal hydrodynamic simulations, the flood damage degrees were evaluated for the buildings and underground spaces with different industry types. The results indicated that the inundation of buildings and underground spaces in densely built cities cannot be neglected in urban flood modeling. Buildings with public service attributes can have a higher flood damage degree, as compared with other types of buildings and underground spaces.
1 INTRODUCTION
Under the background of global climate change and urbanization, urban floods in China are becoming increasingly serious, causing huge economic losses and social impacts (Wang et al., 2021). Cities are the gathering place of human civilization and socioeconomic wealth, the complexity of urban spatial structure and infrastructure significantly affected the process and consequences of urban flooding, distinguishing them from natural watersheds. To ensure the sustainable development of the social economy and foster a harmonious coexistence between humans and nature, it is crucial to properly manage the problem of urban floods. Accurately simulating urban flood processes and evaluating the corresponding flood losses are essential steps in developing urban flood control and disaster mitigation measures. Modeling urban flood events requires a reasonable representation of complex hydrology and hydrodynamic processes, including rainfall-runoff, surface inundation, pipe flow in the drainage system and so forth. Existing urban flood models can be classified into two main categories: hydrology models and hydrodynamic models. It should be noted that due to the intricate nature of urban flooding and the interplay between hydrological and hydrodynamic processes, current urban flood models should incorporate both hydrological and hydrodynamic mechanisms.
An insufficient discharge capacity of the drainage system is an important contributing factor to the occurrence of urban floods (Chang et al., 2015). The insufficient discharge capacity of the urban drainage system is reflected in not only the insufficient capacity of the drainage system but also the low surface water drainage capacity caused by the insufficient number of street inlets, improper space layout, and severe clogging (Xia et al., 2022). 1D/2D coupled hydrodynamic models can simulate both the surface flow and the pipe flow, which can reflect the actual movement of flow in the process of urban rainstorms with as few assumptions as possible. Therefore, such a type of model has significant advantages in the field of urban flood simulation.
The inundation of houses, roads, and underground spaces in urban floods can directly cause property losses (Shin et al., 2021; Xia et al., 2018). Roads serve as the primary pathways for floodwaters during flood disasters, resulting in high water depths and flow velocities. These conditions pose a direct threat to the safety of pedestrians and vehicles, potentially leading to instability and endangering lives (Xia et al., 2011). In addition, severe inundation of critical infrastructure such as hospitals and subway stations can trigger a cascade of chain reactions, directly affecting the normal operation of cities (Ning et al., 2020). Due to the multifunctionality encompassing transportation, commerce, and municipal administration, urban underground spaces are particularly vulnerable to flooding disasters. Flood disasters not only pose a direct threat to the safety of lives and properties but also have the potential to extend beyond the immediate affected areas, leading to substantial indirect losses that may surpass the direct losses (Forero-Ortiz, Martínez-Gomariz, & Cañas Porcuna, 2020; Li et al., 2022).
Urban flood damage assessment can provide technical support for risk management and the formulation of disaster prevention and mitigation measures (McGrath et al., 2019; Salman & Li, 2018; Zischg et al., 2018). In recent years, with the deepening of investigation on urban flood loss assessment, there has been a more systematic understanding of the connotation of flood damage (De Moel & Aerts, 2011; Lazzarin et al., 2022; Ten Veldhuis & Clemens, 2010; Thrysøe et al., 2021). The most widely used flood damage assessment method is the application of water depth-flood damage curves (Jongman et al., 2012; McGrath et al., 2019; Pistrika et al., 2014). The depth-damage curve usually refers to a relationship between inundation depth and relative or total property damage. Typically, depth-damage curves are obtained by analyzing the previous flood loss data sets or based on the investigation of items inside buildings (Velasco et al., 2016). In recent years, many scholars have coupled depth-damage curves with hydrodynamic models to assess the damages caused by urban floods (Martínez-Gomariz et al., 2021; Velasco et al., 2016). However, most flood loss assessment studies only focus on the property damage on the urban ground surface (Lazzarin et al., 2022). In recent years, urban underground spaces have experienced rapid development. Due to the special topography and spatial structure, urban underground spaces are more prone to flood disasters. Typical urban underground spaces include down passages, underground shopping malls, and underground transportation facilities (subway stations, underground tunnels, etc.). As urban underground spaces are relatively small and enclosed, once inundated, they will quickly be filled with water, leading to high economic losses and casualties (Hou et al., 2022). To evaluate the flood damage, many researchers used very fine 3D or 2D hydrodynamic models to simulate the flooding process of underground spaces, focusing on inundation characteristics and optimization of evacuation routes. However, such precise numerical simulations require a very large computation burden and therefore cannot be used to assess the flood risk in a large-scale urban area. Contrary to fine-scale assessments, Lyu et al. (2018) used a GIS-based analytic hierarchy process (AHP) and the interval AHP (I-AHP) methods to evaluate the flood risk of underground spaces in mega-cities. GIS-based methods can not reflect the key disaster-causing hydraulic features, therefore such a flood risk assessment method has high uncertainty.
In this study, a high-resolution urban flood damage assessment method was proposed based on fine-scale hydrodynamic modeling. The method not only allows for the evaluation of building loss rates on the urban ground surface but also enables the assessment of potential flood damage in underground spaces. The current study is organized into five sections. Section 2 introduces the governing equations and numerical methods of the 1D/2D coupled hydrodynamic model used in this study as well as the flood damage assessment method. Section 3 provides the details on the data used in this study and general features of the study area. In Section 4, the accuracy of the proposed model was validated, and presented the simulated flood inundation processes in both ground surface and underground spaces, along with an analysis of the impact of rainfall intensity on flood damages. Finally, Section 5 presents the conclusions drawn from the study.
2 NUMERICAL MODELING AND FLOOD DAMAGE ASSESSMENT METHOD
In this study, a 1D/2D coupled hydrodynamic model for urban flooding developed by Dong, Xia, Zhou, et al. (2022) is adopted, which couples a 2D surface runoff module, a sewer flow module, and a flow exchange module between surface runoff and underground sewer flow. To improve the computational efficiency, the OpenMP method was adopted in this model to parallelization critical computation loops. The accuracy of this model has been validated through simulating several experimental cases and actual urban flood events. It was proved that the model can provide a quick and accurate simulation of the whole process of urban flooding from the beginning of rainfall. For the current situation of the study area, an infrastructure inundation module was proposed and coupled with the surface runoff module. This section briefly introduces the governing equations and key numerical schemes of the 1D/2D coupled hydrodynamic model.
2.1 2D surface runoff module
2.1.1 Governing equations
2.1.2 Numerical method
Urban surface runoff has the typical characteristics of small water depth, large flow velocity, and complex flow patterns. Mainstream numerical algorithms in computational hydrodynamics are developed in the field of computational aerodynamics (Van Leer, 1974; Cea & Vázquez-Cendón, 2009). However, due to the existence of source terms such as friction term and bottom slope term, these numerical algorithms need special handling, which is rather more complex (An & Yu, 2012; Martins et al., 2015). The adopted numerical method was based on the unstructured mesh finite volume framework, in which the whole computational domain is divided into a series of triangular meshes (Benkhaldoun et al., 2007). Although the generation process of the unstructured mesh is more complicated, the unstructured mesh has higher flexibility compared with the structured mesh, and it is more suitable for study regions with actual topography and complex boundaries (Xia et al., 2010). The Surface Reconstruction Method (SRM) method proposed by Xia et al. (2017) was adopted to reconstruct the Riemann state variables on both sides of mesh edges to achieve the Well-Balanced property (Benkhaldoun et al., 2007). Once the Riemann state variables are obtained, the numerical flux through cell edges can be calculated using approximate Riemann solvers. In this model, the commonly used HLLC approximate Riemann solver is adopted.
2.2 Flow exchange module
2.3 Underground sewer flow module
2.3.1 Governing equations
2.3.2 Numerical method
The present module divides underground pipelines into a series of homogeneous computational cells and therefore this treatment is able to simulate the complex unsteady hydrodynamic processes. To facilitate the numerical simulation, the Two Component Approach (TPA) is introduced in this module to unify the governing equations under the two flow regimes (Sanders & Bradford, 2011; Vasconcelos et al., 2006). As the numerical method is based on the first-order finite volume method framework, the Riemann state variables on cell edges are directly set to the cell-centered states. The numerical fluxes are calculated using the HLL Riemann solver.
2.4 Flood inundation module of key infrastructure
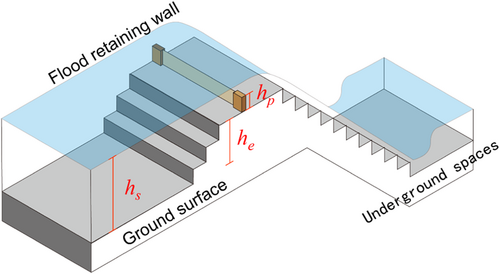
Once the flood level exceeds the entrance of buildings or underground spaces, the flow will be gushing into the interior and causing serious inundation. Traditional hydrodynamic models of urban flooding usually neglect the inundation process for urban surface buildings, especially for underground spaces (Schubert & Sanders, 2012; Shen et al., 2018). A numerical modeling study conducted by Dong, Xia, Li, et al. (2022) showed that in extreme rainstorm events, the water volume entering the buildings can account for more than 15% of the total storm volume. Therefore, it is necessary to consider the inundation process of buildings and underground spaces in the modeling of urban floods.
2.5 Flood damage assessment module
2.5.1 Damage assessment of buildings
Property damage is a very important component of urban flood losses, and therefore, scientific, reasonable, and efficient assessment of property losses is crucial for urban flood management. As the depth-damage curves have a clear physical mechanism and are very easy to use, therefore are widely used in flood damage assessment studies (Velasco et al., 2016) (Figure 1).
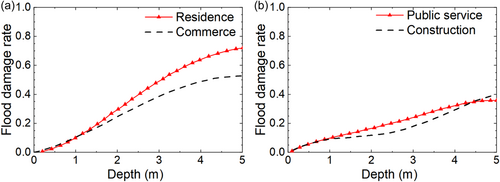
In this study, the depth-damage curve established by Ning et al. (2020) was used to assess the property loss rates of different industries. Ning et al. (2020) developed depth-damage rate curves for seven industry types in Hubei Province, China, including agriculture, industry, commerce, public service, resident property, and construction. These curves were obtained by fitting polynomial functions to the collected flood loss data sets. Based on the main industry types in the Gangxi drainage area, four industry types, namely residence, commerce, public service, and construction, were selected to evaluate the property losses owing to flooding. The depth-damage curves for different industry types are shown in Figure 2. Due to high asset values and vulnerability, residential and commercial buildings have higher flood loss rates at the same water depth among all industries. To facilitate understanding the flood loss degree under different rainfall return periods, buildings and underground spaces in the Gangxi drainage area are divided into five flood damage degrees using the Jenks natural breaks.
2.5.2 Damage assessment of underground spaces
Assessment of underground markets
Currently, investigations on the economic losses caused by flooding in urban underground spaces are limited. In particular lacking of formulas or curves that can calculate the rate of property loss in underground spaces (Forero-Ortiz, Martínez-Gomariz, & Cañas Porcuna, 2020). Therefore, in this study, we also adopted the depth-damage curve for commercial buildings to quantitatively calculate the flood damage rate in urban underground markets.
Assessment of underground parking
During urban flood disasters, underground parking is prone to flooding, resulting in significant property damage. In this study, the loss assessment standards used in the insurance industry are adopted, which classify the damage into five degrees based on the depth of flooding. The specific criteria for damage degree classification are shown in Table 1.
| Inundation depth (m) | Explanation | Damage degree |
|---|---|---|
| [0.14, 0.35) | Water level exceeds car carpet | 1 |
| [0.35, 0.50) | Water level reaches the seats | 2 |
| [0.50, 0.80) | Seats are submerged, lower than the dashboard | 3 |
| [0.80, 1.40) | The dashboard is submerged | 4 |
| [1.40, +∞) | Water level exceeds the roof of the car | 5 |
Assessment of metro stations
Metro stations are densely populated, and once a flood disaster occurs, it will inevitably cause serious casualties and economic losses. In the extreme urban flood disaster in Zhengzhou on July 20, 2021, the floodwater broke through the flood resistant wall of Metro Line 5. More than 500 passengers were trapped in the underground tunnel and 14 passengers died. Compared with other underground spaces in the city, subway stations are more vulnerable and require a more conservative vulnerability assessment method to evaluate the flood risk. The accumulated water depth is a key indicator for assessing the flood risk of subway stations. When the water depth exceeds the critical threshold, the subway service will be suspended and human safety will be threatened with the increasing inundation risk. Table 2 provides the classification criterion for the damage degree of subway stations to floods. Forero-Ortiz, Martínez-Gomariz, Cañas Porcuna, Locatelli, et al. (2020) analyzed the track structure of the metro and pointed out that the tracks will be completely submerged when the water depth exceeds 0.3 m. Therefore, in this study, the water depth inside the subway station is used as the basis of flood risk assessment. When the water depth exceeds 0.3 m, the subway service will be completely suspended, and the damage degree will reach its highest value.
| Inundation depth (m) | [0, 0.075) | [0.075, 0.15) | [0.15, 0.215) | [0.215, 0.30) | [0.30, +∞) |
|---|---|---|---|---|---|
| Damage degrees | 1 | 2 | 3 | 4 | 5 |
3 MATERIALS
3.1 Study area
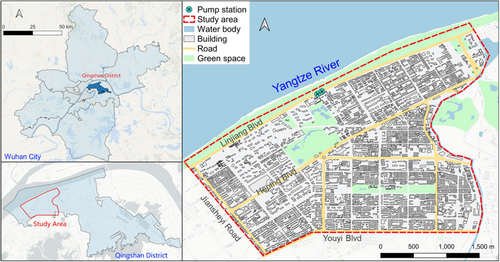
The location and general situation of the Gangxi drainage area are shown in Figure 3. The study area is located in the northwest of Qingshan district, adjacent to the Yangtze River in the north and the Qingshan Port in the east, with a total area of approximately 9.5 km2. Stormwater within the drainage area is captured by the sewer network and is then pumped to the Yangtze River through two pumping stations. The maximum drainage capacity of the two pumping stations is about 77.6 m3/s. A small amount of stormwater is directly discharged into the Nanmu River and the Wufeng River through pipelines.
3.2 Topography and land-use distribution
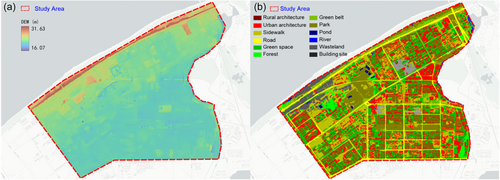
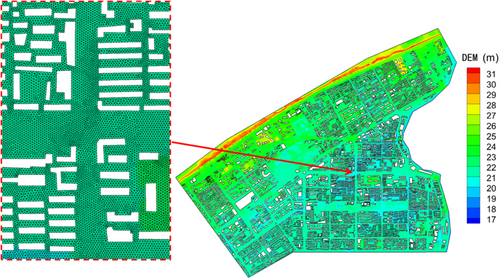
The topography and land-use distribution data of the Gangxi drainage area are shown in Figure 4. The topography data used in this study were obtained through the UAV 3D tilt photography with a spatial resolution of 1 m, which was measured in 2019. The topography of the whole study area shows the characteristic of being high on the north side and low on the middle and south sides, with a maximum elevation of 31.6 m and an average elevation of about 22.0 m. Based on the multispectral remote sensing imaging data from the UAV aerial surveys, the underlying surface of the Gangxi drainage area was divided into 12 land-use types. The land-use distribution of the study area is shown in Figure 4b. The Gangxi drainage area is highly urbanized, with impervious surfaces such as buildings, sidewalks, and roads accounting for 50.4% of the total study area, and permeable surfaces such as forests, parks, and green belts accounting for 47.1%, with the remaining area being water bodies such as ponds, lakes, and rivers.
3.3 Drainage system
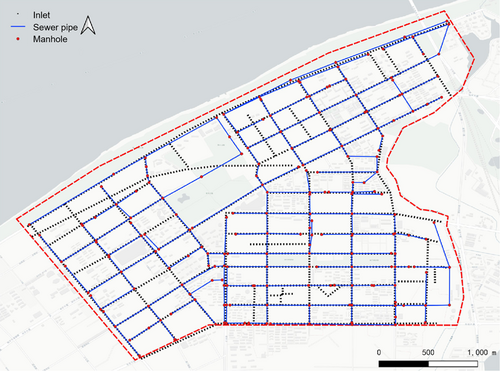
The drainage system data used in numerical modeling is sourced from the rainwater system diagram of the sponge city construction plan in the Qingshan Demonstration Zone of Wuhan City (2015–2030), the design drawing of drainage system in the Gangxi drainage area, and the design drawing of the Gangxi pump station. The layout of the drainage system is shown in Figure 5, which includes 204 main pipes and 203 manholes. Meanwhile, due to the difficulty in obtaining street inlet data through on-site surveys, this study assumes that all the rainwater inlets in the study area are the type of 16S518 with a plane size of 0.75 × 0.45 m. The entire study area contains 4510 street inlets, which are symmetrically distributed along both sides of the roads. The longitudinal spacing between contiguous street inlets along the road direction is set to 40 m.
3.4 Distribution of buildings and underground spaces
Building footprint data as well as the corresponding industry types in the study area was obtained from the Amap website and Amap poi (Point of Interest) data. These data were verified in GIS software by cross-validation with the remote sensing photographs. As shown in Figure 6a, buildings in the Gangxi drainage area can be classified into four types, namely residential, commercial, public services, and construction. There are significant differences in the spatial distribution characteristics of different types, with commercial and public service industries mainly distributed along roads, while residential buildings are often located in the center of street blocks. The buildings in the Gangxi drainage area are mainly for residential and commercial functions, accounting for 45% and 46%, respectively, while the proportion of buildings with public service attributes is 8.6%.
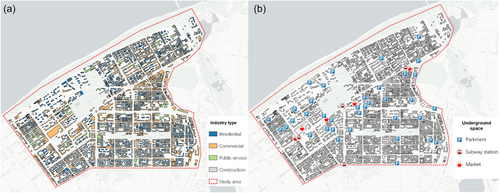
The distribution of urban underground spaces in the Gangxi drainage area is shown in Figure 6b. The main underground spaces in the study area are underground parking, subway stations, and underground markets. The number of underground parking is the highest, accounting for 80% of all the underground spaces. Since the Qingshang district is an old urban area, most residential parking is located on the ground surface. Underground parking is mainly located near newly built residential areas, commercial supermarkets, and public facilities along Heping Blvd. Three subway stations along Metro Line 5 and a subway station located on Metro Line 10. Based on on-site surveys, estimation through online map street view, telephone inquiries, and other methods, underground space characteristics were obtained to support the subsequent flood damage assessments, such as the area, depth, entrance width, water retaining structures, and drainage facility capacity.
3.5 Designed strom
3.6 Computational mesh
The generated computational mesh is shown in Figure 8. To better reflect the complex layout and micro-topography features of urban districts, the spatial resolution of the mesh in this study is 5 m, and the entire study area includes 569,194 nodes and 1,055,992 computational meshes. A total of 3014 buildings in the study area are represented using the BH method, which means that the buildings are generalized into void holes with solid wall boundary conditions to reflect the impact of buildings on urban floods (Lee et al., 2016; Schubert & Sanders, 2012).
To accurately represent the heterogeneity characteristics of urban underlying surfaces, it is crucial to select appropriate calculation parameters, such as Manning roughness and infiltration capacity, based on relevant literature and technical manuals. The key parameters of different land-use type and their corresponding values can be found in Table 3. Impermeable surfaces, such as buildings, hardened surfaces, and roads, are assigned a zero infiltration capacity. Water bodies are excluded from the infiltration process, assuming an infinite infiltration capacity. The underground sewer network is generalized into pipe sections and manholes, which serve as the fundamental calculation units. In this study, the pipe sections are discretized into several uniform calculation units, with each unit having a length of approximately 5 m. For explicit numerical schemes, the computational time step is determined by the Courant-Friedrichs-Lewy (CFL) condition, ensuring numerical stability. The model calculation process utilizes a dynamic time step, where the time step of each iteration is determined based on the CFL condition. To maintain stable and accurate calculations, the CFL number for this study is set to 0.4.
| Land-use type | Manning's roughness n | Maximum infiltration rate f0 (mm/h) | Stable infiltration rate fmin (mm/h) | Decay coefficient fk (1/h) |
|---|---|---|---|---|
| Buildings | 0.012 | 0 | 0 | / |
| Hardened surface | 0.014 | 0 | 0 | / |
| Road | 0.014 | 0 | 0 | / |
| Urban green land | 0.025 | 150 | 10 | 1 |
| Forest | 0.034 | 250 | 10 | 2 |
| Park | 0.035 | 200 | 10 | 1 |
| Road green belt | 0.025 | 150 | 10 | 1 |
| Waterbody | / | +∞ | +∞ | / |
| Wasteland | 0.02 | 76 | 5 | 1 |
| Scenario | 1 | 2 | 3 | 4 | 5 |
|---|---|---|---|---|---|
| Flood loss degree of residential | |||||
| 2-year | 99.49% | 0.44% | 0.07% | 0.00% | 0.00% |
| 5-year | 98.98% | 0.88% | 0.15% | 0.00% | 0.00% |
| 10-year | 98.25% | 1.53% | 0.15% | 0.07% | 0.00% |
| 50-year | 96.13% | 2.77% | 0.58% | 0.22% | 0.29% |
| 100-year | 94.53% | 4.01% | 0.73% | 0.29% | 0.44% |
| 200-year | 92.56% | 5.25% | 1.39% | 0.22% | 0.58% |
| Flood loss degree of commercial | |||||
| 2-year | 98.23% | 1.35% | 0.35% | 0.07% | 0.00% |
| 5-year | 96.46% | 2.62% | 0.64% | 0.21% | 0.07% |
| 10-year | 95.18% | 3.33% | 1.13% | 0.28% | 0.07% |
| 50-year | 89.44% | 6.45% | 2.76% | 1.06% | 0.28% |
| 100-year | 85.97% | 7.87% | 4.61% | 1.13% | 0.43% |
| 200-year | 82.92% | 8.15% | 6.80% | 1.56% | 0.57% |
| Flood loss degree of public service | |||||
| 2-year | 97.24% | 1.18% | 0.79% | 0.39% | 0.39% |
| 5-year | 94.49% | 1.57% | 2.76% | 0.79% | 0.39% |
| 10-year | 93.31% | 0.79% | 3.54% | 1.57% | 0.79% |
| 50-year | 84.25% | 3.94% | 7.09% | 1.97% | 2.76% |
| 100-year | 81.50% | 2.76% | 8.66% | 3.94% | 3.15% |
| 200-year | 78.74% | 2.76% | 7.48% | 7.09% | 3.94% |
| Flood loss degree of all industry type | |||||
| 2-year | 98.72% | 0.92% | 0.26% | 0.07% | 0.03% |
| 5-year | 97.43% | 1.74% | 0.59% | 0.16% | 0.07% |
| 10-year | 96.41% | 2.30% | 0.89% | 0.30% | 0.10% |
| 50-year | 92.03% | 4.58% | 2.14% | 0.76% | 0.49% |
| 100-year | 89.47% | 5.69% | 3.19% | 0.99% | 0.66% |
| 200-year | 86.93% | 6.39% | 4.41% | 1.42% | 0.86% |
4 RESULTS AND DISCUSSION
4.1 Model validation
Accurate field measurements play a crucial role in calibrating and validating urban flood models. However, due to characteristics such as their large sphere of influence, short duration, and difficulty in prediction, it can be challenging to gather enough data to support the model calibration and validation (Mignot et al., 2019). The Wuhan Water-affair Authority has collected data on waterlogging points and utilized big data technology to publish waterlogging risk maps for the central areas of the City (Figure 9a). To verify the accuracy of the established model, a simulation of the 5-year return period rainfall scenario was conducted, and the obtained inundation water distribution was compared with the waterlogging risk map.
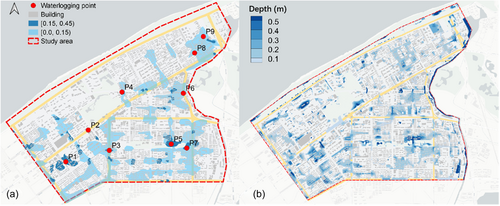
The simulated water depth distribution is shown in Figure 9b, and severe waterlogging points exist in Jilin Street, Jingzhou Street, Suizhou Street, and Yangang Road, with the maximum depth exceeding 0.4 m. The simulated water depth distribution is aligned closely with the 5-year waterlogging map of the Qingshan District. For a total of the nine typical waterlogging points, the simulated inundation depths are in good agreement with the official prediction values except for the waterlogging point P2. Consequently, the proposed model demonstrates a high level of calculation accuracy, which is capable of simulating urban flood processes in the Gangxi drainage area.
4.2 Flood inundation processes
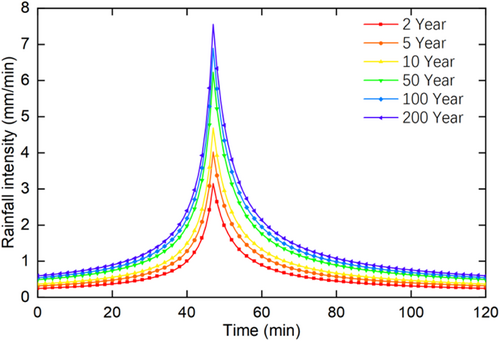
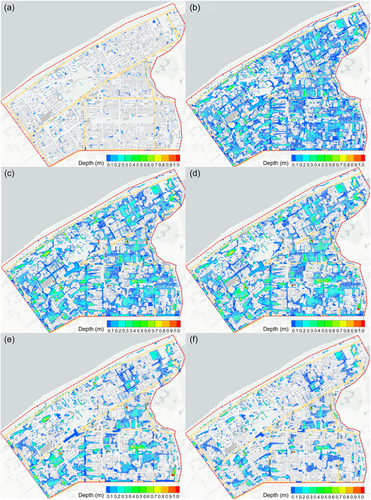
The temporal variation of inundation water depth distribution under the 100-year return period precipitation conditions is shown in Figure 10. During the initial period (t = 0–0.5 h), only a few locations in the study area experience the phenomenon of waterlogging when the rainfall intensity is relatively low and the soil's infiltration capacity is not yet saturated. The proportion of areas with inundation water depth exceeding 0.15 m at t = 0.5 h is only 0.3%. At t = 47 min, the rainfall intensity reaches its maximum value, which far exceeds the capacity of the underground drainage system. Consequently, waterlogging gradually intensifies in the study area due to the accumulation of surface water. Compared with the roads, the water depth inside the street block is relatively shallow. The areas of moderate waterlogging (0.15 m < h ≤ 0.4 m) and severe waterlogging (h > 0.4 m) account for 12.52% and 1.16% of the study area, respectively. During the period t = 1.0–1.5 h, the depth and extent of inundation water within the street blocks decrease as the rainfall intensity diminishes. However, the water depth on the roads increases during this period. After the rainfall stopped, the range and depth of inundation water significantly reduced in the majority of locations within the study area. At t = 3 h, the area of moderate and severe waterlogging accounts for 8.01% and 1.59% of the study area. The area of moderate waterlogging decreases by 36% as compared with the value at t = 1 h, while the proportion of severe waterlogging increases by 37%. The increase in the proportion of severe waterlogging reflects the phenomenon of water entering low-lying areas and exacerbates the severity of flooding. At t = 4 h, except for Gongye Avenue, Jingzhou Street, Suizhou Street, and their surrounding areas, the waterlogging in the entire Gangxi drainage area is nearly eliminated. The area of moderate waterlogging only accounts for 4.7% of the total surface.
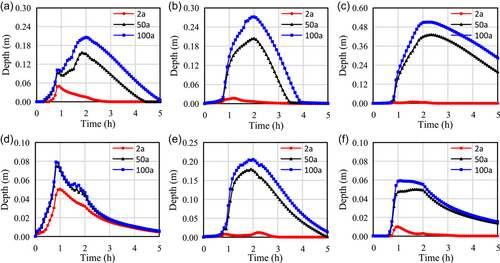
The temporal variation of inundation depth at some waterlogging points under different rainfall return periods is shown in Figure 11. The degree of waterlogging is much more severe under the 50-year and 100-year return period rainfall scenarios than under the 2-year return period condition. Taking the waterlogging point P3 as an example, the maximum inundation depth under the 100-year return period rainfall scenario reaches 0.27 m, while the surface inundation depth under the 2-year return period rainfall scenario is only 0.017 m. Most waterlogging points reach their maximum depths near t = 2 h, except for the waterlogging point P6, which reaches its maximum inundation depth during the period of high rainfall intensity due to the strong influence of the drainage system. Except for the waterlogging points P5 and P9, the inundation depth of other waterlogging points is zero at t = 5 h, indicating that the drainage system significantly reduces the degree of surface inundation. Additionally, rainfall intensity not only affects the depth of waterlogging at different sites but also alters the occurrence timing of the maximum inundation depth. The maximum waterlogging depth under the condition of high rainfall intensity is relatively delayed. For instance, at the waterlogging point P1, the time to reach the maximum waterlogging depth is 2 h 5 min and 1 h 49 min under the 100-year and 50-year return period scenarios, respectively.
4.3 Inundation of buildings and underground spaces
The spatial and temporal variations of inundation water depth within buildings under the 100-year return period scenario are presented in Figure 12. The location of the flooded buildings is closely related to the surface waterlogging distributions, but there is a certain delay in the temporal variations of the inundation water depth in the buildings compared with the variations in ground surface depth. The urban surface reaches its maximum extent of inundation at approximately t = 2 h, while the inundation degree of buildings in the study area reaches its peak at around t = 3 h. At t = 1 h, only 5.4% of the total number of houses would be inundated, and the percentage of flooded buildings and underground spaces increase to 17.9% at t = 2 h due to the severe inundation on the ground surface. The total volume of water accumulated in the buildings and underground spaces in the study area at that moment was 76,747 m3, which accounts for 5.5% of the total precipitation. Therefore, it is necessary to consider the inundation process inside the buildings and underground spaces when simulating urban flooding disasters. Conventional methods such as BH and BB do not consider the interaction between the buildings and the urban surface, potentially leading to an overestimation of inundation depth on streets and reducing the reliability of simulation results. During the period t = 2–4 h, the number of flooded buildings only slightly decreases due to the persistent inundation on the urban surface. The percentage of flooded houses decreases from 18.5% at t = 3 h to 16.9% at t = 4 h.
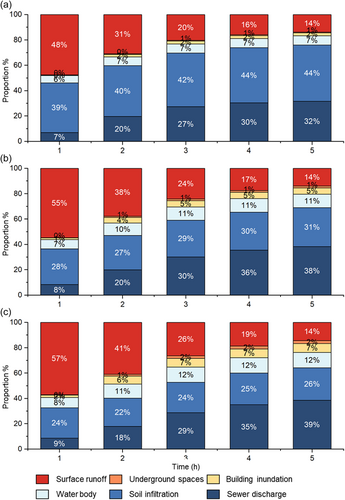
The proportions of water volume in different parts of the study area to the total rainfall under the scenarios of 5-year, 50-year, and 200-year return periods are shown in Figure 13. This study mainly considers the water volume on the urban ground surface, accumulated in buildings and underground spaces, soil infiltration, and discharged into the sewer network. Due to the relatively high proportion of permeable surfaces such as green spaces and forests in the Gangxi drainage area, infiltration accounts for a large proportion of the total water volume, with infiltration percentages of 44%, 31%, and 26% at t = 5 h for the three rainfall scenarios. Infiltration mainly occurs during the first 2 h, with the infiltration percentage at t = 2 h being 22% of the total rainfall under the 200-year return period, and with the percentage only increasing by 4% at t = 5 h. This phenomenon is mainly due to surface runoff flowing into lower-lying streets which are mostly impermeable surfaces, and the influence of soil infiltration on surface flooding processes is relatively small. With the increasing rainfall intensity, the proportion of water accumulation inside buildings increases rapidly. Under the 200-year return period, water accumulation inside buildings accounts for 7% of the total precipitation volume, while under the 2-year return period, it only accounts for 2%. Additionally, due to the limited number of submerged underground spaces, the water volume in underground spaces is only about 1% under rainfall scenarios with return periods less than 50 years.
4.4 Effect of rainfall intensity on flood damages
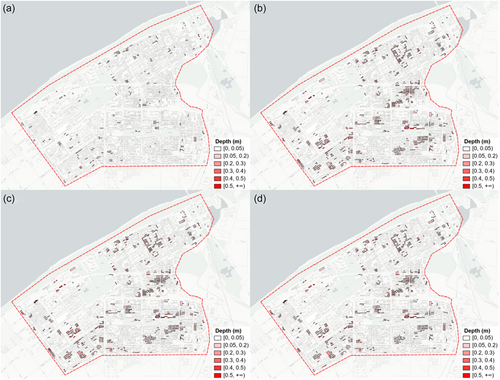
Based on the high-resolution hydrodynamic modeling results, the distributions of flood damage rates for ground buildings and underground spaces under different rainfall return period scenarios are given in Figure 14. It is obvious that the degree of flood damage is closely related to the distribution of surface inundation depth. Due to the relatively high standard of the drainage system in the Gangxi drainage area, the flood loss rates of surface buildings and underground spaces in the study area are relatively low when the precipitation intensity is lower than the 50-year return period scenario. Only 7.97% of the buildings have a flood damage degree greater than 1 under the 50-year rainfall return period scenario. The proportion of flood damage degrees for different industry types is presented in Table 3 under different storm return periods.
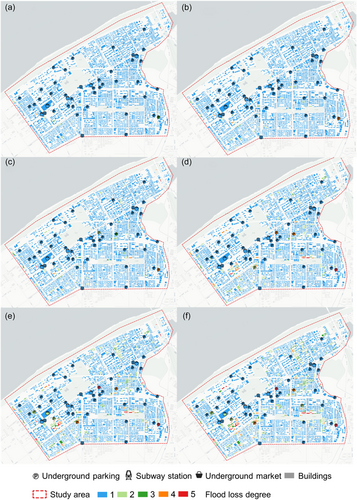
As Table 4 shows, the public services buildings have a higher flood loss degree than the average of all industries, with 7.09% and 3.94% of the public services having flood loss degrees of 4 and 5 under the 200-year return period scenario, compared with 1.42% and 0.86% for the average of all industries. The significantly higher flood damage degree of public services such as schools, hospitals, and police stations may be related to their locations. To facilitate public access to relevant public services, public service buildings are generally located on both sides of the street, and the low topography and relatively flat nature make the street become a path and ponding area during heavy rainfall and flooding. Therefore, buildings located on both sides of the street are more prone to flooding, resulting in more serious flood damage.
Once a disaster occurs in the urban underground space, it will cause a huge loss of life and property, so the entrances and exits of an underground space are generally constructed in a higher position, and generally have more sound flood prevention facilities. The damage degree of urban underground spaces to flooding in the study area is relatively low, even under the extreme precipitation scenario of a 200-year return period, and the proportion of damage degree greater than 3 is only 8.6%. Only a small number of underground parking and underground markets located on both sides of Youyi Avenue and Industry Road have high flood damage degrees. Contrary to other underground spaces, the flood risk of the metro stations in the Gangxi drainage area is extremely low with the four metro stations having a damage degree of 1 under all the flood scenarios.
5 CONCLUSIONS
- 1.
A novel fine-scale urban flood damage assessment method was proposed based on 1D/2D coupled urban flood hydrodynamic modeling. Based on the proposed damage assessment method, the inundation processes of urban surface buildings and underground spaces can be accurately simulated, and the flood damage degrees can be reasonably evaluated based on the physical characteristics of the flood-affected objects.
- 2.
Taking the 2-h rainfall scenario with a 100-year return period as an example, the spatial-temporal variation characteristics of surface depth and building inundation depth were analyzed. The amount of accumulated water in buildings and underground spaces accounts for 5.5% of the total rainfall volume during the flood process. Therefore, the inundation process of ground buildings and underground spaces should be taken into consideration.
- 3.
The flood damage degrees of ground buildings and underground spaces with different industry types in the Gangxi drainage area were evaluated. The damage degrees of public service buildings are more sensitive to rainfall intensity than other building types. The proportion of public service buildings with an extremely high damage degree (greater than 4) would increase from 1.2% under the 5-year rainfall scenario to 11.03% under the 200-year rainfall scenario.
ACKNOWLEDGMENTS
This work was supported by the National Natural Science Foundation of China (41890820; 51725902; 52209098), the Special Fund for Science and Technology Innovation Strategy of Guangdong Province (gdsky2023-02), the Newton Advanced Fellowships from the NSFC and the UK Royal Society (52061130219; NAF\R1\201156), and the Science and Technology Innovation Program from Water Resources of Guangdong Province (2022-01; 2023-05).
ETHICS STATEMENT
None declared.
Open Research
DATA AVAILABILITY STATEMENT
The data are available from the corresponding author on reasonable request.


