Research on the adsorption rule of porous media on supersaturated total dissolved gas
Abstract
Discharge of high dams may result in supersaturated total dissolved gas (TDG) in water, which could cause fish that live downstream river to suffer from gas bubble disease. If supersaturated TDG water was taken as a water source for breeding and proliferation stations, farmed fish was confined and may face more severe problems than fish living in the river. Therefore, it is critical to develop strategies to reduce the negative effects of supersaturated TDG. In this research, the adsorption effect of porous media on supersaturated TDG was explored, including biofilter adsorption experiments and previously existing activated carbon adsorption experiments. The experimental results showed that adding porous media to the water effectively accelerated the dissipation of supersaturated TDG, and the adsorption effect was associated with the specific surface area, mass density, and initial TDG saturation. To quantitively evaluate the adsorption effects of the porous media, the porous adsorption coefficient was proposed to express the adsorption rate of porous media on supersaturated TDG. The porous adsorption coefficient was related to the initial TDG saturation and the specific surface area of the porous media. The porous adsorption coefficient increased with increasing the specific surface area and decreasing initial TDG saturation. Based on this, an equation related to the specific surface area, initial TDG saturation, and the porous adsorption coefficient was developed. This equation may be used to evaluate the adsorption effect of porous media on supersaturated TDG. This study could serve as a crucial resource in reducing the adverse impacts of supersaturated TDG.
1 INTRODUCTION
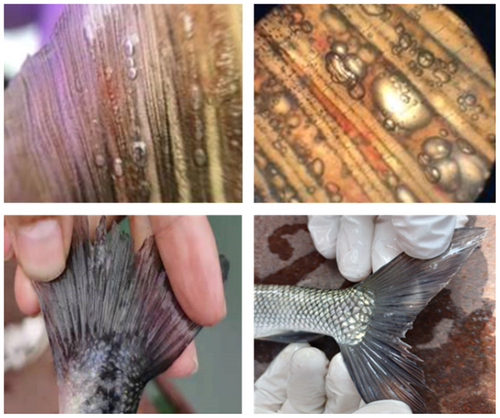
In recent decades, many high dams have been built to provide economic services to human society (Huang et al., 2019; Sahle et al., 2019). However, the environmental problems brought by the dams are becoming increasingly evident, and they are receiving much attention (Schulz & Adams, 2019). Large amounts of air are entrained in the jet during dam discharge and poured into the plunge pool. Due to the high pressure under the deep plunge pool, excessive gas was dissolved in water, causing the total dissolved gas (TDG) supersaturation (AlOmar et al., 2020; Lu et al., 2019; Weitkamp & Katz, 1980). It takes a long time for supersaturated TDG to dissipate into the air, and water with supersaturated TDG water can be transported hundreds of kilometers downstream (Feng et al., 2014). Fish that live in supersaturated TDG water for a long time will suffer from gas bubble disease (GBD) (Johnson et al., 2005; Pleizier et al., 2021; Xue et al., 2019), as shown in Figure 1. In particular, riverside breeding and proliferation stations often use downstream river water as aquaculture water, which causes more serious problems for farmed fish because they are unable to evade supersaturated TDG actively. Therefore, it is necessary to develop measures to mitigate the adverse effects of supersaturated TDG on aquatic living.
In previous research, two main methods have been proposed by scholars to accelerate the dissipation of supersaturated TDG. One method involves changing the external environment that affects the dissipation rate, including increasing the water turbulence (Li et al., 2013), reducing the water depth (Feng et al., 2014), increasing the water temperature (Shen et al., 2014), aerating the water (Ou et al., 2016) and increasing the wind speed above the water surface (Huang et al., 2016). However, these methods are difficult to be applied due to low operability, high energy consumption, and other reasons. Another method involves utilizing the adsorption effects of solid media in supersaturated TDG water. The utilized solid media include porous media such as sediments (Feng et al., 2012) and activated carbon (AC) (Niu et al., 2015; Yuan et al., 2022), and solid walls such as sandpapers (Yuan et al., 2020) and artificial vegetation (Wang et al., 2019; Yuan et al., 2018). In these studies, Niu et al. (2015) first discovered that AC encouraged the dissipation of supersaturated TDG. In continuing the research of Niu et al. (2015), Yuan et al. (2022) analyzed the effect of AC to alleviate the adverse effects of supersaturated TDG on fish, and the AC types and mass density were considered. Yuan et al. (2020) proposed an adsorption coefficient to represent the adsorption rate of solid walls on supersaturated TDG and revealed the relationship between the adsorption coefficient and surface properties. Due to the differences between the solid walls and porous media, the adsorption effect of porous media on supersaturated TDG was different from the adsorption by the solid walls and required additional exploration.
Dissolved gas in water was adsorbed by porous media mainly followed the law of physical adsorption. The gas molecules and the surface of the porous medium gather at the nucleation centers or the intersection of the solid wall through gravitational interaction and then exist in the form of bubbles at the wall-water interface (Parker et al., 1994). Porous media can be used to treat aquatic water (Delgado et al., 2019; Shim et al., 2012), adsorb CO in power plants (Siegelman et al., 2021), and adsorb volatile organic compounds (Zhu et al., 2020). To reveal the adsorption effect of porous media on supersaturated TDG, the biofilters were used in the adsorption experiment of this study. Additionally, the datasets for the AC adsorption experiments (Yuan et al., 2022) were used to comprehensively analyse the factors influencing the porous media adsorption on supersaturated TDG. The porous adsorption coefficient was proposed to characterize the adsorption rate of porous media on supersaturated TDG water. A formula for predicting the porous adsorption coefficient was established. These results may provide a theoretical foundation and technological backing for reducing the negative impacts of supersaturated TDG.
2 BIOFILTER ADSORPTION EXPERIMENT
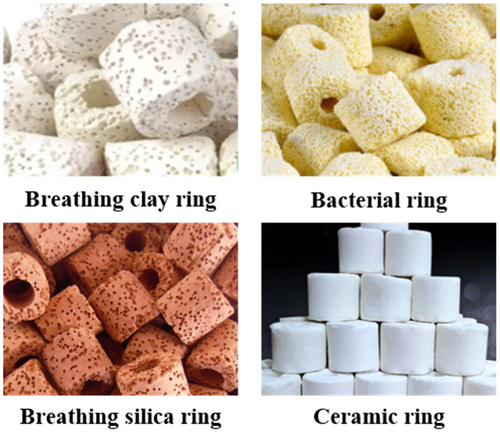
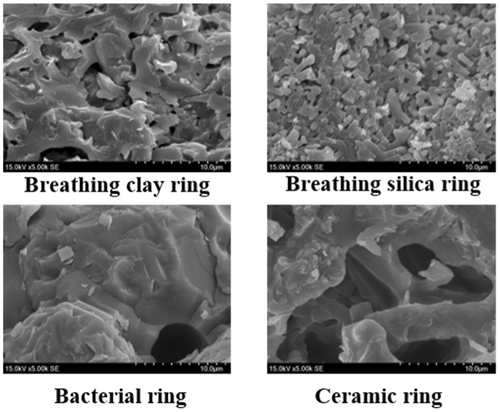
Experiments were conducted in the Sichuan University State Key Laboratory of Hydraulics and Mountain River Engineering (SKLH). The device was made up of several rectangular 0.2 m3 plexiglass tanks (1.0 m in length, 0.5 m in width, and 0.4 m in height). The supersaturated TDG water used in this experiment was prepared with a supersaturated TDG water-generating system developed at Sichuan University (Li et al., 2012). Four types of biofilters (shown in Figure 2) were chosen as the experimental materials, including breathing clay rings, breathing silica rings, bacterial rings, and ceramic rings. Biofilters were characterized with a Rise-1010 fully automatic specific surface area and porosity analyser (Beijing Shangdetong Technology Co., Ltd.). The apparent morphology of biofilters was analyzed by the JSM-7500F SEM (JEOL Electronics Co., Ltd.), as shown in Figure 3.
The plexiglass tank was initially filled with 150 L supersaturated TDG water. The initial TDG saturation was measured and obtained with a Point Four TGP detector (Pentair Company), which has a TDG saturation accuracy of 2% and a measuring range of 0%–200%. The Point Four TGP detector can also measure the water temperature with an accuracy of 0.1°C and a measuring range of 0°C–40°C. Then, the biofilters were put into the water. The initial TDG saturation level was set at 154%. The TDG probe was submerged under the water surface and shaken until the readings keep stable. The TDG saturation and water temperature were measured. Then, the TDG saturation level and water temperature were measured again after a certain period. The variations in TDG saturation level and water temperature over time were measured and recorded. Four biofilters (breathing clay ring, breathing silica ring, bacterial ring, and ceramic ring) and three masses (1.5, 3.0, and 4.5 kg) were set in the experiments. All experimental cases are listed in Table 1, where the mass density represents the quality of biofilter per unit of water.
| Case No. | Material type | Specific surface area (m2 g−1) | Mass (kg) | Mass density (kg m−3) | Initial saturation (%) | Water temperature (°C) |
|---|---|---|---|---|---|---|
| B1 | Control test | / | 0 | 0 | 154 | 10.0 |
| B2 | Breathing clay ring | 13.63 | 4.5 | 30 | 154 | 10.5 |
| B3 | Breathing silica ring | 14.14 | 4.5 | 30 | 154 | 10.6 |
| B4 | Bacterial ring | 8.34 | 4.5 | 30 | 154 | 10.6 |
| B5 | Ceramic ring | 10.62 | 4.5 | 30 | 154 | 10.3 |
| B6 | Ceramic ring | 10.62 | 3.0 | 20 | 154 | 10.3 |
| B7 | Ceramic ring | 10.62 | 1.5 | 10 | 154 | 10.3 |
3 RESULTS AND DISCUSSION
3.1 Experiment results for supersaturated TDG dissipation
The TDG saturation dissipation processes occurring over time in the biofilter adsorption experiments are shown in Figure 4. As expected, TDG saturation gradually decreased over time. The supersaturated TDG was dissipated faster with biofilters than without the biofilter. It was discovered that the different biofilters produced different promotion effects on the supersaturated TDG dissipation process. The rates for dissipation of the supersaturated TDG decreased in the order of breathing silica ring, breathing clay ring, ceramic ring, bacterial ring, and control test. In addition, it was shown that the dissipation rate was proportional to the mass density of the added biofilter, as shown in Figure 4b.
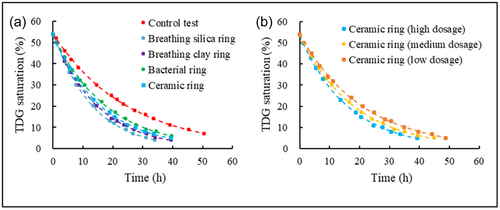
The dissipation coefficients were determined for all cases in the biofilter adsorption experiments, as summarized in Table 2. The dissipation coefficients were related to the specific surface area and mass density of the biofilter. The dissipation coefficients increased with increasing the specific surface area and mass density.
| Case No. | Material type | Mass density (kg m−3) | Initial TDG saturation (%) | Specific surface area (m2 g−1) | Dissipation coefficient K (h−1) |
|---|---|---|---|---|---|
| B1 | / | 0 | 154 | / | 0.0401 |
| B2 | Breathing clay ring | 30 | 154 | 13.63 | 0.0668 |
| B3 | Breathing silica ring | 30 | 154 | 14.14 | 0.0761 |
| B4 | Bacterial ring | 30 | 154 | 8.34 | 0.0560 |
| B5 | Ceramic ring | 30 | 154 | 10.62 | 0.0612 |
| B6 | Ceramic ring | 20 | 154 | 10.62 | 0.0545 |
| B7 | Ceramic ring | 10 | 154 | 10.62 | 0.0477 |
- Abbreviation: TDG, total dissolved gas.
3.2 Activated carbon adsorption experiment data
In this section, the adsorption effects of porous media on supersaturated TDG were analyzed, and the results were combined with the AC adsorption data reported by Yuan et al. (2022).
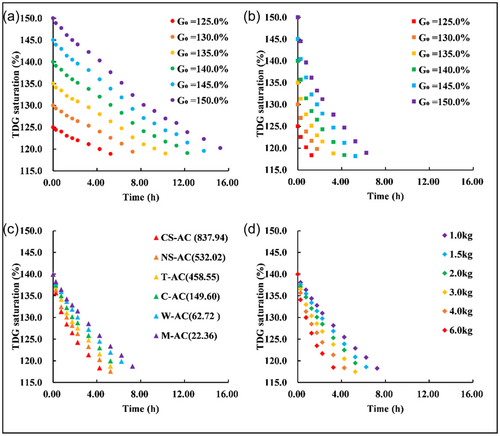
Yuan et al. (2022) proposed the use of AC to alleviate the adverse effects of supersaturated TDG on fish. The same experimental device was used in their experiment. Six AC types (coconut shell-based AC, nut shell-based AC, tar-based AC, coal-based AC, wood-based AC, and mixed AC), six initial TDG saturation levels (125%, 130%, 135%, 140%, 145%, and 150%), and six AC masses (1.0, 1.5, 2.0, 3.0, 4.0, and 6.0 kg) were used. The experimental cases for the AC adsorption experiments are listed in Table 3, and the dissipation process for the supersaturated TDG is depicted in Figure 5.
| Case No. | Material type | Material abbreviation | Specific surface area (m2 g−1) | Mass (kg) | Mass density (kg m−3) | Initial saturation (%) |
|---|---|---|---|---|---|---|
| A1 | Control test 1 | / | / | / | / | 125 |
| A2 | Control test 2 | / | / | / | / | 130 |
| A3 | Control test 3 | / | / | / | / | 135 |
| A4 | Control test 4 | / | / | / | / | 140 |
| A5 | Control test 5 | / | / | / | / | 145 |
| A6 | Control test 6 | / | / | / | / | 150 |
| A7 | Coconut shell-based AC | CS-AC | 837.94 | 4.0 | 26.7 | 140 |
| A8 | Nut shell-based AC | NS-AC | 532.02 | 4.0 | 26.7 | 140 |
| A9 | Tar-based AC | T-AC | 458.55 | 4.0 | 26.7 | 140 |
| A10 | Coal-based AC | C-AC | 149.6 | 4.0 | 26.7 | 140 |
| A11 | Wood-based AC | W-AC | 62.72 | 4.0 | 26.7 | 140 |
| A12 | Mixed AC | M-AC | 22.36 | 4.0 | 26.7 | 140 |
| A13 | Coconut shell-based AC | CS-AC | 837.94 | 1.0 | 6.7 | 140 |
| A14 | Coconut shell-based AC | CS-AC | 837.94 | 1.5 | 10.0 | 140 |
| A15 | Coconut shell-based AC | CS-AC | 837.94 | 2.0 | 13.3 | 140 |
| A16 | Coconut shell-based AC | CS-AC | 837.94 | 3.0 | 20.0 | 140 |
| A17 | Coconut shell-based AC | CS-AC | 837.94 | 6.0 | 40.0 | 140 |
| A18 | Coconut shell-based AC | CS-AC | 837.94 | 4.0 | 26.7 | 125 |
| A19 | Coconut shell-based AC | CS-AC | 837.94 | 4.0 | 26.7 | 130 |
| A20 | Coconut shell-based AC | CS-AC | 837.94 | 4.0 | 26.7 | 135 |
| A21 | Coconut shell-based AC | CS-AC | 837.94 | 4.0 | 26.7 | 145 |
| A22 | Coconut shell-based AC | CS-AC | 837.94 | 4.0 | 26.7 | 150 |
- Abbreviations: AC, activated carbon; TDG, total dissolved gas.
3.3 Calculation of the porous adsorption coefficient
Generally, supersaturated TDG in water is dissipated primarily through three mechanisms: air–liquid surface mass transfer, inner dissipation, and solid media adsorption. Under the same conditions, by subtracting the dissipation of supersaturated TDG observed in the case without solid media addition from that in the case with solid media addition, the dissipation of supersaturated TDG caused only by solid media adsorption was obtained (Lin et al., 2021; Yuan et al., 2020). Thus, the amount of supersaturated TDG dissipated only by the biofilter and AC adsorption can be determined.
The porous adsorption coefficients of the biofilter and the AC adsorption experiments were calculated using Equation (6). Temperature corrections were used to remove the impact of temperature differences between AC adsorption experiment and the biofilter adsorption experiment. Shen et al. (2014) found that as the water temperature increased, the dissipation process of supersaturated TDG was accelerated. The increase in water temperature could accelerate the diffusion and energy dissipation processes of molecules, thereby promoting the release of TDG.
| Case No. | Media type | Mass density (kg m−3) | Initial TDG saturation (%) | Specific surface area (m2 g−1) | Porous adsorption coefficient Kp (kg−1 m−3 h−1) |
|---|---|---|---|---|---|
| B2 | Breathing clay ring | 30 | 154 | 13.63 | 0.0015 |
| B3 | Breathing silica ring | 30 | 154 | 14.14 | 0.0020 |
| B4 | Bacterial ring | 30 | 154 | 8.34 | 0.0008 |
| B5 | Ceramic ring | 30 | 154 | 10.62 | 0.0012 |
| B6 | Ceramic ring | 20 | 154 | 10.62 | 0.0012 |
| B7 | Ceramic ring | 10 | 154 | 10.62 | 0.0012 |
| A7 | CS-AC | 26.7 | 140 | 837.94 | 0.0053 |
| A8 | NS-AC | 26.7 | 140 | 532.02 | 0.0038 |
| A9 | T-AC | 26.7 | 140 | 458.55 | 0.0032 |
| A10 | C-AC | 26.7 | 140 | 149.60 | 0.0027 |
| A11 | W-AC | 26.7 | 140 | 62.72 | 0.0019 |
| A12 | M-AC | 26.7 | 140 | 22.36 | 0.0015 |
| A13 | CS-AC | 6.7 | 140 | 837.94 | 0.0070 |
| A14 | CS-AC | 10.0 | 140 | 837.94 | 0.0063 |
| A15 | CS-AC | 13.3 | 140 | 837.94 | 0.0061 |
| A16 | CS-AC | 20.0 | 140 | 837.94 | 0.0052 |
| A17 | CS-AC | 40.0 | 140 | 837.94 | 0.0052 |
| A18 | CS-AC | 26.7 | 125 | 837.94 | 0.0078 |
| A19 | CS-AC | 26.7 | 130 | 837.94 | 0.0066 |
| A20 | CS-AC | 26.7 | 135 | 837.94 | 0.0060 |
| A21 | CS-AC | 26.7 | 145 | 837.94 | 0.0047 |
| A22 | CS-AC | 26.7 | 150 | 837.94 | 0.0041 |
- Abbreviations: AC, activated carbon; CS, Coconut shell; TDG, total dissolved gas.
3.4 Analysis of the porous adsorption coefficient
The porous adsorption coefficients of different porous media were first analyzed. In the same mass density of the biofilters group, the largest porous adsorption coefficient of supersaturated TDG was the breathing silica ring with porous adsorption coefficient of 0.0020 kg−1 m−3 h−1; the bacterial ring with the lowest porous adsorption coefficient of supersaturated TDG was 0.0008 kg−1 m−3 h−1. In the same mass density of the AC group, the largest porous adsorption coefficient of supersaturated TDG was the CS-AC, whose porous adsorption coefficient was 0.0053 kg−1 m−3 h−1; the M-AC with the lowest porous adsorption coefficient of supersaturated TDG was 0.0015 kg−1 m−3 h−1. It seems that different porous media had different porous adsorption coefficient. In our view, it is because different porous media had different porous structure. Porous structure provides large surface area and readily adsorbed dissolved gas. So, porous medium with richest porous structure owes largest surface area, and then will absorbs more dissolved gas. As shown in Figure 3, it can be seen that the breathing silica ring has the richest porous structure and the largest specific surface area (14.14 m2 g−1). In biofilter group, the case with adding breathing silica ring has the largest porous adsorption coefficient. As for AC, it can be seen that in Table 4, all the specific surface areas of all ACs were larger than all biofilters. So, the porous adsorption coefficients in the AC group are larger than those in the biofilter groups.
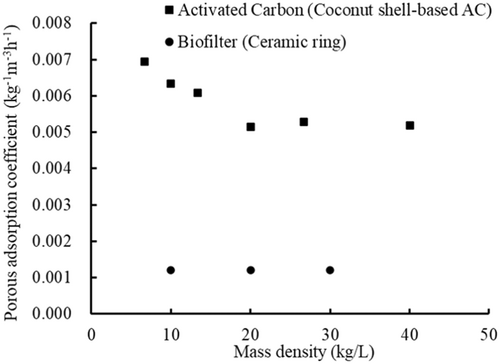
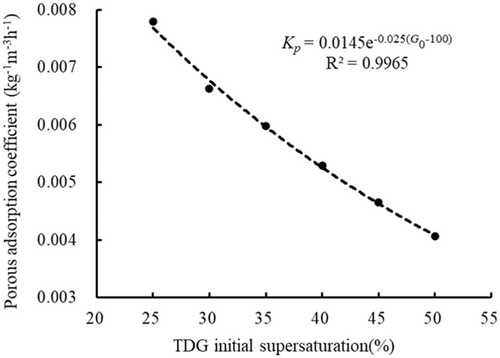
The porous adsorption coefficients of cases with different mass density of ceramic ring (Cases B5, B6, and B7) were compared. It could be found that the porous adsorption coefficients were almost same in each case. indicating that the porous adsorption coefficient was weakly related with mass density. While, for different mass density of CS-AC (Cases A7 and A13–A17), the porous adsorption coefficient first increased and then stabilized with increasing mass density. Additionally, from Table 4, it seems that under different initial TDG saturation conditions, cases with same mass density of CS-AC (Cases A7 and A18–A22) had different porous adsorption coefficient.
3.4.1 Analysis about the relation between porous adsorption coefficient and mass density
The relationships between the porous adsorption coefficients and the mass density are shown in Figure 6. Here, Coconut shell-based AC (Cases A7 and A13–A17) cases and Ceramic ring (Cases B5, B6, and B7) were taken as example. In general, with increasing mass density of the porous media, the porous adsorption coefficient tended to first decrease and then remained stable. When the mass density of the porous media reached a certain value (Cases B5, B6, B7, A7, A16, and A17), the porous adsorption coefficients were almost stable. The reason why the porous adsorption coefficient reached a stable value may be that when the mass density increased to a certain value, the adsorption effect was limited by aggregation of the porous media. It can also be seen from Figure 6 that the porous adsorption coefficient for the AC seemed to be higher than that of the porous media. This is probably related to the larger specific surface area of AC.
3.4.2 Analysis about the relation between porous adsorption coefficient and initial TDG saturation
In the cases in which the same mass densities and type of porous media were added (case A7 and cases A18–A22), the porous adsorption coefficients differed for different initial saturations. The porous adsorption coefficients were 0.0078, 0.0066, 0.0060, 0.0053, 0.0047 and 0.0041 kg−1 m−3 h−1 in the case of initial saturation values were 125%, 130%, 135%, 140%, 145%, and 150%, respectively. The porous adsorption coefficient decreased with increasing initial TDG saturation.
3.4.3 Analysis about the relation between porous adsorption coefficient and specific surface area
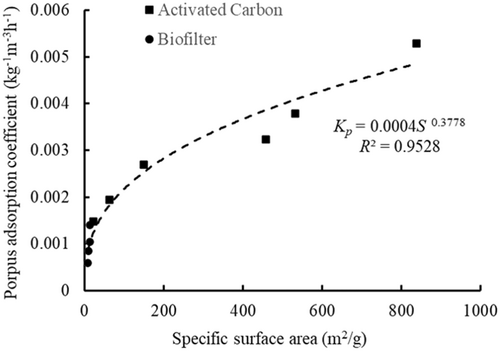
3.5 Prediction of the porous adsorption coefficient
Some data from the AC adsorption experiments and biofilter adsorption experiments (Cases B2, B4, B6, A7, A9, A11, A13, A15, A17, A19, and A21) in Table 4 were employed to fit the above expression, and the resulting values of , , and were 0.001, −0.01, and 0.3, respectively.
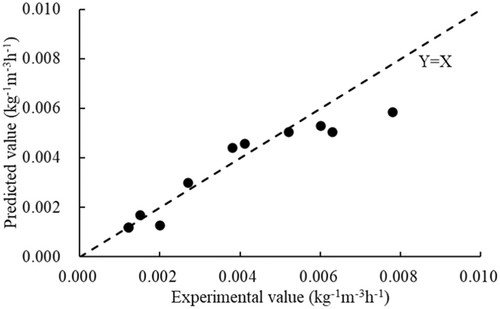
Equation (10) was used to calculate the porous adsorption coefficients for the rest of the cases (Cases B3, B5, B7, A8, A10, A12, A14, A16, A18, A20, and A22) in Table 4. The porous adsorption coefficients calculated by Equation (10) were compared with the porous adsorption coefficients determined experimentally, as shown in Figure 9. The correlation coefficient (R2) was reached as 0.87, which indicated a high goodness of fit between Equation (10) and experiment data. So, in our view, Equation (10) can be used to predict the porous adsorption coefficient when given the initial TDG saturation level and the type of porous media.
4 CONCLUSIONS
In this study, the biofilter adsorption experiment was carried out, together with the analysis of data from previous activated carbon adsorption experiments, and the adsorption effect of porous media on supersaturated TDG was examined. It was found that the supersaturated TDG dissipation process can be affected by the mass density, the specific surface area, and initial TDG saturation. The supersaturated dissipation rate increased with the increase of mass density and specific surface area of porous media while decreasing with the increase of initial TDG saturation. A parameter, porous adsorption coefficient, which can be used to quantitatively describe the adsorption rate of porous media on supersaturated TDG, was proposed. It was found that the porous adsorption coefficient was mainly related to the specific area of porous media and the initial TDG saturation. At the same time, the porous adsorption coefficient will remain stable when the mass density of porous media reaches a certain level (e.g., the mass density of activated carbon is 20 kg m−3). The prediction equation of the porous adsorption coefficient was established, and the error analysis demonstrated that the equation was applicable. The research in this paper could develop a technique for reducing the negative effects of supersaturated TDG water in practical applications. The practical application of the adsorption effect of porous media in reservoir aquaculture should be further investigated in subsequent studies.
ACKNOWLEDGMENTS
We would like to thank the National Natural Science Foundation of China for providing financial support (52322905, 52279073) to the third author and the National Natural Science Foundation of China for providing financial support (52039006) to the sixth author.
ETHICS STATEMENT
None declared.
Open Research
DATA AVAILABILITY STATEMENT
The data that support the findings of this study are available from the corresponding author upon reasonable request. Data will be made available on request.


