Two-dimensional morphological model for prediction of erosion of a reach of Brahmaputra River using MIKE 21C software with hydrodynamics and river morphology modules
Abstract
Understanding the morphological dynamics in highly braided rivers, like the Brahmaputra, is crucial for effective river management. To gain this understanding, data is essential for mathematical modeling, enabling short and medium-term predictions of morphological changes. Our study focused on the Palasbari-Gumi stretch of the Brahmaputra River, utilizing a two-dimensional morphological model (MIKE-21C). Our objectives were to predict erosion patterns, plan protective measures, and anticipate morphological changes. Author conducted multiple models runs under various hydrological scenarios. For coarse sand, the model projected an annual sediment load of 257 Mt/year in 2021, with a bankfull discharge of 314 Mt/year. Historical records noted 400 Mt/year sediment load in the Brahmaputra. Importantly, our model's predictions closely matched empirical data, especially regarding ADCP velocities, design flood levels, and annual sediment load. Peak model velocities deviated by less than 9% from ADCP measurements, predominantly within acceptable limits. Predicted flood levels for bankfull discharge conditions achieved nearly 96% accuracy at the Gumi site. This study highlights the role of predictive modeling in guiding river training measures, especially in dynamic braided river systems like the Brahmaputra, over a two-3 year horizon.
1 INTRODUCTION
The recurring floods and embankment breaches along the Brahmaputra River stem from its high morphological activity, driven by substantial upstream discharges and sediment loads during the monsoon season (Pareta, 2022). The composition of the riverbanks and adjacent agricultural land further exacerbates the issue, as these materials become more susceptible to erosion and bank collapse in the wet season, leading to the seasonal erosion of floodplains, agricultural land, and settlements (Chakraborty & Saha, 2022). Given the prevalent poverty in Assam, the loss of crucial agricultural land and property intensifies economic hardship (Das et al., 2009). However, effective flood and erosion management has the potential to alleviate poverty. It's imperative to establish a comprehensive understanding of the hydrological and geomorphic behavior of the catchment as a foundational step for flood and erosion management planning (CEGIS, 2010). This necessitates the collection, analysis, and organization of diverse hydrological and physio-geographic data sources (Thakur et al., 2017).
The Brahmaputra River exhibits a distinctive highly braided channel pattern, characterized by the formation of river bars or “chars” with diverse shapes and sizes (Best et al., 2007). These bars are remarkably unstable, undergoing frequent seasonal and annual changes in their shape, size, and position (Bristow, 1987). Bedforms, both large-scale such as bars and islands, and micro-scale like ripples and dunes, significantly affect flow resistance and bed shear stress, indirectly influencing flood and erosion dynamics (Blench, 1969). These bedforms alter water levels and shear velocities, impacting occurrences of floods and erosion along the river. Regular monitoring of the braids and bars' development is vital for understanding river characteristics and providing data for various analyses, including mathematical modeling (Iwasaki et al., 2016; Kasvi et al., 2017; Mosselman, 2004). The evolution of bar position, dimensions, and morphology can be tracked through a combination of annual or bi-annual river surveys and multitemporal satellite imagery analysis (Pareta, 2021).
Understanding the morphological dynamics of a braided river like the Brahmaputra requires comprehensive vertical and horizontal data collection (Sarker & Thorne, 2006). Landsat satellite data offers the means to monitor horizontal changes in river planform over time, providing insights into overall river dynamics and hotspots. Google earth engine (GEE) has simplified the utilization of such data by leveraging long-term, multispectral, and multispatial Landsat data (Gomes et al., 2020; Gorelick et al., 2017; Pickens et al., 2020). Cloud-based platforms further simplify data download and geoprocessing, especially for extensive river systems like the Brahmaputra (Ghosh et al., 2022). Analyzing long-term planform development can also be conducted in GIS systems like ArcGIS or QGIS (Pareta, 2020). Vertical changes in the Brahmaputra River are monitored through cross-sectional surveys, employing techniques such as acoustic doppler current profiling (ADCP) for submerged sections and conventional surveys for dry areas. Additionally, data on discharge, sediment load, and grain size distribution of bed and bank material are crucial.
These diverse datasets can be integrated into mathematical modeling tools like MIKE 21C, CCHE2D, Delft2D-Rivers and so forth. to predict morphological behaviors in the short and medium term (Sarma & Acharjee, 2018). Mathematical modeling complements morphological data analysis by addressing information gaps in time and space and facilitates the study of various scenarios, aiding in the planning of river protection works (Indian Institute of Technology IIT, 2009). In complex river systems, it's essential to recognize that engineering projects are part of a broader geomorphic system. Smaller-scale projects focus on local scour, while larger ones assess long-term morphological evolution and immediate-medium term developments near the project site (Zhang et al., 2018). The objectives of study are predicted short to medium-term bank erosion for river training planning; analyze hydraulic and morphological changes in the erosion affected Palasbari and Gumi reach; assess the impact of current river training works upstream and downstream.
2 STUDY AREA
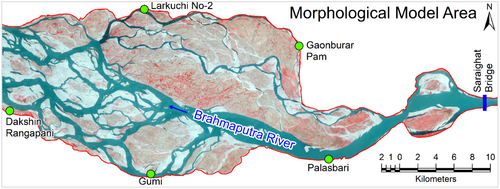
The Palasbari-Gumi reach of the Brahmaputra River spans from latitude 26°05′57.13″N to 26°15′52.63″N and longitude 91°08′0.87″E to 91°41′41.99″E, covering an area of 596.18 km2 (Figure 1). Administratively, it falls within four districts of Assam state: Barpeta (15%), Nalbari (36%), Kamrup (47%), and Dispur (2%). The topography is generally uneven on this fertile, sandy loam soil with a neutral pH of 6.8–7.2. The region experiences a tropical humid climate with summers from March to May, monsoons from April to August, and cool winters from October to February. Temperatures range from 12°C to 33°C. Annual rainfall averages between 1500 and 2700 mm.
3 DATA USED AND THEIR SOURCES
Data for the Palasbari-Gumi reach were sourced both from secondary and primary outlets to meet study objectives. Analytical methods were appropriately applied to the collected data, encompassing rainfall data from established stations, numerical rainfall forecasts, river cross-sections, water levels, discharge measurements, bathymetry, topographical information, sediment characteristics, ADCP velocity readings, high-resolution DEM, and satellite imagery.
Survey of India (SoI) toposheets at a 1:50,000 scale was obtained from the SoI website (https://onlinemaps.surveyofindia.gov.in/). Five toposheets were downloaded, effectively covering the entire study area. These toposheets underwent geoprocessing and were utilized for base mapping and analysing the study area's general topography. SRTM DEM data with 30 m spatial resolution from 2014, retrieved from https://earthexplorer.usgs.gov/, was utilized to validate topographical cross-section data and analyze the study area's topography. Landsat-5 TM, Landsat-7 ETM+, Landsat-8 OLI, and Landsat-9 OLI-2 satellite images, each with a 30 m spatial resolution, spanning from 1998 to 2022, were acquired from https://earthexplorer.usgs.gov/. These images were utilized for planform and riverbank erosion analysis. Cross-section data was sourced from the Water Resource Department, Assam, accessible at https://waterresources.assam.gov.in/. This data was subsequently enhanced by incorporating available bathymetry data. Water level observations spanning 2018–2022 were acquired from the Central Water Commission (CWC) at https://ffs.tamcnhp.com/. To validate these water levels, numerical simulations were conducted, cross-referencing them with rainfall data from TRMM and GPM sources. Discharge data spanning from 2017 to 2022 were gathered from the Global Flood Monitoring System (GFMS) at http://flood.umd.edu/. These datasets, encompassing water levels and discharge rates, were instrumental in defining the hydrological boundaries for the two-dimensional (2D) model. Bathymetry, grain size characteristics, and ADCP velocity measurements for the year 2018 were sourced from an ISC report provided by the Flood and River Erosion Management Agency of Assam (FREMAA), Government of Assam, available at https://fremaa.assam.gov.in/. Additionally, topography and bathymetry data were collected through primary surveys conducted in the year 2022.
4 METHODOLOGY
4.1 Morphodynamic characteristics
4.1.1 Braided planform
The Brahmaputra, a vast alluvial river, exhibits extensive braid plains, with widths of up to 20 km, individual channel widths spanning several kilometers, and scour depths reaching a maximum of approximately 50 m (Thorne et al., 1993). These channels can be categorized into three scales: the first-order channel encompasses the entire river, within which there are variable numbers of second-order channels termed anabranches. Further, within these second-order channels, flow division and rejoining occur to form third-order channels. The degree of braiding in such a river can be quantified by the total count of channels across the full width of the braid plain (Pareta, 2022). The total width of the Brahmaputra's braided course in Assam has undergone a century-long increase, expanding from 6 to 9 km (Table 1). From 1998 to 2022, it has further widened by approximately 0.38 km. In Bangladesh, over the past two centuries, the river's width has doubled, growing from 6 to 12 km (FAP24, 1996).
| Planform characteristics | Brahmaputra, Assam | Brahmaputra, Bangladesh |
|---|---|---|
| Braid plain width/river width (km) | 6 (1912–1928) | 6 (1830) |
| Braid plain width/river width (km) | 9 (2006) | 12 (2013) |
| Braid plain width/river width (km) | 9.38 (2022) | - |
| Braiding index | 2–9 | 2–5 |
| Braided bars (ha) | 66,000 | - |
4.2 Sediment transport
The Brahmaputra ranks as the world's third-highest sediment-yielding river. Notably, fine sand in its riverbed becomes mobile at an exceedingly low threshold velocity, around 0.2 m/s (Hujlstrom, 1935). Research indicates that the median grain size of the riverbed and bars ranges from 0.05 to 0.22 mm (FAP24, 1996; Goswami, 1985). Maximum velocities have been recorded at the Bahadurabad station in Bangladesh, situated approximately 20 km from the Indian border (FAP24, 1996). Local sediment transport plays a pivotal role in shaping various scour patterns. Consequently, any planning and design of river training initiatives necessitates accurate predictions of sediment transport. Table 2 provides insights into the sediment transport characteristics of large-braided rivers.
| River | Type | Discharge (minimum–maximum), m3/s | Discharge, Avg, m3/s | Sediment size (mm) | Sediment load (Mt/year) |
|---|---|---|---|---|---|
| Zaire | Braided | 23,000–80,000 | 42,000 | 1.00–0.30 | 33 |
| Yellow/Yangtze | Braided | - | 02,571 | 0.03–0.01 | 480 |
| Brahmaputra/Jamuna | Braided | 4000–100,000 | 20,000 | 0.22–0.15 | 520 |
4.3 Riverbank erosion
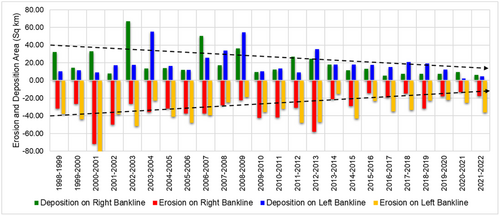
In alluvial rivers like the Brahmaputra, continuous bank erosion occurs when the flow surpasses the sediment movement threshold at the riverbank's toe. This erosion is particularly pronounced along the outer bank of braided channels and at the upstream end of islands or emerged bars. In Assam's Brahmaputra, over 50% of the total bank length experiences erosion, affecting both the left (south) and right (north) banks. Author utilized 25 years of Landsat satellite imagery (1998–2022) and ArcGIS software to analyze erosion-deposition patterns along the Brahmaputra River's banklines. Figure 2 illustrates year-wise (1998–2022) total erosion and deposition statistics for both the left and right banklines in Assam. Negative values indicate erosion, while positive values denote deposition. The trend of erosion and deposition has been decreasing from 1998 to 2022. A notable observation is the significant erosion along the south bank (left bank) of the Brahmaputra River compared to the north bank (right bank). Several factors contribute to this disparity, including the south bank's lower elevation, reduced vegetation cover, exposure to higher monsoon flow velocities and sediment loads, and geological characteristics rendering it more susceptible to erosion processes.
4.4 Model development
The 2D model spans 57 km, encompassing the entire width of the Brahmaputra River. It extends from Saraighat Bridge in Guwahati, concluding at Bahari (Barpeta district) on the north bank and Sontoli (Kamrup district) on the south bank. Notably, the Brahmaputra River's width is just 1.49 km at Saraighat Bridge but widens significantly to 18.83 km approximately 37 km downstream near Palasbari-Gumi, marking one of the world's most substantial river-width variations (Figure 3).

4.5 Model set-up—Computational grid
The 57 km model utilizes a grid comprising 148,200 computational cells in a curvilinear orthogonal grid system based on MIKE 21C modeling technology (DHI, 2017). This grid effectively covers the entire width of the approximately 20 km-wide Brahmaputra River. The grid is structured with 570 computational cells along the river's length and 260 across its width (Figure 3). The finer resolution is particularly crucial for assessing phenomena like bend scour, obstruction scour, and bank erosion. Given the river's width and the dimensions of its anabranches, the current computational resolution is deemed sufficient for accurately simulating these various scour processes and bank erosion.
The author has produced orthogonal curvilinear grids tailored for use in the MIKE 21C modeling system, renowned for its high flexibility. These grids are intricately linked with terrain generalization. The author has opted for a mesh grid with moderate resolution, a choice that bolsters the model's stability. Selecting a finer resolution grid, although feasible, would invariably extend simulation runtimes, potentially compromising model stability. This highlights the pivotal role of meticulous mesh design as a critical factor influencing the model's ability to deliver dependable results.
4.6 Model topography and bathymetry
The bathymetry data for the 2D model was primarily derived from existing navigational channel data, focusing on the main channels and select deep anabranches. Additionally, cross-sectional data from the water resource department (WRD) at the Palasbari-Gumi reach (CS:21 to CS:16) was utilized to estimate the formation level of relatively stable and permanent islands (Figure 3). This estimation assumed that changes in the formation level of such islands have been minimal in recent years. It's important to note that the model's bathymetry was constructed with limited available data. Nevertheless, the current model has demonstrated its capability to effectively describe hydraulic and morphological processes in the study area. It has successfully generated crucial hydraulic and morphological design parameters essential for the planning and implementation of river training works, including activities like revetment work, groynes, dikes, and dredging for navigation.
4.7 Hydrological conditions
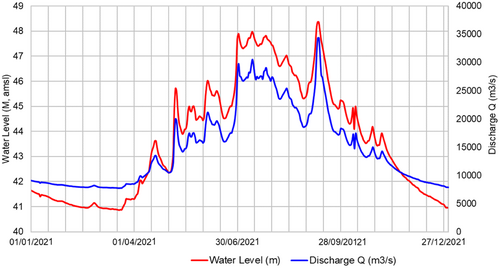
In the 2D model simulation, hydrological boundaries were defined using discharge and water level data. The inflow at the upstream boundary, situated 3 km downstream from Pandu, was determined by utilizing discharge data from the Pandu gauging station. Meanwhile, at the downstream boundary, located 54 km downstream from Pandu, water level data were applied. Model calibration was conducted for the 2021 hydrological year (Figure 4), followed by validation in June 2022. Discharge values at the Pandu gauging station for the 2021 hydrological year were obtained through a rating curve utilizing water level data at Pandu.
4.8 Grain size characteristics
Grain size data collected in 2018 from various sources were utilized to assess grain characteristics, gradation, and sorting processes relevant to morphological studies, including roughness, sediment transport, and morphological prediction. A total of 20 samples were collected across seven cross-sections within the 51 km reach of the 2D model domain at Palasbari-Gumi. At each cross-section, three samples were taken from the riverbed: one from the middle and two from either side. Van Veen Grab samplers were employed for sample collection. The grain size data closely align with previously cited grain size information for the Brahmaputra in the literature (Table 3). The sorting parameter (σ), indicative of sediment sorting in the riverbed, suggests well-sorted sediment, as it is less than 1.65, thus permitting the application of sediment transport formulas suitable for uniform sediment (with median grain size, D50) in sediment transport and morphological prediction (ASCE Manual of Practice, 2006; Schumm & Parker, 1973).
5 RESULT AND DISCUSSION
5.1 Morphological model for prediction of erosion
The morphological model developed here employs MIKE-21C technology to predict erosion patterns and plan protective measures in the Palasbari-Gumi stretch of the Brahmaputra River. It utilizes available data, including topography, discharge, and sediment characteristics, to simulate morphological changes under various hydrological scenarios. The model offers valuable insights for erosion prediction and river management in this dynamic environment.
5.2 Hydrological scenarios
The model conducted multiple runs encompassing different hydrological scenarios to predict design variables along the Palasbari region of the Brahmaputra River during the monsoon period when the model displays heightened morphological dynamics. The simulation period spanned from May to October, involving (a) bankfull discharge conditions (approximately a 1 in 2-year return period); (b) a 1 in 100-year discharge condition; and (c) the recent hydrological discharge data of 2021. The discharge and water level hydrographs from 2021, utilized for model calibration, were adjusted to match the peak magnitudes of 1 in 2-year and 1 in 100-year flood events. The model runs were conducted under fixed bed conditions, utilizing the topography data from June 2022 for the overall model area and the bathymetry data from August 2022 for the specific river reach of Palasbari and Gumi.
5.3 Development and planning scenarios
For morphological prediction, Author utilized specific scenarios: (a) assuming the entire south bank in the 51 km 2D model domain is nonerodible, mimicking trained/fixed banks to assess scour development in the river; (b) incorporating river training works in the model at Palasbari and Gumi to evaluate their impact on bank erosion in the unprotected south bank reach; (c) considering the entire Palasbari bend as nonerodible to assess the impact on the unprotected south bank reach. These scenarios aid in understanding erosion dynamics and protection work requirements.
5.4 Hydrodynamic design variables
Author conducted model runs under specific hydraulic conditions: (a) fixed bed with June 2022 topography overall and August 2022 bathymetry at Palasbari and Gumi; (b) bankfull discharge condition (1 in 2 years return period); (c) 1 in 100 years discharge condition; and (d) 2021 recent hydrological discharge of 2021 peak flow condition. Depth, velocity, and water level were determined using a specific bathymetry. Depth may vary with different riverbed topographies, while water level changes minimally under the same hydrologic conditions. The water level data in Table 4 can help calculate depth for various bathymetry conditions. Depth is essential for designing protective measures like revetment apron length, spur, and groynes dimensions. It's crucial to factor in local scour when calculating design scour depth. Additionally, the 2D model can assess the performance of protection works (revetments, geo-bags, spurs). Figure 5 displays the flow velocity distribution for the 1 in 100 year event.
| Hydrology of 2021 | 1 in 2 year flood (bankfull discharge) | 1 in 100 year flood | |||||
|---|---|---|---|---|---|---|---|
| Palasbari | Gumi | Palasbari | Gumi | Palasbari | Gumi | ||
| Depth (m) | Maximum | 33.06 | 14.38 | 33.82 | 15.03 | 35.51 | 16.51 |
| Average | 09.06 | 05.23 | 09.82 | 05.87 | 11.49 | 07.35 | |
| Water level (m) amsl | Maximum | 46.89 | 45.68 | 47.73 | 46.33 | 49.58 | 47.81 |
| Average | 46.41 | 45.42 | 47.16 | 46.06 | 48.83 | 47.54 | |
| Minimum | 46.03 | - | 46.71 | - | 48.24 | - | |
| Speed (m/s) | Maximum | 02.53 | 2.367 | 02.81 | 2.428 | 03.33 | 2.430 |
| Average | 01.21 | 00.61 | 01.40 | 00.66 | 01.77 | 00.73 | |
| Pandu gauging station variables (observed data or from frequency analysis) | |||||||
| Discharge (m3/s) | 34,333 | 42,500 | 66,000 | ||||
| Water level (m) amsl | 48.36 | 48.74 | 49.94 | ||||
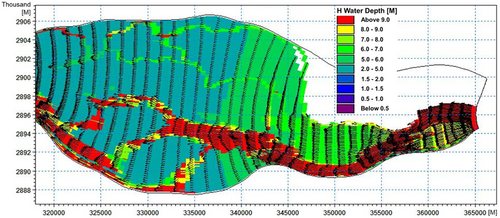
The model's predictive accuracy was rigorously tested against a well-established benchmark, demonstrating its reliability and efficacy. Specifically, in the Gumi reach, the model yielded an average flood level projection of 46.06, with the highest predicted flood level reaching 46.33 at the upstream boundary of the reach. These results highlight an impressive alignment between the model's predictions and real-world field data, affirming the model's capability to simulate and forecast hydraulic conditions with a high degree of accuracy and precision. This validation process underscores the model's utility and suitability for informing critical decision-making processes related to flood and erosion management along the Brahmaputra River.
5.5 Model calibration and validation
Hydrodynamic variables, primarily ADCP velocity measurements, played a pivotal role in calibrating the model. This calibration was essential to establish the model's reliability in predicting sediment load and, consequently, morphological changes like scour and erosion. To fine-tune the model's performance, Chezy's flow friction factor (C) was adjusted through iterative model runs, aligning model-generated variables, such as velocity and sediment load, with measured data. The MIKE21C modeling software allowed for the incorporation of spatial variations in Chezy's C, accounting for differing roughness conditions between shallow islands and deep channels. Bedforms like dunes and ripples were also considered, impacting roughness. MIKE21C's capabilities extended to quantifying flow friction due to the dynamic evolution of bars and bedforms in braided rivers.
Various researchers, including van Rijn (1984), have proposed empirical equations to evaluate flow friction attributable to skin roughness (resulting from sediment grains) and form roughness (associated with ripples and dunes). Applying van Rijn's formula to the Brahmaputra River, hand calculations yielded values ranging from 55 to 60 for deep channels, 40–45 for channels with more average depths, and 25–30 for shallow islands. The calibrated Chezy's C values in 2D model demonstrated a commendable alignment with ADCP velocities and sediment load data. Notably, these C values fell within the range derived from the hand calculations based on van Rijn's formula.
5.6 ADCP velocity comparison
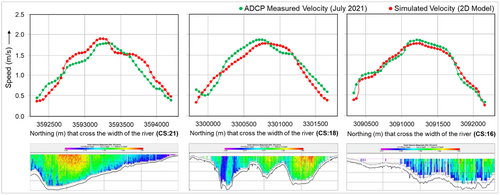
The 2D model accurately predicted velocities in the primary channel within the Palasbari and Gumi area. Calibration was conducted for the 2021 hydrological year, and validation was performed against June 2022 flow data. Both calibrated and validated velocities exhibited strong agreement with ADCP measurements. ADCP-measured velocities from July 2021 across the main channel in Palasbari revealed that the peak model velocity deviated by approximately 9% from the measurements, which is deemed satisfactory for sediment load prediction (Figure 6). Validation against ADCP measurements from June 2022 also demonstrated the model's capability to predict velocity distribution effectively, with average velocity matching well in three river sections and minor errors below 12% in two other sections (Figure 6).
5.7 Sediment load comparison
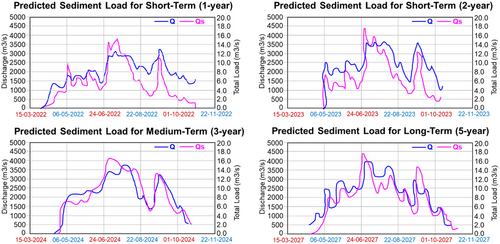
The model effectively predicted sediment load for the 2021 hydrological condition and bankfull discharge scenario, closely aligning with historical measurements (Table 5). It employed the Engelund and Hansen (1967) total transport load formula with a median grain size (D50) of 0.16 mm for fine sand. In comparison to the observed load at Bahadurabad on the Brahmaputra, the model produced highly satisfactory results. However, the observed load at Pandu appeared higher than the model prediction, potentially due to the inclusion of wash load, although this wasn't explicitly stated in the reference. Wash load typically constitutes 40%–50% of the total load (Coleman, 1969; FAP24, 1996). Assuming this ratio holds and considering a coarse sediment load of approximately 200 Mt/year at Bahadurabad, the Pandu load indicated in the literature seems elevated if it contains only the coarse fraction. Therefore, given the fractional ratio, the 2D model's load prediction also aligns satisfactorily with the measurement at Pandu (Figure 7).
| Predicted and observed | Peak discharge (m3/s) | Mean annual predicted load (Mt/year) | Remarks |
|---|---|---|---|
| MIKE21C model (this study) | 2021 hydrology peak discharge: 34,333 | 257 | Bed + suspended load, without wash load. Grain size is 0.16 mm |
| MIKE21C model (this study) | Bankfull hydrology peak discharge: 42,500 | 314 | |
| Observed at Pandu (Singh & Goswami, 2011) | Year: 1955–1979 | 400 | Not known whether was load inclusive |
| Observed at Bahadurabad (FAP24, 1996) | 590 | Inclusive of wash | |
| 202 | Without wash load | ||
- Abbreviation: 2D, two-dimensional.
5.8 Erosion and scours assessment
Predictions indicate bed scour of approximately 12–25 m along the Palasbari bend for the three flood events (Table 6). In contrast, scour along the Gumi bend is lower, ranging from 4 to 8 m. Both short-term (1-year) and medium-term (3-year) forecasts do not suggest significant development of the Gumi anabranch in the upcoming year (Figure 8). Some localized high scour values predicted in the model are considered nonrepresentative and are likely due to coarse-scale bathymetric data. These areas can be improved with high-resolution bathymetric survey data, particularly along the edges of deeper channels. Nevertheless, it's observed that the Palasbari channel bend experiences siltation and narrows after the peak flood and sediment load from the stable channel section at Pandu has passed. This change is illustrated in bathymetric plots (Figure 8a) at the start of the monsoon (May) and (Figure 8b) after the peak of the hydrograph.
| Predicted maximum bed scour at Palasbari and Gumi bend | |||
|---|---|---|---|
| Hydrology of 2021 | 1 in 100 year | Bankfull Flood: 3 successive years | |
| Palasbari bend bed scour (m) | 12 | 18 | 25 |
| Gumi reach bend bed scour (m) | 4.5 | 5 | 8 |
| Discharge (m3/s): Peak value at Pandu | 34,333 | 66,000 | 42,500 |
- Abbreviation: 2D, two-dimensional.

5.9 Bank erosion prediction
Bank erosion prediction for the south bank at the Palasbari and Gumi reach was conducted, providing predictions for 1-year, 3-year, and 4-year scenarios. Two development scenarios were considered: (a) the existing condition with protection by geo-bags along the Palasbari and Gumi reach, (b) protection along the entire Palasbari bend and the existing Gumi training work. However, effective bank erosion management at Palasbari and Gumi needs integration with development plans for the north bank immediately upstream of Palasbari and further upstream, as the north bank's development can significantly influence erosion and channel changes downstream.
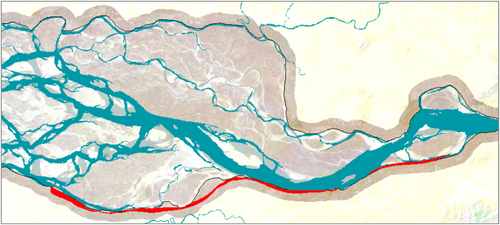
Bankfull discharge, which has a frequent probability of occurrence (1 in 2-year), was applied to all erosion predictions. For medium-term forecasts (3 and 4 years), the 1-year monsoon hydrograph was multiplied to create the 3 and 4-year hydrographs. The areas affected by erosion under bankfull discharge conditions are illustrated in Figure 9, with red lines indicating eroded banklines. Gaps without erosion indicate existing protective measures at Palasbari and Gumi. The yearly erosion rate ranges from 10 to 30 m, with some areas, like the protruded banklines downstream of Palasbari bend, experiencing minimal erosion rates below 5 m annually. In the medium-term scenario, protecting the entire Palasbari bend fosters morphological development, elevating downstream riverbanks to form islands within 3 years. This may, however, intensify erosion downstream of Gumi's bank protections, necessitating extensions. The initial bank erosion rate is 15 m per year, diminishing to 8 m annually in the fourth year. The north bank near Pandu lacks erosion predictions but faces vulnerability due to swift, deep channels. It's pivotal for controlling Palasbari bend erosion and downstream channel development. A comprehensive approach, model extension to Pandu Bridge, and assessing the second bridge's impact are vital for long-term predictions.
6 CONCLUSION
A 2D morphological model for Brahmaputra's Palasbari-Gumi reach was developed, resolving bend scour, confluence scour, obstruction scour, and bank erosion. It employs multiblock grid generation and is based on 2022 topographic and WRD cross-section surveys. Covering 57 km with a width of approximately 20 km, it was calibrated for 2021 hydrology and validated against June 2022 flows. Predictions closely matched ADCP velocities, design flood levels, and yearly sediment load. Peak model velocities deviated by less than 9% from measured data, and flood levels for bankfull discharge were 96% accurate at Gumi.
The model predicts an annual sediment load of 257 Mt/year for the coarse sand fraction in 2021, under bankfull discharge conditions, while historical observations indicate 400 Mt/year in the Brahmaputra. Predicted hydraulic design variables for Palasbari and Gumi in 2022 include average depths of 9.82 and 5.87 m, respectively. These may increase to 11.49 and 7.35 m after 100 years. Average water levels for 2022 are 47.73 m (Palasbari) and 46.33 m (Gumi), which could rise to 48.83 and 47.54 m after a century. Average speeds in 2022 are 1.4 m/s (Palasbari) and 0.66 m/s (Gumi), possibly reaching 1.77 and 0.73 m/s in 2122, respectively. Generally, bed scour predictions range from 12 to 25 m during three flood events along Palasbari bend, while Gumi bend experiences comparatively lower scour, typically between 4 and 8 m. Short-term (1-year) and medium-term (3-year) predictions do not suggest significant development of the Gumi anabranch in the near future.
Bank erosion forecasts were conducted along the south bank in the Palasbari-Gumi reach, encompassing 1-year, 3-year, and 5-year scenarios. These scenarios considered the baseline condition with geo-bag protection at Palasbari and Gumi sites and the protection of the entire Palasbari bend while maintaining existing Gumi work. Annual erosion rates range from 10 to 30 m, with some areas experiencing minimal yearly erosion below 5 m, primarily downstream of Palasbari and Gumi sites. Minor embayment development is observed immediately upstream of each site, with a maximum of 10 m of bank erosion. Protecting the entire Palasbari bend is predicted to enhance morphological development between Palasbari and Gumi, causing significant siltation upstream of Gumi but also leading to increased bank erosion downstream of the Gumi protection works. This study demonstrates a methodology for improving the planning and execution of river training measures in highly braided rivers like the Brahmaputra by predicting morphological changes over a 2–3 year period.
ACKNOWLEDGMENTS
Author is grateful to Managing Director, DHI (India) Water and Environment Pvt Ltd, New Delhi, India for providing the necessary facilities to carry out this work.
ETHICS STATEMENT
None declared.
Open Research
DATA AVAILABILITY STATEMENT
Data will be made available on request.


