From the headwaters to the sea: The role of riparian, alluvial, and tidal wetlands to filter nutrients and ameliorate eutrophication
Abstract
Wetlands are known for their ability to trap sediment and eliminate pollutants from the surrounding catchment. However, less is known regarding the differential role of headwater, mid-catchment, and coastal wetlands in filtering these materials. Soil accretion, organic carbon (C), total nitrogen (N), and total phosphorus (P) were measured in wetlands from the headwaters to the mouth of the Altamaha River, Georgia, USA to assess how sediment deposition, C sequestration, and N and P burial vary along the waterway. Soil cores (n = 2 per site) were collected from riparian, upper and lower alluvial, tidal freshwater forest and marsh, brackish marsh, and salt marsh. Two-centimeter depth increments were analyzed for 137Cs, to determine soil accretion, bulk density, and C, N, and P concentration. Accretion exhibited a bimodel distribution with the highest rates in riparian wetlands of the headwaters (3.9 mm/year) and in tidal fresh and brackish marshes (4.7–5.4 mm/year) of the estuary. Accretion rates were considerably lower in alluvial and tidal fresh forests and salt marshes (0.9–2.5 mm/year). Carbon sequestration and N burial followed a similar trend with the greatest accumulation in soils of tidal fresh and brackish marshes (102–150 g C/m2/year, 7.1–9.5 g N/m2/year) that had not only high accretion but also high organic matter content (11%–12% C). Riparian soils with their low C content, high bulk density, and high P content had much greater sediment deposition (3310 g/m2/year) and P burial (2.75 g P/m2/year) than other wetlands along the waterway (180–1730 g sediment/m2/year, 0.23–0.90 g P/m2/year). Results suggest that, in the Altamaha River, sediment deposition and P removal are maximized in the headwaters thereby protecting downstream freshwaters from the effects of P eutrophication. Tidal fresh and brackish marshes with their high rates of N burial can aid in protecting estuaries from N enrichment, many of which suffer from the effects of N eutrophication. Results from this study are scalable to other rivers of the southeastern U.S. piedmont and coastal plain and similar rivers of this size, topography, and geology.
1 INTRODUCTION
Wetlands, transitional between terrestrial and aquatic ecosystems, trap sediment, filter nutrients, nitrogen (N) and phosphorus (P), and sequester carbon (C). Their ability to remove sediment and nutrients depends, in part, on their proximity to the source material (Phillips, 1989), including adjacent uplands, their degree of connectivity to aquatic ecosystems such as rivers and estuaries, flood duration, distance from the main channel, vegetation type, and other factors (Bannister et al., 2015; Craft & Casey, 2000; Job & Sieben, 2022; Lisenby et al., 2019; Noe et al., 2022; Woznicki et al., 2020). Riparian wetlands are known for their ability to intercept sediment and P from adjacent uplands, especially runoff from agricultural land (Fennessy & Craft, 2011; Graziano et al., 2022; Stutter et al., 2021). Alluvial floodplain wetlands also remove sediment and denitrify nitrate during periods of overbank flooding (Schultz et al., 2022; Sgouridis et al., 2011; Steven & Lowrance, 2011; Wolf et al., 2013). Tidal wetlands, located near the mouths of large rivers and estuaries, often are far removed from sediment and nutrient sources but intercept these pollutants as they make their way to the sea (Craft, 2007; Loomis & Craft, 2010).
Over geologic time, headwater regions serve as a net source of material whereas areas near the mouth of rivers and estuaries, and ultimately the sea, are sinks for these materials. Along the way downstream, wetlands store N and P as they are buried by mineral sediment and by deposition of nutrient-rich litter that is incorporated into the soil (Bannister et al., 2015; Noe & Hupp, 2005). To date, most studies of wetland nutrient retention have focused on individual wetland types such as riparian (Hoffmann et al., 2011) or alluvial (Noe et al., 2022), or tidal wetlands (Cornwell et al., 2021), eschewing measurements of the variation of these processes along the length of the waterway.
An understanding of how wetland sediment and nutrient retention vary along the land-to-sea continuum is critical to targeting their protection for ameliorating P versus N eutrophication. Freshwater ecosystems typically are P limited whereas estuarine wetlands are N limited so it is important to understand how differential N versus P removal varies along the continuum. For this reason, we collected soil cores from riparian wetlands of the headwaters to the saline tidal marshes of the Altamaha River, Georgia, USA to understand how sediment deposition and nutrient burial vary along the waterway. We used 137Cs-derived measurements of accretion along with bulk density and nutrient (N, P, and C) concentrations to characterize rates of sediment, N, P burial, and C sequestration. This study is among the first to document how sedimentation and N, P burial vary in wetlands from the headwaters to the sea of a river system.
2 MATERIALS AND METHODS
2.1 Site description
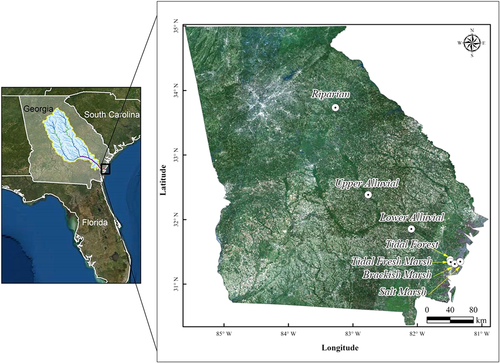
The Altamaha River is approximately 630 km long and drains the third largest watershed along the Atlantic coast of the U.S. It is the largest undammed river along its mainstem of the Atlantic coast river. The watershed is mostly forested with moderate amounts of agriculture and little urban land (Table 1). Along the length of the watershed, we sampled riparian wetlands, upper and lower alluvial floodplain forests, tidal freshwater forests and marshes, brackish marshes, and salt marshes (Figure 1). One site was sampled for riparian and alluvial floodplain wetlands. For tidal forests and marshes, two sites were sampled. Riparian areas were sampled in the Oconee National Forest south of Athens, Georgia. Upper and lower alluvial floodplain forests were sampled in Riverbend Wildlife Management Area (WMA) southeast of Dublin, Georgia, and Big Hammock WMA, southwest of Glennville, Georgia. Tidal freshwater forests were sampled at Lewis Island, tidal freshwater marshes at Broughton Island, and salt marshes at Rockdedundy Island, all located near Darien Georgia. Latitude, longitude, wetland elevation, and dominant vegetation of the sites are presented in Table 2.
| Catchment area (km2) | 35,112 | |
|---|---|---|
| River length (km) | 630 | |
| Median discharge (m3/s) | 250 | |
| Median flushing time (d) | 5.8 | |
| Suspended sediment (mg/L) | 38 | |
| Population (2000) | Persons (per sq. km) | 65.4481 |
| Land use (2001) | Forest (%) | 49.9 |
| Agriculture (%) | 17.0 | |
| Urban (%) | 9.5 | |
| Water (%) | 12.4 | |
| Othera (%) | 11.2 |
- Note: From United States Geological Survey Elevation Derivatives for National Applications-derived watershed characteristics (https://edna.usgs.gov/watersheds/ws_chars.php?title=Altamaha%26name=altamaha).
- a Includes grassland (9.7%), shrubland (0.9%), and barren (0.7%) (from Craft, 2012; Loomis & Craft, 2010).
| Wetland type | Sampling time | Number of cores | Latitude | Longitude | Elevation | Dominant vegetation | Reference |
|---|---|---|---|---|---|---|---|
| Riparian | 2011 | 2 | 33°44′5.7″ | 83°16′16.7″ | 164 m | Platanus occidentalis (sycamore), Populus deltoides (cottonwood), Salix nigra (black willow) | – |
| Upper alluvial | 2011 | 2 | 32°23′3.5″ | 82°45′44.5″ | 40 (70) | Betula nigra (river birch), Fraximus pennsylvanica (green ash) | – |
| Lower alluvial | 2011 | 2 | 31°51′13″ | 82°05′33″ | 15 (20) | Quercus palustris (swamp white oak), Acer rubrum (red maple), Liquidambar styraciflua (sweetgum), Fraximus pennsylvanica (green ash) | – |
| Tidal forest | 2008 | 2 | 31°22′40.3″ | 81°29′28.3″ | – | Nyssa aquatica (tupelo gum), Taxodium distichum (bald cypress), Nyssa sylvatica (black gum) | Craft (2012) |
| Tidal fresh marsh | 2005 | 2 | 31°20′32.2″ | 81°29′1.0″ | 0.78 | Zizaniopsis mileacea (giant cutgrass) | Loomis and Craft (2010) |
| Brackish marsh | 2005 | 2 | 31°18′40″ | 81°25′7.7″ | 0.95 | Juncus roemerianus (black needlerush) | Loomis and Craft (2010) |
| Salt marsh | 2005 | 2 | 31°20′55.7″ | 81°20′7.8″ | 0.87 | Spartina alterniflora (smooth cordgrass) | Loomis and Craft (2010) |
2.2 Soil sampling and lab analysis
For the riparian and alluvial floodplain wetlands, two soil cores, one from the natural levee and one from the interior floodplain, were collected from each site. Riparian and alluvial floodplain wetlands were sampled in 2011, tidal forests in 2008, and tidal marshes in 2005. Core data from tidal forests were published in Craft (2012). Core data from tidal marshes were published in Loomis and Craft (2010). Cores, 8.5 cm diameter by 30 cm deep, were sectioned into 2 cm increments in the field, then transported to the lab where they were air dried and weighed for bulk density. Once dried, increments were ground, passed through a 2 mm mesh sieve, and analyzed for 137Cs, 210Pb, total C, N, and P.
The bulk density of each depth increment was calculated from the dry weight per unit volume after correcting for the moisture content of an oven-dried (70°C) soil sample (Blake & Hartje, 1986). Before C analysis, subsamples were tested for the presence of carbonates by adding one drop of 0.1 mol L−1 HCl and observing whether effervescence occurred. Samples containing carbonates were treated with 0.1 mol L−1 HCl before C and N analysis. Carbon and N were analyzed using a Perkin-Elmer 2400 CHN analyzer (Perkin-Elmer). Total P was determined colorimetrically after digestion in nitric-perchloric acid (Sommers & Nelson, 1972). Analysis of an-house standard (%C = 6.1, %N = 0.365, n = 20) yielded the average recovery of 103% and 102% for C and N, respectively. For P, analysis of NIST Standard #1646a (estuarine sediment) recovered 88% (n = 18). All analyses were expressed on a dry weight basis by correcting for the moisture content of the soil, determined by weighing 1 g of subsoil before and after drying at 70°C for 24 h.
For radiometric analyses, ground soils were packed into 50 mm diameter by 9 mm Petri dishes and analyzed by gamma spectrometry for 137Cs using the 661.6 keV photopeak. Cesium-137 (half-life 30 years) is an impulse marker produced as fallout by aboveground nuclear bomb blast tests (Ritchie & McHenry, 1990). We used the increment with maximum 137Cs activity to represent the year 1964, the year of greatest atmospheric deposition.
Rates of C, N, and P accumulation were calculated using 137Cs-derived accretion rates, bulk density, and C, N, and P concentration in depth increments above and including the 137Cs maximum.
2.3 Statistical analysis
The small sample size precluded statistical analysis of differences in soil characteristics, accretion, and accumulation among riparian, upper and lower alluvial, tidal freshwater forest and marsh, brackish marsh, and salt marsh so wetland means ± SE are presented. Correlation analysis was used to explore associations between soil characteristics, accretion, and accumulation (SAS Institute, 2002) with tests of significance conducted at p ≤ 0.05.
3 RESULTS
3.1 Soil bulk density and organic C, N, and P concentration
Soil bulk density varied along the waterway, ranging from 0.23 g/cm3 in the tidal freshwater marsh to 0.98 g/cm3 in the upper alluvial floodplain (Table 3). Riparian and floodplain soils were characterized by high bulk density (0.81–0.95 g/cm3) whereas the bulk density of tidal forests and marshes were much lower (0.23–0.40 g/cm3). Conversely, soils of the tidal forest, fresh and brackish marshes contained higher percent organic C (11%–16%) and total N (0.70%–0.95% N) than other wetlands along the continuum (2.1%–4.6% C, 0.17%–0.35% N). Phosphorus concentrations were not as variable as C and N, ranging from 430 µg/g in the upper alluvial floodplain to 710 µg/g in the riparian wetland. The bulk density of salt marshes was intermediate (0.40 g/cm3) to other wetlands.
| Landscape position | Bulk density (g/cm3) | Organic C (%) | N (%) | P (µg/g) | C:N | N:P |
|---|---|---|---|---|---|---|
| Riparian | 0.95 ± 0.03 | 2.2 ± 0.10 | 0.17 ± 0.01 | 720 ± 40 | 15 ± 0.1 | 6 ± 1.5 |
| 800 ± 40 | ||||||
| Upper alluvial | 0.98 ± 0.11 | 2.2 ± 0.80 | 0.18 ± 0.06 | 430 ± 110 | 15 ± 0.1 | 12 ± 2.5 |
| Lower alluvial | 0.81 ± 0.06 | 2.1 ± 0.20 | 0.18 ± 0.02 | 440 ± 90 | 19 ± 3.0 | 10 ± 4.3 |
| Tidal forest | 0.26 ± 0.05 | 16.0 ± 3.00 | 0.90 ± 0.15 | 580 ± 70 | 20 ± 0.4 | 34 ± 1.6 |
| Tidal fresh marsh | 0.23 ± 0.04 | 12.0 ± 2.00 | 0.75 ± 0.14 | 610 ± 60 | 19 ± 0.4 | 27 ± 2.4 |
| Brackish marsh | 0.25 ± 0.03 | 11.0 ± 2.00 | 0.70 ± 0.08 | 580 ± 40 | 18 ± 1.3 | 27 ± 1.2 |
| Salt marsh | 0.40 ± 0.01 | 4.6 ± 0.30 | 0.35 ± 0.02 | 560 ± 40 | 15 ± 0.1 | 14 ± 0.2 |
- Abbreviations: C, carbon; N, nitrogen; P, phosphorus.
Carbon:nitrogen (C:N) ranged from 15 to 20 with no clear trend along the waterway (Table 3). Lowest C:N was at the ends of the waterway, in riparian and upper alluvial forest, and in the salt marsh. Nitrogen:phosphorus (N:P), in contrast, exhibited a clear trend along the continuum, increasing from the headwaters to the middle reach of the estuary in brackish and tidal freshwater marsh soils (Table 3). Riparian wetland soils had the lowest N:P (6) that increased downstream to tidal fresh forests (34). N:P of brackish and tidal freshwater marshes also were high (27) but salt marshes had N:P (14) similar to other mineral soil wetlands along the waterway.
Soil C, N, and N:P were strongly negatively correlated with bulk density (Table 4). N:P was strongly and positively correlated with C and N but not with P. C:N was correlated with C but not with N. Accumulation of C and N was positively correlated with accretion rate (r = 0.86, p < 0.0001). C and N accumulation were strongly correlated (Table 4) as were P accumulation and sediment deposition (Table 4).
| Properties | Accumulation | ||||||||||
|---|---|---|---|---|---|---|---|---|---|---|---|
| BD | %C | %N | μg/g P | C:N | N:P | AR | Sed | C | N | P | |
| BD | – | −0.81*** | −0.83*** | 0.01 | −0.49 | −0.63*** | −0.35 | 0.51 | −0.35 | −0.27 | 0.39 |
| %C | 0.99**** | 0.01 | 0.61* | 0.95**** | 0.15 | −0.42 | 0.31 | 0.26 | −0.34 | ||
| %N | 0.03 | 0.49 | 0.95*** | 0.19 | −0.43 | 0.38 | 0.33 | −0.37 | |||
| μg/g P | 0.11 | −0.23 | 0.24 | 0.34 | 0.30 | 0.36 | 0.51* | ||||
| C:N | 0.50 | 0.02 | −0.35 | 0.03 | −0.05 | −0.34 | |||||
| N:P | 0.11 | −0.51 | 0.28 | 0.21 | −0.46 | ||||||
| AR | 0.55* | 0.86**** | 0.87**** | 0.56* | |||||||
| Sed | 0.37 | 0.46 | 0.97**** | ||||||||
| C | 0.99**** | 0.42 | |||||||||
| N | 0.52 | ||||||||||
- Note: Significant at *p < 0.05, ***p <0.001, and ****p < 0.0001, respectively.
- Abbreviations: AR, accretion rate; BD, bulk density; C, carbon; N, nitrogen; P, phosphorus; Sed, sediment.
3.2 Soil accretion and N, P, and organic C accumulation
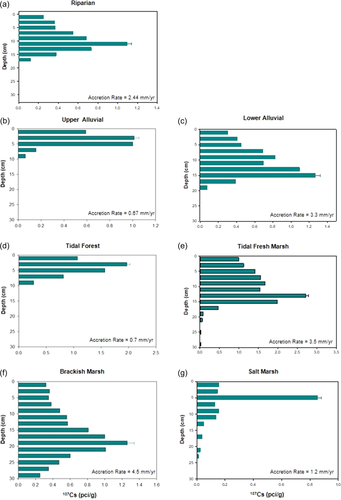
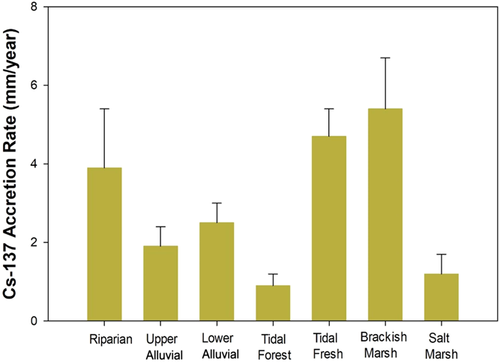
Soil cores exhibited well-defined 137Cs profiles, (Figure 2) with 137Cs maxima occurring at depths of 5–15 cm. Accretion rates based on these profiles ranged from a low of 0.6 mm/year in the tidal forest to 6.1 mm/year in the brackish marsh. Accretion exhibited a bi-modal distribution along the continuum with higher rates of accretion in riparian areas (3.9 ± 1.5 mm/year) near the headwaters and in tidal fresh (4.7 ± 0.7 mm/year) and brackish marshes (5.4 ± 1.3 mm/year) near the sea (Figure 3). Accretion rates were lowest in the tidal forest at the head of the estuary (0.9 ± 0.3 mm/year) and in the salt marsh (1.2 ± 0.5 mm/year) at its mouth.
Accumulation of mineral sediment and P exhibited a weaker yet still bimodal distribution with riparian wetlands having much higher rates, 3310 g sediment/m2/year and 2.75 g P/m2/year, as compared to alluvial and tidal wetlands downstream (Figure 4). A secondary peak in sediment and P accumulation was observed in the brackish marsh where 1150 g sediment/m2/year and 0.9 g P/m2/year were deposited. The tidal forest and salt marsh with their low accretion rates also had the lowest sediment (180–380 g/m2/year and P accumulation 0.23–0.37 g/m2/year). Organic C and N burial mirrored accretion with the greatest accumulation in brackish (150 g C/m2/year, 9.5 g N/m2/year) and tidal fresh marshes (102 g C/m2/year, 7.1 g N/m2/year) with a secondary peak in riparian wetlands (86 g C/m2/year, 6.6 g N/m2/year) (Figure 5).
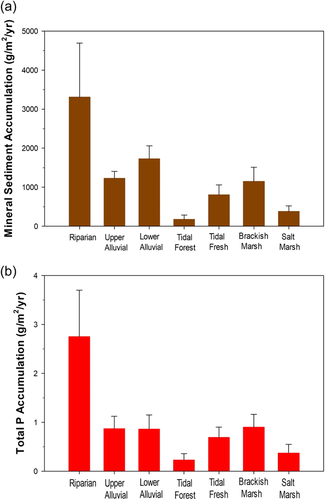
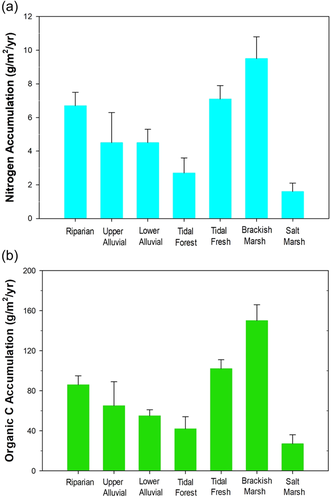
High rates of sediment and P in riparian wetlands reflect greater proximity to inputs of these materials from the terrestrial landscape where most agricultural activities are concentrated (Cooper & Gilliam, 1987; Cooper, Gilliam, Daniels, et al., 1987). The secondary peak in sediment and P accumulation observed in tidal fresh and brackish marshes is attributed to sediment (and P) flocculation in the mixing zone between fresh and saline waters (Loomis & Craft, 2010). For N, the highest accumulation in tidal fresh and brackish marsh is attributed to the high rates of C sequestration in these wetlands where plant productivity and uptake of N as NH4 and NO3 is greatest (Więski et al., 2010).
4 DISCUSSION
Wetlands from the headwaters to the sea exhibited differential processing of mineral (P) versus organic (C, N) nutrients. Wetlands in the higher reaches of the watershed, riparian, and floodplain wetlands had soils that were mineral in nature with low organic C (2%) and high bulk density (>0.8 g/cm3) (Table 3). In contrast, soils of the upper and middle reaches of the estuary, in tidal fresh forest and marsh, brackish marsh, were organic with high organic C (>11%) and low bulk density (<0.26 g/cm3). At the mouth of the river, salt marshes were minerogenic but with more organic C (4%–5%) than other mineral wetlands soils along the waterway. The low C content of salt marshes compared to other tidal marshes is attributed to their exposure to sulfate-rich seawater that promotes decomposition through increased microbial sulfate reduction (Weston et al., 2006) and burrowing fiddler crabs (Uca spp.) that aerate the soil (Chatterjee et al., 2014; Moore, 2019). Salt marsh soils also exhibited bulk densities (0.40 g/cm3) closer to other tidal marshes than to mineral soils of floodplains and riparian areas. Burrowing by fiddler crabs in salt marshes also decreases bulk density by increasing porosity with beneficial effects on soil oxygenation (Egawa et al., 2021; Grow et al., 2022; Weis & Weis, 2004). Percent C and N were strongly correlated (r = 0.99, Table 4) which is expected since >95% of estuarine and nontidal freshwater wetland soil N are in organic form (Craft, 1997; Craft & Chiang, 2002).
Whereas C:N did not vary appreciably along the waterway, N:P varied strongly depending on whether the soil was mineral or organic (Table 3). Mineral soil riparian and floodplain wetlands had low N:P (6–14) while organic soils of the tidal forest, marsh, and brackish marsh were two times greater (27–34). On the basis of such low N:P, mineral soil wetlands of riparian and floodplain likely exhibit strong N limitation as they remove large amounts of sediment and associated P coming off the adjacent terrestrial landscape. N:P of tidal fresh and brackish marshes are considerably higher but also are limited by N based on long-term (10 year) additions of N, P, and N + P to tidal fresh marshes of the Altamaha River (Herbert et al., 2020) and most other coastal wetlands (Morris et al., 2013). N:P was strongly correlated with soil N (r = 0.95) but not P, suggesting that soil N and not P regulates plant productivity and possibly other ecosystem processes of wetlands along the waterway. The effects of N:P on denitrification, another mechanism in addition to burial, are not clear. However, it is not expected to affect denitrification to the same extent as external N loading which is known to increase coupled nitrification-denitrification (Herbert et al., 2020).
Carbon sequestration and N burial were greatest in tidal fresh and brackish marshes (Figure 5) where plant productivity (Więski et al., 2010) and soil accretion were greatest (Figure 3). Both C and N accumulation was strongly correlated with accretion rate (r = 0.87) but not with percent C, N, or bulk density (Table 4) suggesting that the burial of these elements is driven more by accretion than by soil properties.
Riparian wetlands with their high accretion, bulk density, and P concentration had the highest mineral sediment accumulation and P accumulation, far exceeding the deposition and accumulation of all other wetlands (Figure 4). Because of its position in the headwaters of the waterway, most of this material is sourced from the adjacent uplands (Phillips, 1989). Accumulation of mineral sediment and P was less strongly correlated (r = 0.55) with accretion rate than C and N but were strongly correlated with each other (r = 0.99), indicating the intimate linage between P and mineral (sediment) cycles.
5 POLICY IMPLICATIONS
Differential processing of nutrients in headwater (riparian) versus estuarine (tidal fresh and brackish marshes) indicates different roles for these wetlands in reducing nutrient loads and ameliorating the eutrophication of downstream waters. Many freshwater ecosystems are P limited and hence susceptible to P-driven eutrophication (Schindler et al., 2016, 2008) so it is important to protect and restore riparian wetlands that trap large amounts of P. Many estuaries are N limited (Howarth & Marino, 2006; Howarth & Paerl, 2008) and tidal freshwater and brackish marshes, should be protected since they have the greatest capacity to bury and store N.
ACKNOWLEDGMENTS
The work was supported by Grants OCE-062059, OCE-1237140, and OCE-1832178 from the National Science Foundation. This is the University of Georgia Marine Institute Publication Number 1106.
ETHICS STATEMENT
The author states that the manuscript is original and has not been published elsewhere.
Open Research
DATA AVAILABILITY STATEMENT
The data that support the findings of this study are available from the corresponding author upon reasonable request.


