Integrated water resources management: A new strategy for DSS development and implementation
Abstract
Although the recent concept of Integrated Water Resources Management (IWRM) is continuously searching for modern operational approaches to be implemented in practice, the Decision Support Systems (DSSs) have been considered a major effective tool for supporting IWRM. According to the weaknesses and limitations in the current DSSs, this paper presents a new DSS development strategy based on an architecture design including higher levels of competitive advantages in system flexibility, product maintenance, and user acceptance. Instead of producing a DSS as a stand-alone product limited to real-time monitoring, the selected approach presents a design for a real-time DSS service setup with a multilayered user interface and a multimodular modeling system. The methodology has been used and implemented over the Var catchment (2800 km2) and has been validated with an operational application. The designed DSS is currently used by the local management authorities with a high level of user satisfaction with monitoring and forecast services. The obtained result underlines the promising applicability of the proposed approach for other DSSs addressing utilities.
1 INTRODUCTION
As the main challenge of the 21st century, water resources management has become an increasingly complicated issue. On one hand, affected by climate change and social development, the intrinsic complexity of water circulation has evidently increased. On another hand, raising awareness of the general public on the topics of water resources management has led to more actors being involved in the decision-making process, which brings extra difficulties to the management (Giupponi et al., 2013; Nohara et al., 2018). As a consequence, the core challenge of the current water resources management is not only to maximize the satisfaction of all stakeholders but also to share sufficient information among different participants holding various knowledge backgrounds. There is an urgent requirement expressed by the decision-makers to have an optimized approach to integrating the knowledge over diverse disciplines and information about various aspects into a unified operational framework with a persistent involvement of scientific experts, professional managers, and the general public; and a systemic consideration of all their views (Geertman & Stillwell, 2009; Giupponi, 2007; Giupponi et al., 2011; Gourbesville, 2008; Qi & Altinakar, 2013).
Different from the classical approach to managing water resources that merely services to expert users for solving specific and clearly predefined problems, the new concept of Integrated Water Resources Management (IWRM) has been conceived for equitably maximizing the satisfaction of different stakeholders without compromising the system sustainability (Global Water Partnership, 2000). Although its applications are highly case-dependent and no standard blueprint or framework has been clarified (Rahaman & Varis, 2005), one generally accepted consensus is to reach “integrated management” the massive information and the diverse possibilities in both natural and social aspects have to be handled and assessed through an efficient way among all the actors. The scientific and industrial communities have proposed several tools for supporting the decision-making process so-called Decision Support Tools or Decision Support Systems (DSSs) and implemented them in water resources management (e.g., IWRM-DSSs in Athens, Greece [Koutsoyiannis et al., 2003], the Nile basin, Africa [Georgakakos, 2007], the Ribeiras do Algarve river basin, Portugal [Maia & Schumann, 2007], and the Conchos basin, Mexico [Gastélum et al., 2009]).
The DSSs originate in the 1970s, and at that time were mainly used for solving semistructured and unstructured problems with the assistance of computerized systems (Anthony, 1965; Gorry & Scott-Morton, 1989; Simon, 1960). The development of DSS has been regarded as interdisciplinary activity crossing many disciplines such as computer science, management, information engineering, statistics, and decision theory (Eom, 1999). In parallel, with the increasing severity of water environment problems, many researchers and managers attempted to build a DSS for solving specific problems in the management of water resources (Davis et al., 1991; Guariso et al., 1986; Haastrup et al., 1998; Hashemi & Decker, 1969; Rizzoli & Young, 1997; Stansbury et al., 1991). Until the beginning of the 21st century, benefiting from the technological progress in computer science and other relevant fields, the application scope of DSS is expanded from mainly solving unstructured problems to dealing with the “wicked” problems that the ultimate questions are ambiguous or unclearly formulated (Beynon et al., 2002; McCown, 2002; Rittel & Webber, 1973). Mysiak et al. (2005) highlighted several points of dealing with the “wicked” problems in IWRM: (i) the processes of solving problems and understanding the natural are mutually concomitant; (ii) the stakeholders involved see the problems from their own perspectives and cannot easily agree on what problems to solve; (iii) either no clearly stated objectives or multiobjective in many aspects have been clarified by the end-users; and (iv) the solution could be good/bad but never be true/false.
In the last decade, many DSSs had been developed and implemented to solve the “wicked” problems in IWRM. Giupponi (2007) developed a sophisticated IWRM-DSS consisting of numerical models, geological information system (GIS) functions, and multiple criteria decision methods (MCDMs) at the catchment scale. Such DSS has been applied to many catchments in Europe to assess the water allocation (e.g., Caia catchment in Portugal, Nethan catchment in Belgium, Vela and Cavallino catchment in Italy, etc.). Van Cauwenbergh et al. (2008) built a multiobjective and -participant water resources management DSS with four predefined groups of stakeholders: (i) urban water uses, (ii) agricultural water uses, (iii) institutions, and (iv) other stakeholders. Taking advantage of effective multicriteria modeling analysis, the developed DSS was able to rank various alternatives depending on their performances in both social-economic and environmental aspects. Sedki and Ouazar (2011) applied a simulation-optimization approach for setting up a DSS to assess optimal pumping strategies in the Moroccan coastal area. Based on deterministic distributed model simulation (MODFLOW model), the DSS was able to provide an accurate presentation of the current situations and future phenomena. Nevertheless, the risks of DSS failing and the need for further improvement are kept being reported. The weaknesses and limitations in the current strategy for DSS development and implementation can be summarized in three aspects.
First, in the user aspect, the current DSS strategy lacks an effective approach to improving the DSS acceptance from the end-users. Lu et al. (2001) reported the importance of users' cognitive styles on the DSS implementation that the “sensation-style” and the “thinking-style” people often show a higher willingness of using DSS while the “intuitive-style” and the “feeling-style” people feel unnatural and uncomfortable to take it. Alavi and Joachimsthaler (1992) suggested that inviting the users to participate in the early phases of DSS development and training them for using DSS after the development is completed could be helpful in reducing the impacts of users' cognitive styles and personalities on the DSS acceptance. However, implementing those measures faces two obstacles: (i) the predefined future users are often unable to clearly specify their requirements at the early stage of DSS development; and (ii) the DSS developers may not continually be in touch with the end-users after the development completed, the training of using certain DSS could be difficult, costly and time-consuming.
The second weakness exists in the design aspect: the flexibility and sustainability of the DSS need to be emphasized and improved in the design of its architecture. On one hand, most of the recent DSS applications produce the DSS as stand-alone software with a standard and fixed user interface for all end-users, which is inconvenient for the nonexpert users or the users who are merely interested to check the results of specific DSS functions. On another hand, despite most of the DSS products allowing their clients to upload new data and modify the DSS criteria and indicators depending on their own considerations, few of the DSSs give permission to the end-users for updating the existing components or adding extra functionalities following with the progress of new technologies and changes of users' requirements. This kind of limitation significantly reduces the DSS operational life length.
Third, most of IWRM-DSSs are set up based on historical data and applied for predicting the natural responses to certain decisions after a longer period. Few of the DSSs are developed and implemented for supporting short-term or real-time decision-making processes. However, due to the rapid changes in natural and social conditions, the contributions of real-time monitoring and forecasting to IWRM become more important (Gourbesville et al., 2018). In recent years, many research of IWRM have discussed the importance and necessity of integrating DSS with a real-time monitoring system. Nevertheless, an efficient way of implementing such integration is still in explored.
Recognizing challenges and discrepancies in the current DSS applications, this research aimed to explore an operational approach to satisfying multiaspect requirements from IWRM. The paper presents: (i) a new strategy for DSS development and implementation, and (ii) a new architecture design for supporting both the individual and the collaborative decision-making process in real-time IWRM. The case study on the Var catchment (2800 km2) is described in detail for systematically discussing and evaluating the applicability and performance of the proposed DSS approach. The content presented in this paper will not only contribute to the DSS development but also help the future IWRM implementation.
2 METHOD
According to the Water Framework Directive (WFD) (European Communities, 2003), the “active involvement” of public participation is not compulsory but encouraged in the implementation of relevant measures for dealing with IWRM problems. IWRM-DSSs are applied for helping the decision-makers to find optimized reactions to changes in natural or social conditions. The users' actions can be concluded into three phases: (i) to know the current situation, (ii) to forecast the next actions, and (iii) to predict the future impacts.
Most of the IWRM-DSSs are mainly focusing on satisfying the first and third phases of the users' requirements through real-time measurements or some long-term or scenario-based modeling simulations. Few of the DSS applications are developed to cover all three phases' actions in the decision-making processes. Consequently, the work presented in this paper is mainly to explore a new strategy for DSS development and to implement based on the architecture design of real-time online DSS services.
2.1 DSS development and implementation strategy
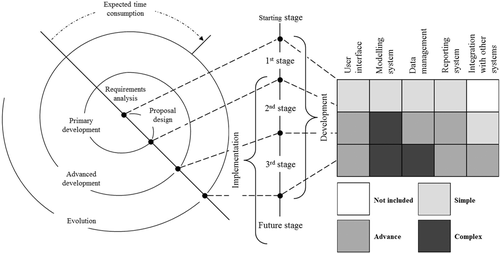
In the DSS applications, although the composition of the initial sponsors/clients is often relatively simple, the requirements and the end-users are gradually increasing following the system development. Under this circumstance, a new strategy for DSS development and implementation is conceived with five stages (Figure 1).
2.1.1 Starting stage
This stage is considered the preparation of the DSS development and implementation. With less technological work, the emphasis is on the “requirements analysis” including not only the analysis of users' demands but also the discussion about the requirements for developing the DSS components. However, the DSS end-users are often unable to clearly specify all of their requirements at the early stage, discussions between users and developers should be continuing during the whole process of DSS development and implementation. Furthermore, the DSS developers also need to consider some potential requirements from the users in their layout of the DSS components and functions.
2.1.2 First stage
The first stage of the DSS development process is referred to as the “proposal design.” According to the users' requirements, the developers will propose many optional approaches to solving user-defined problems. Setting up a draught version of the DSS consisting of several components with basic functions and showing this “mock-up version” of the DSS to the users is the core work of this stage to (i) help the users specify their requirements and (ii) collect feedback for guiding the work of the next stage. Moreover, in the first version of the DSS, the developers are recommended to attempt to apply more new technologies to have a general view of both data and model limitations.
2.1.3 Second stage
At the beginning of this stage, although most of the DSS components have not been fully developed yet, through several first-stage-developed functions (e.g., model simulations), the DSS is at least able to satisfy parts of users' requirements. Thus, the implementation process begins from this stage and progresses in parallel with DSS development. Although the end product is still in discussion among the participants involved in the project, several general consensuses can be concluded after a series of meetings and used as main references to guide the DSS development. The second stage can be considered as the “primary development” where all DSS components and functions should be evidently progressed. Some recommendations related to DSS development are listed as follows: (i) for the user interface, the developers need to take into account both the users' requirements and behaviors, one option is to set up a multilayer user interface for the various user groups; (ii) for the modeling system, continually improving the models developed in the previous stage is encouraged and the decision criteria (e.g., indicators) should be defined following the user preferences to avoid misunderstanding between DSS and its end-users; (iii) the feasibility of integrating the DSS with an existing real-time monitoring system needs to be discussed in this stage; and (iv) the user satisfaction and the optimization level of the DSS functions could be defined as two main indicators to determine the completion level of this stage.
2.1.4 Third stage
At the end of the second stage, most of the DSS components should be fully developed while the DSS functions are able to satisfy the major requirements demanded by the users. Nevertheless, the DSS still needs to be continuously updated with new feedback. Considering the DSS sustainability, the optimization of data management and the improvement of links between DSS and other systems (e.g., real-time monitoring system) will be defined as the emphasis of this stage. On one hand, massive information and data collected and produced by the DSS need to be well-managed. Having an independent database for the DSS could be one of the operational solutions. On another hand, both the connections between all DSS components and the links between DSS and other systems should be built and enhanced to ensure efficient data transmission under the entire system framework.
2.1.5 Future stage
After completing three stages in the development process, the DSS is able to support the decision-making process. Nevertheless, regarding the variation of natural conditions, the change of social framework, and the progress of new technologies, the DSS has a higher possibility to be updated with future conditions. Thus, the last stage could be named “Evolution.” To improve the DSS sustainability and to extend its operational life length as long as possible, the following measures are recommended: (i) the design of the DSS architecture needs to have a high level of flexibility such as modular- or layers-structure; (ii) extra room need to be reserved in the DSS for the future update; and (iii) from the management point of view, the DSS sponsor need to think about keeping some of the developers to be in charge of the future update and training activities.
2.2 Architecture design of the DSS
A new architecture design of real-time online DSS with high levels of functionality and sustainability is designed including four main components, respectively, presented as follows (Figure 2).
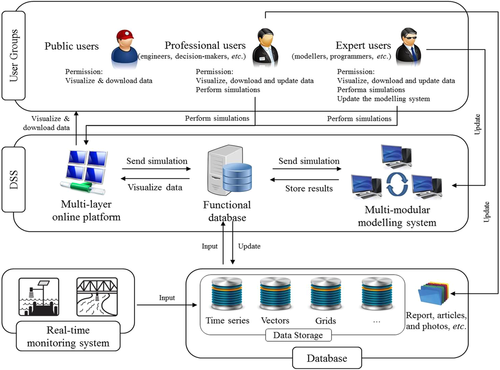
The link between the real-time monitoring system and the DSS data management (Database) is the cornerstone of the proposed DSS. The database is devised to play as the main information recipient and manager in the DSS in charge of processing, analyzing, and saving all data and materials. Compared to the data collected from other sources (e.g., reports, articles, and photos, etc.), the records and forecasts from the real-time monitoring system are the core inputs to launch and run the DSS and need to be well organized. One example of data storage is to implement classification storage based on the data types (e.g., time series, vectors, grids, etc.).
The DSS is designed to consist of three main components: A multimodular modeling system, a functional database, and a multilayer online platform. Obviously, each component plays a different role in the DSS. To ensure the efficiency of DSS functions, the data handled by the models integrated into the multimodular system are defined within different formats depending on the model preference. A functional database is inserted at the center of the DSS as the “information transfer station” responsible for converting the external inputs (e.g., from the user interface) into the module-accepted formats. Different from the independent database, the functional database is designed as a temporary data manager. All user-requested information and the most recent real-time modeling results are temporarily saved in such database waiting for further transmissions (e.g., to show on the user interface or to store in the independent database).
Following the DSS development and implementation strategy, the design of the modeling system is emphasized to follow the multimodular structure (see Section 4.2.2). Depending on the simulation objectives, all the models applied in the DSS need to be packaged into several modules controlled by a unified engine (described in Section 5.1).
A multilayer user interface is proposed in this DSS design. According to the users' requirements, the information collected and produced by the DSS will be generalized and reclassified through the functional database and further displayed on the relevant layers. The DSS is designed to give different access permissions to the users to visit their interesting information.
On top of the designed architecture are the predefined DSS user groups which are classified based on the users' requirements and their knowledge backgrounds: (i) Expert users: The expert users are mostly from the scientific field, and are fully involved in the DSS development process; (ii) Professional users: The professional users are from the management field, and who are the main end-users; and (iii) Public users: The public users could be any general public, and who lack relevant professional knowledge but have interests on the topics of IWRM.
3 CONTEXT OF AQUAVAR DSS
3.1 Background
The Var catchment (2800 km2) (Figure 3) is the largest catchment in the French Mediterranean region characterized by conspicuous terrain variation (0–3000 m above sea level). More than 90% of the streams in this catchment are classified as mountain streams with steep river slopes and “V” shaped cross-sections. The Var river is the longest river and flows nearly 123 km to the Mediterranean Sea. The catchment climate follows the Mediterranean climate with hot-dry summer and cool-wet winter. Two flood seasons have been observed during one hydrological year caused by different reasons: The winter flood is mainly due to the high-intensity rainfall over most parts of the catchment, while the combined effects of heavy rainfall and snow-melted flow often lead to the spring floods occurring in this basin.
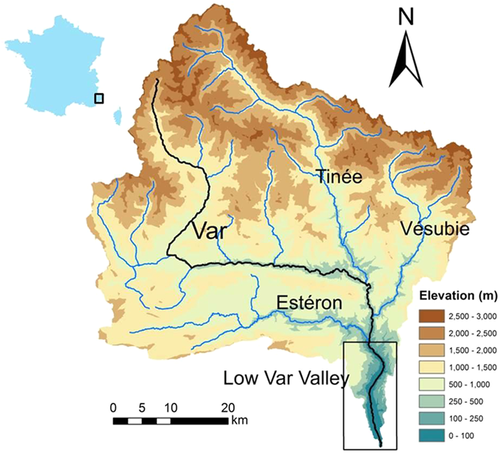
The downstream part of the Var catchment (the last 22 km of the Var river), so-called the Low Var Valley, connects the mountainous area to the Mediterranean Sea. As a result of sediment deposition, the Low Var Valley consists of complex geological structures down to 700 m below sea level and contains abundant groundwater resources in its unconfined aquifers (Du et al., 2018; Potot et al., 2012). The groundwater resources in the valley show high quality and are currently used for supporting most social-economic activities in the cities in this region (Guglielmi & Mudry, 1996). The annual groundwater extraction recorded at the public pumping stations is nearly 50 million m3.
Nice is the fifth biggest city in France located at the outlet of the Var catchment. Its urban development is currently taking place along the Var floodplain. The challenges in the regional/city water resources management show a higher level of complexity including security issues of water supply, inundation risks, and environment management under the perspective of climate change, and so on. Since the 1990s, local managers and decision-makers had recognized and expressed the need for a functional DSS for managing all relevant information and further supporting their decision-making process. After establishing a real-time monitoring system in the Var catchment, a new approach is engaged with the project named AquaVar aims to develop the first real-time DSS to address a wide diversity of management issues from water resources to emergency situations (Gourbesville et al., 2018).
3.2 Requirements analysis
The project of AquaVar is under the framework of tripartite-cooperation including metropolis (Metropole Nice Côte d'Azur and Conseil Départemental des Alpes-Maritimes), local water service operator (Agence de l'Eau Rhône Mediterranée), and research institutes (Polytech lab in Université Nice Sophia-Antipolis). Following the proposed DSS strategy, the “requirements analysis” is first implemented for helping the developers to have a comprehensive view of the DSS targets.
3.2.1 Main requirements
The local municipalities and water agencies have first addressed many major issues faced in their current management as the main targets of the AquaVar DSS: (i) Competition among water uses and increases in the water demand; (ii) growing vulnerability regarding floods and droughts; (iii) major droughts associated with high water consumption period (summer) and repeated over several consecutive years; (iv) vulnerability of water resources management regarding accidental pollutions; and (v) need of anticipating different situations and establishing a strategy for a sustainable drinking water supply to users.
Obviously, those targets are all defined by the consortium of stakeholders. However, despite their trying to describe and explain their targets and perspectives to the DSS developers in as detailed as they could, due to the knowledge gap, those targets cannot be directly understood by the developers as a clear guideline for developing the DSS. After a series of meetings and discussions, those general objectives were broken down into many more specific goals for the DSS: (i) To integrate the existing sensors into the real-time monitoring system of the DSS under the framework of the government information system; (ii) to set up a real-time modeling system covered the entire Var catchment to (a) improve the understanding of hydrogeological characteristics (b) optimize the current pumping protocols; (c) forecast the floods and droughts; (d) monitor and simulate the saltwater intrusion from the Mediterranean Sea; (e) predict the accident pollutant impacts on the water resources in the valley; (f) analysis the influences of geothermal exploitation; and (g) assess the new urban development in the catchment.
3.2.2 Roles of different actors
-
The expert users are mostly from the research institutes and partly from the technical departments of the municipality or water agencies. They are mainly in charge of DSS development and providing relevant technological support. Their requirements to the DSS concentrate on technological aspects such as validating the hypotheses or testing new techniques. At the same, they are responsible for developing, maintaining, and updating the DSS.
-
The professional users mostly come from the government offices or the water service operators who play as project managers, data supporters, and end-users in the DSS development and implementation. They are responsible for supervising not only the development process but also the project's progress by giving comments and feedback at the beginning and the end of each stage. At the same time, they are in charge of providing financial and data support to the developers. Moreover, professional users will receive the rights to not only access all DSS functions but also to control the access permissions of the public users which cover a wide scope of DSS future users.
-
The public users are not involved in DSS development. They are merely allowed to view and download parts of the information produced by the DSS, no permissions to access the DSS functions are given unless they request it from professional users.
3.2.3 Challenges in the DSS development and implementation
As requested by the end-users, one of the top priorities of AquaVar DSS is to produce accurate real-time simulation and forecast over the entire Var catchment, especially at the Low Var Valley. First, due to the lack of management, the data directly collected from the field needs an effective approach to be treated and reorganized. Moreover, to reach the tasks of having accurate in-time simulation, on one hand, the data channels linked to different DSS components need to be optimized to reduce the time-consumption of information transmission; on another hand, the analytic performance needs to be enhanced to balance the simulation efficiency and accuracy. Furthermore, the missing data problems could also obstruct the DSS development and implementation. For instance, most of the field surveys in the Var catchment have mainly focused on the Low Var Valley, the hydrogeological information at the upper and middle parts of the catchment is still quite limited which requires many hypotheses to overcome the data obstacles during the modeling setup process. In addition, to integrate the DSS into the existing government information framework, the main challenge is to have a general consensus on the standard data formats transmitted among the two systems. As the government system is already set up, the DSS have to have a concession.
4 AQUAVAR DSS DEVELOPMENT
4.1 Global framework
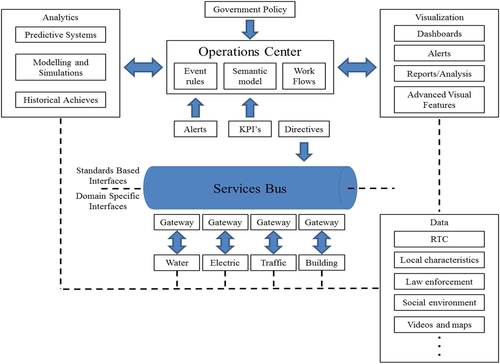
The selected framework for the AquaVar DSS (Figure 4) is based on a platform elaborated over a service bus dedicated to collecting and integrating all field information related to various processes including water services and natural risks (IBM, 2012). This DSS framework identifies the roles of relevant services in urban management and can be used for other DSS-addressing utilities. The information transmitted among different parts is formalized through various standard tools such as Key Performance Indicators (KPIs), predefined alerts, and directives. The AquaVar DSS plays as the “Analytics,” which starts from basic statistical tools to complicated deterministic numerical models. The workflow starts from the questions defined in the “Operations Center.” Based on the data collected through the service bus, the “Analytics” part abstracts the emphases, makes the analysis, and sends the answers to questions back to the “Operation Center.” The “Visualization” is in charge of sharing relevant information among different stakeholders while collecting feedback to update the system. Many new technologies such as the GIS interface or synthetic virtual dashboard can be applied in the “Visualization” to let the professional information be easy to understand. Nowadays, this kind of DSS architecture has been shared and appeared as a consensus solution among various municipalities (Gourbesville et al., 2018).
4.2 Multimodular modeling system
4.2.1 Model selection
The modeling simulations integrated into the AqauVar DSS are responsible to take into account various constraints and variables for providing an accurate representation of the catchment behaviors. Depending on the considerations of randomness, the models used for simulating hydrological processes can be generally classified into two categories: Stochastic models and deterministic models (Chow et al., 1988; Jajarmizad et al., 2012; Refsgaard, 1997). Stochastic models are commonly applied for estimating the probabilistic descriptions of unknown elements based on historical data. However, when the referenced data are insufficient or the probabilistic rules are not clear enough, such models are often replaced by deterministic models. Moreover, according to the level of spatial discretization, the deterministic models can be further reclassified into two classes: Lumped models and distributed models. Despite the cost of having a deterministic distributed model being relatively higher (e.g., more data requirements and higher time consumption), its simulation shows evident advantages of producing an accurate physical representation of the water-cycle system at any place of the simulated domain. In recent years, with the progress of Remote Sensing (RS) and the increase in computer facilities, the challenges in the deterministic distributed model implementation are gradually reduced. Integrated considering the users' requirements, the deterministic distributed model is determined as the premier choice in the AquaVar DSS development.
4.2.2 Roles of different modules
For the Var catchment, a single deterministic model cannot fully satisfy the overall requirements of the decision-makers. Therefore, it is necessary to set up a multimodular modeling system consisting of several deterministic distributed models to catch all relevant information about the catchment hydrological characteristics and provide accurate diagnostics requested by the DSS users. To optimize the workflow and data transmission, the roles of the different modules need to be clarified. The modeling system of AquaVar DSS was constructed with five modules consisting of three deterministic distributed models (hydrology, surface hydraulic, and groundwater) (Figure 5).
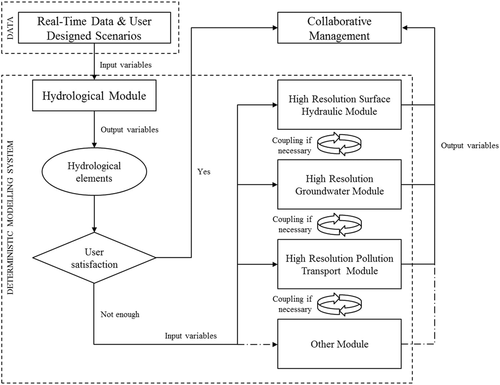
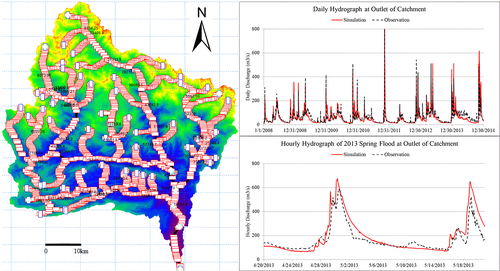
The hydrological module was designed as the first module to run in the system simulation. It contained many modeling functions related to data management and hydrological simulations. The core function in this module was the deterministic distributed hydrological model simulation: MIKE SHE (DHI, 2017a) over the whole Var catchment. Considering the catchment flow mechanism (concentration-time less than 1 day), the hydrological simulation was first set up with both daily and hourly time intervals from 2008 to 2014. The data applied for setting up the hydrological model were collected from many sources including Metropole Nice Côte d'Azur, Agence de l'Eau Rhône Mediterranée, and Météo France. Through a series of data treatments and interpolations, the raw data were converted into the model-accepted formats and inputted to the model to run the simulations. The results of this module contained all relevant hydrological elements (e.g., rainfall, temperature, evapotranspiration, infiltration, surface water level, flow discharges, etc.) at each computation cell in the model domain (Figure 6). Those outputs can be either directly used for supporting a part of the decision-making process or further be applied as the input variables for other modules to have more specific simulations in the user-targeted area.
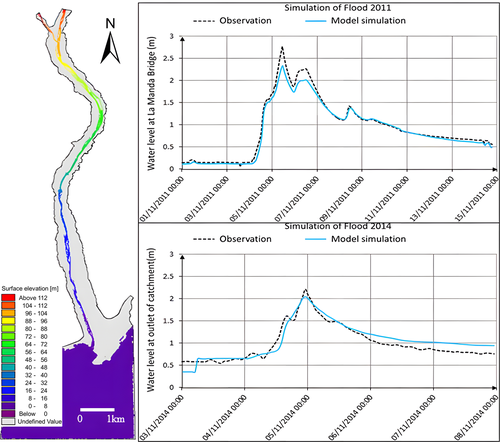
In the “Requirements analysis,” the actors had predefined the Low Var Valley as one of the sensitive areas in the Var catchment. Consequently, two high-resolution deterministic distributed models (MIKE 21FM and FeFlow) had been set up at the Low Var Valley and integrated into three different modules for more accurate simulations. To properly represent the river morphology and the hydraulic structures (e.g., weirs) in the river bed, the MIKE 21FM model (DHI, 2017b) was set up with high-resolution (10 m) flexible mesh over the last 22 km of the Var River. Many historical flood and drought events (e.g., flood in 1994, 2011, 2014, and 2015 and drought in 2012) were selected to validate the hypotheses and to optimize the simulation efficiency (Figure 7). The simulations of MIKE 21FM were run within a smaller time step (2 s) to avoid the numerical instabilities. The model outputs were exported within the hourly time interval for catching the flow fluctuation during the flood events.
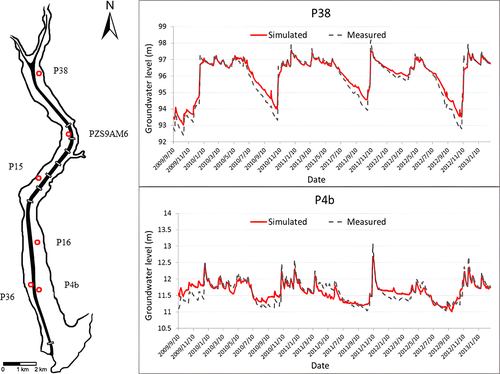
As the local water service operator asked for a detailed presentation of the groundwater fluctuation at the Low Var Valley, the high-resolution model of FeFlow (DHI, 2017c) (25 m resolution of the river bed, 50 m resolution of the floodplain) was set up with six layers from the land surface down to 700 m below the sea level. Different from the hydrology and surface hydraulic models, the FeFlow domain followed the geological boundary, which covered a wider area of the valley. Based on the data obtained from daily groundwater monitoring at different automatic piezometers in the valley, the model simulations were validated within the daily time step from September 2009 to February 2013 including two serious floods, respectively, occurred in winter and spring (November 2011 and April 2013) and one drought event in summer 2012 (Figure 8).
The high-resolution models of MIKE 21FM and FeFlow had been integrated into the AquaVar modeling system as one of the core functions in both surface hydraulic and groundwater modules. Moreover, to assess the complex flow exchange between rivers and their shallow aquifers, the coupling process between those two models was also developed for providing a three-dimensional (3D) comprehensive view of the physical processes of the water movements at the Low Var Valley. In consequence, both two models were also applied as main components of the pollution module in the system to predict the impacts of accident pollution on the groundwater resources in the valley. Considering the future update, the “other module” was designed for adding extra modeling tools to the system.
5 AQUAVAR DSS IMPLEMENTATION
5.1 AquaVar engine
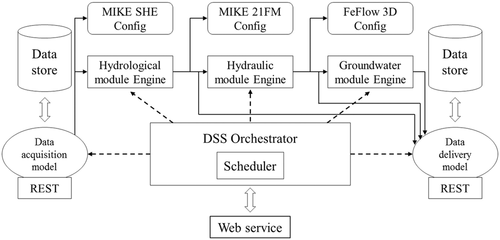
After all the modeling simulations were set up and validated against the observations, the system was continuously developed for being an online service, dealing with either the real-time information collected from the monitoring system or the data uploaded by the end users. One innovative approach of the AquaVar DSS is that the DSS contains a modular engine for automating the management of the modular simulation services by coordinating the data exchange through their interactions (Figure 9).
-
Simulation engines: A simulation engine is a wrapper around specific simulation software. The wrapper makes it easy to add a new simulation engine with no change in the architecture;
-
Configuration modules: Each simulation engine relies on a corresponding configuration module to automatically set up the simulation parameters. The configuration module is also able to perform data format conversion when necessary;
-
Scheduler: The scheduler allows running automatically the simulation engines in the background at regular intervals;
-
Data acquisition module: this module fetches the input data from a data store which itself collects live data from sensors. It implements a common interface that allows easy connection to new data sources;
-
Data delivery module: This module pushes the result files from simulation engines into a database. Similar to the previous one, this module implements a common interface that allows delivering the results in different ways (database, plain file system, etc.);
-
Orchestrator: The orchestrator manages all the other modules and can be parametrized by the user through a web-based user interface. The user can set all the simulation parameters including the time step for the simulation engines. The administrator is also able to stop or restart a simulation engine.
The data acquisition and data delivery modules as well as the orchestrator communicate with external applications through Representational State Transfer (RESTful) interfaces. RESTful Application Program Interfaces (APIs) rely on the HTTP protocol and provide an architecture style suitable for networked applications. This architecture allows transparently accessing the DSS engine through a web-based user interface or alternatively as a web service.
5.2 Work process of AquaVar engine
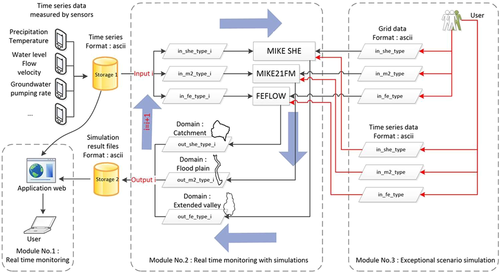
The main work process of the AquaVar engine (Figure 10) consisted of three modules: (i) Real-time monitoring; (ii) real-time monitoring with simulations; and (iii) exceptional scenario simulation. Those modules were, respectively, responded to the three phases of users' action in the decision-making process (see Section 2): (i) To know the current situations, (ii) to forecast the next actions, and (iii) to predict the future impacts. The first module was implemented through the integration with real-time monitoring and was mainly used for presenting current situations through web applications. In the second module, three deterministic distributed simulations, respectively, handled by MIKE SHE, MIKE 21FM, and FeFlow were running automatically in real-time to produce accurate descriptions of the current catchment behaviors and short-term forecasts for the future natural conditions (e.g., floods or droughts). The third module was open to the users to assess their design scenarios. The AquaVar engine converted the users' inputs (ASCII format) into the different model-accepted formats (e.g., .dfs0, .dfs2) and then precisely delivered them to the related modules to run the simulations.
5.3 Computational efficiency
The target performance of the AquaVar DSS is based on the possibility to provide every hour an update of the three deterministic models with a forecast of 72 h. This timeframe has been defined with the stakeholders and the AquaVar users. Obviously, running the three models requests important computational resources that could ensure that each simulation can be executed in less than 1 h. To deploy the relevant architecture, several computation tests have been conducted with the three models and different setups mobilizing central processing unit (CPU) and GPU servers with various performances. The obtained results are summarized in the following paragraphs.
- ●
Hydrological model—MIKE SHE model. The hydrological model is using classical CPU resources as the source code does not have any parallel version. The simulation is covering a period of 7 days with 4 days of past and recorded situations and 3 days for the forecasts
- ●
Hydraulic model—MIKE 21 FM model. The hydraulic model built with the MIKE 21 FM code can be used with GPU resources as the code is allowing parallel computing. As for the hydrological model, the simulation time is covering a period of 7 days with 4 days of past and recorded situations 3 days for the forecasts. To analyze the GPU performances, three different hydraulic models have been created with different resolutions and types of elements. Model 1 is the original model combining triangular elements for the floodplain and quadrangular elements mainly for the riverbed. Model 2 derivates from model 1 and has been slightly reduced with some elements that may create numerical instabilities. Model 3 is composed only of triangular elements with a constant surface of 100 m2. The objective of this model was to assess both the added value of higher resolution on the quality of results and the impact of the computation time.
- ●
Hydrogeologic model—FEFLOW model. The hydrogeologic model with the FEFLOW code is using CPU resources but as the number of timesteps is limited the idea was to use the same computation server as for the hydraulic model. As for the two previous models, the simulation time is covering a period of 7 days with 4 days of past and recorded situations and 3 days for the forecasts.
The results demonstrate also that the solution is highly efficient for the hydrogeologic model that can produce a full simulation in less than 30 min with the server equipped with a single GPU resource. This result can be explained by the quality of the source code of FEFLOW which has been optimized recently for computing efficiency.
The tested architecture for the model with one GPU resource allows performing the requested simulation in less than 30 min. The obtained results can be quickly converted and displayed within the web mapping services of the AquaVar system. As previously, the technical requirements remain affordable and can be easily implemented within an operational environment. In addition, due to the limited computational effort requested, the model can be associated with the hydraulic model on the same GPU computational resource.
From both the obtained tests' results and the target performances allowing to produce a full hourly update of the forecasts for the hydrological, hydraulic, and hydrogeologic models, an operational architecture for the AquaVar DSS can be established and implemented for real-time operations.
To achieve a high level of efficiency and at the same time to offer a simple way of updating the full architecture, the solution of cloud computing should be prioritized for the computing servers hosting the three models. Due to the performances obtained with the hydrogeologic model built with FEFLOW, the choice can be to base the full system on two computing servers, one on CPU technology and one on GPU architecture. The first one hosts the hydrological model and the second welcomes the two models for hydraulic and hydrogeologic simulations. The computing servers are associated to resources hosting the GIS tools that are producing the results to be displayed within the AquaVar user interface.
5.4 Implementation of AquaVar web application
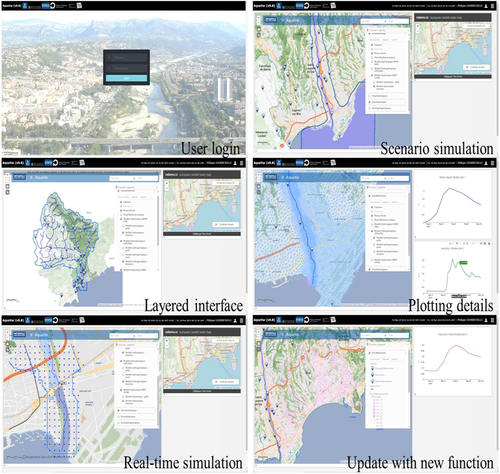
The AquaVar engine was deployed on the NCA (NICE Côte d'Azur) server and implemented as a RESTful web service able to export the model simulation results on request. This web service can be queried by various clients including our AquaVar Web interface which allows end-users to visualize the simulation results through various plotting widgets. The AquaVar web service was based on the Tomcat web container following the REST technology conventions. It is currently implemented in the Java programming language (Java 1.8). The RESTful model is widely used by NCA web services for real-time monitoring. The AquaVar Web interface was a web application hosted on a different server than the one for the AquaVar engine. This web application was based on the usual LAMP stack (Linux, Apache, MySQL, PHP) and made heavy use of Ajax technology to query the AquaVar engine for data. This web application provided the end-user with an advanced graphical interface with many plotting capabilities. The plotting facilities were based on the Plotly library. The web interface embedded a map renderer to visualize the Var catchment with various layers to render the simulation results. Some screen captures of this web interface are shown in Figure 11.
6 DISCUSSION AND CONCLUSIONS
There is a clear need for an operational approach to implementing the IWRM concepts into practice. After many years of research and development, the DSS tools have been shown to provide sound insights into the problems addressed in the IWRM. The strategy for DSS development and implementation based on the new architecture design presented in this paper can contribute toward coping with the “wicked” problems of IWRM, in particular by dealing with the weaknesses and limitations in the current DSS applications: (i) The conflicts in the integration of various disciplinary systems; (ii) the difficulties in the management of massive data; (iii) the challenges in the communication among different actors and between DDS and its end-users; and (iv) the lack of the flexibility in the DSS products for the future update and the diverse users' preferences.
The strategy for DSS development and implementation consists of five stages starting from the “Requirements analysis” until the “Evolution.” The objectives and tasks of each stage have been clearly defined and explained, which makes this strategy easy to be applied as a general guideline for developing and implementing DSS for a wide range of purposes. Moreover, in responding to the new requirements from the IWRM decision-makers, a new DSS architecture design has been also presented in this work.
The IWRM-DSS approach described in this paper has been implemented within the AquaVar project on the Var catchment located in the French Rivera for an area close to 3000 km2. Considering the high complexity of water resources management in the Var catchment and the specific requirements of the local managers, three deterministic distributed models of hydrology, surface hydraulics, and groundwater had been set up in the AquaVar DSS. The AquaVar DSS was designed with a specific focus on the Low Var Valley where the need for IWRM is the strongest. The AquaVar DSS engine was based on the use of high spatial resolution and had automatically run properties in real-time to provide a 3D comprehensive view of the physical hydrogeological processes over the whole catchment area, especially at the Low Var Valley.
Following the proposed DSS strategy, the AquaVar project is currently in the third stage. The main functions of the DSS have been almost fully developed and realized by the modules integrated into the DSS modeling system. The professional users from Metropole Nice Côte d'Azur and Agence de l'Eau Rhône Mediterranée have expressed a high level of satisfaction and acceptance of those developed DSS functions.
Highlighted points and innovative approaches of the DSS implementation in the AquaVar project are (i) setting up a multipartite-cooperation in the project management with clear identification of the users' rights and duties; (ii) using of standard modeling software as noninteractive services; and (iii) integrating with the existed hypervision platform already used for real-time monitoring in the city management. As a result, an overcoming of the classical (i–iii) weaknesses listed in the first paragraph of this section is achieved.
However, some feedback and comments from all three user groups have also pointed out several limitations in the current version of AquaVar DSS:
(i) The data management in the AquaVar DSS still needs to be continuously optimized.
(ii) The efficiency of running the model simulations and of displaying the model results on the web-GIS interface should be kept improving.
As a cold analysis, it is remarkable that these types of points identified by stakeholders as remaining for improvements can be categorized as technical and technological gaps to be addressed. Indeed, thanks to the developed DSS strategy, the implementation of these evolutions/improvements (i) perfectly falls within the design DSS development and implementation strategy in the so-called “Future stage” and (ii) thanks to the progress of the past Stages 1–3, implementation of correction/evolutions in the future stage lead technical/technological upgrade without involving any structural changes in the DSS, avoiding then importance rethinking or reorganization in the DSS.
The experience of the AquaVar project supports an optimistic view that the proposed strategy for DSS development and implementation and architecture design can be applied as an operational approach for IWRM. The obtained results demonstrate both the efficiency of the approach and the interests from the management point of view. Moreover, the DSS approach described in this paper shows promising applicability consideration for other DSSs addressing utilities (Tables 1–5).
| Number of cells | Start date End date |
Number of cores | Number of vCPUs | RAM (Go) | Number of threads | Simulation time (min) | CPU usage (%) |
|---|---|---|---|---|---|---|---|
| 560,000 | 01/11/2011 8:00 08/11/2011 8:00 |
19 | 76 | 304 | 76 | 57 | 100 |
- Abbreviation: CPU, central processing unit.
| Model | Type of elements | Number of nodes | Number of elements | Start date End date |
Time steps | Number of time steps |
|---|---|---|---|---|---|---|
| 1 | Triangular + quadrangular | 197,549 | 325,437 | 01/11/2011 8:00 08/11/2011 8:00 |
2 s | 300,600 |
| 2 | Triangular + quadrangular | 197,531 | 325,401 | |||
| 3 | Triangular only | 437,738 | 869,554 |
- Abbreviation: GPU, graphics processing unit.
| Model | Number of cores | Number of vCPUs | Type of GPU | Number of GPUs | Number of subdomains | RAM (Go) | Number of threads | Simulation time (min) | GPU usage (%) |
|---|---|---|---|---|---|---|---|---|---|
| 1 | 16 | 32 | NVIDIA V100 | 1 | 1 | 256 | 32 | 68 | 47 |
| 4 | 4 | 50 | 32 | ||||||
| 2 | 1 | 1 | 77 | 50 | |||||
| 4 | 4 | 51 | 35 | ||||||
| 3 | 1 | 1 | 765 | 71 | |||||
| 4 | 4 | 478 | 41 |
- Abbreviations: GPU, graphics processing unit; RAM, random access memory; vCPU, virtual central processing unit.
| Model | Type of elements | Number of nodes | Number of elements | Start date End date |
Time steps | Number of time steps |
|---|---|---|---|---|---|---|
| 1 | Triangular | 198,954 | 392,161 | 01/11/2011 8:00 08/11/2011 8:00 |
360 s | 1670 |
| Model | Number of cores | Number of vCPUs | Type of GPU | Number of GPU | Number of subdomains | RAM (Go) | Number of threads | Simulation time (min) | CPU usage (%) |
|---|---|---|---|---|---|---|---|---|---|
| 1 | 16 | 32 | NVIDIA V100 | 1 | 1 | 256 | 32 | 27 | 22 |
- Abbreviations: CPU, central processing unit; GPU, graphics processing unit; RAM, random access memory; vCPU, virtual central processing unit.
ACKNOWLEDGMENTS
This research is currently developed within the AquaVar project with the support of Metropole Nice Côte d'Azur, Agence de l'Eau Rhône Mediterranée, University of Nice Sophia-Antipolis, Conseil Départemental des Alpes-Maritimes and Meteo France. The work benefited from the data provided by the Metropole Nice Côte d'Azur, Conseil Départemental des Alpes-Maritimes, Meteo France, and H2EA. Part of this research is funded by the National Key Research Program (2019YFC1510603) and the “Five talents” Plan of the China Insititute of Water Resource and Hydropower Research (WH0145B062022).
ETHICS STATEMENT
None declared.
Open Research
DATA AVAILABILITY STATEMENT
Research data are not shared.


