Sirolimus- and cyclosporine-loaded nanostructured lipid carriers: Development, characterization, and in vitro evaluation in T-cell profiles of patients with a history of recurrent pregnancy loss
Abstract
Purpose
The authors developed nanostructured lipid carriers (NLCs) loaded with sirolimus (SRL) and cyclosporine (CsA) to improve their therapeutic efficacy in recurrent pregnancy loss (RPL) patients.
Methods
Mono-delivery and co-delivery of SRL and CsA by NLCs (S-NLCs, C-NLCs, and S-C-NLCs) were developed. The MTT assay was used to study the optimum dose of formulations. PCR, Western blotting, and ELISA were also conducted.
Results
Well-designed nanodrugs with a suitable size, zeta potential, desirable encapsulation efficiency drug loading, and cellular uptake confirmed optimum formulations. Based on cell viability, the amounts of SRL and CsA could be reduced greatly due to the co-delivery by NLCs. Following S-NLCs and C-NLCs interventions in T cells of patients with RPL and immune abnormality, a significant difference was observed in transcription factors and cytokine levels of Th1, Th17, and Tregs compared with healthy samples. Thus, a higher level of pro-inflammatory cytokines (IFN-γ, TNF-α, IL-17, and IL-21) and their regulators (T-bet and RORγt), as well as a lower level of an anti-inflammatory cytokine (IL-10) and its regulatory (Foxp3), were observed. However, no significant difference was found following the S-C-NLCs intervention.
Conclusions
S-C-NLCs effectively balance the immune responses in peripheral T cells in RPL patients to induce maternal immune tolerance.
1 INTRODUCTION
Recurrent pregnancy loss (RPL) is a reproduction-related complication affected by ~2.5% of women trying to conceive. It is defined as an incidence of two or more clinically recognized pregnancy failures before 20–24 weeks of gestation.1 Among several causes identified for RPL (such as infectious, uterine anatomical anomalies, genetic, endocrine disorders, and thrombophilia factors), there is an undeniable role for maternal immunologic abnormalities.2, 3 As the fetus is a semi-allograft to the maternal host, the regulation of the maternal immune response (particularly a balance between the subsets of T cells, such as T helper type 1 [Th1], Th2, Th17, and regulatory T cells [Tregs]) before and after embryo implantation is essential in creating a favorable environment for pregnancy.1, 4 Any abnormalities in the regulation of the maternal immune system are associated with poor pregnancy outcomes and may account for immunological attacks on the fetus and lead to reproductive failures, such as RPL.5, 6 In this regard, the critical role of immune tolerance has led to decades of investigation into immune-associated causes and treatment targets for RPL.1 Several therapeutic modalities are available to regulate T-cell activations at the maternal-fetal interface in RPL patients, including lymphocytes therapy, intravenous immunoglobulin (IVIG) therapy, and immunosuppressive drug therapy (such as sirolimus [SRL] and cyclosporine [CsA]). However, there is still no safe and effective treatment to protect the fetus against immune attacks.7, 8 SRL and CsA (as compounds with hydrophobic characteristics due to their lower solubility in the blood storm) are less available to T cells. Furthermore, due to insufficient evidence of their safety and classification as category C,9-11 they should be used with caution in pregnant women. In this context, the application of nanodrug delivery systems could be effective in increasing their therapeutic efficacy as immunosuppressive agents and avoiding or decreasing their toxicity effects.12 Nanostructured lipid carriers (NLCs), as a new generation of lipid-based drug delivery systems, have generally been studied for a variety of therapeutic applications based on their safety and biocompatibility. Enhancing the encapsulation efficiency (EE) of hydrophilic and hydrophobic drugs, improving bioavailability, controlling their release, keeping them from degradation in the body, and having lower toxicity for systemic exposure are the important properties of NLCs-based formulations.13 Because of these important properties, they are now used as drug carriers in the management of malignancies, inflammatory diseases, central nervous system diseases, and bacterial infections.13
In this study, for the first time, we developed and optimized nanolipid carriers loaded with SRL and CsA to evaluate the in vitro effects of the prepared formulations on peripheral Th1, Th2, Th17, and Tregs in RPL patients compared with healthy pregnant women.
2 METHODS
2.1 Preparation of drug-loaded formulations
SRL- and CsA-loaded NLC (S-C-NLC) formulation dispersions were performed by the hot homogenization method. First of all, SRL and CsA were mixed and dissolved in DMSO. After adding melted solid lipid and liquid lipid (Precirol and Miglyol, respectively) to each mixture, they were homogenized at 10 000 rpm for 1 min. Then, the aqueous surfactant solution (Poloxamer 407) was used at the same temperature as a melted lipid phase and slowly added to the lipid phases under 23 000 rpm homogenization speed for 20 min (Silent Crusher M, Heidolph, Nuremberg, Germany). Next, prepared formulations were left in a fixed place to cool down. Drug-free NLCs, SRL mono-delivery NLCs (S-NLCs), and CsA mono-delivery NLCs (C-NLCs) were also prepared using the same method with S-C-NLCs.
2.2 Size, zeta potential, polydispersity index, and morphology
The size, zeta potential, and polydispersity index (PDI) of prepared NLCs were evaluated by a dynamic light scattering technique using particle size analysis (Malvern Instruments Ltd., Malvern, UK) at room temperature. All samples were diluted 10 times with purified water. A scanning electron microscope (SEM) was also used to study the morphology of the prepared NLCs (TEscan, VEGA II XMU, Czech Republic).
2.3 EE and drug loading
2.4 Study population
Twenty pregnant women (RPL patients) were enrolled in this study. They had a history of two or more consecutive miscarriages and were referred to Valiasr Hospital, Tabriz, Iran, from May to November 2020. Informed consent was obtained from all participants prior to their participation in this study. Infections, endocrine/anatomical disorders, and genetic abnormalities were regarded as the exclusion criteria. No participants received immunosuppressive medicines, such as steroids or anything similar. As a control group, 20 healthy pregnant women without a history of reproductive disorders were included in the study. The clinical characteristics of the participants are summarized in Table 1.
| Variable | Recurrent pregnancy loss | Healthy pregnant | p Value |
|---|---|---|---|
| Number | 20 | 20 | – |
| Gestational age (year ± SD) | 32.30 ± 2.10 | 30.10 ± 6.30 | 0.9821 |
| Body mass index (kg/m2) | 27.10 ± 3.20 | 26.30 ± 2.10 | 0.9872 |
| Parity (number ± SD) | 0 | 2.30 ± 1.20 | <0.0001 |
| Number of miscarriages | 3.40 ± 1.20 | 0 | <0.0001 |
| Gravida | 0 | 0 | >0.9999 |
| Primary RPL | 12 (60%) | – | – |
| Secondary RPL | 8 (40%) | – | – |
| Gestational ages of previous miscarriages (weeks ± SD) | 10.80 ± 3.20 | – | – |
- Note: Data are presented as number or mean ± standard deviation (SD).
2.5 Separation of peripheral blood mononuclear cells
A sample of 20 mL of peripheral blood was collected from RPL patients and healthy pregnant women in heparinized tubes. Peripheral blood mononuclear cells (PBMCs) were separated from the blood sample using the Ficoll density gradient (1.077 g/mL; Biosera, UK) and by centrifugation at 450 g for 25 min.
2.6 Flow cytometry analysis
About 5 × 10⁶ of PBMCs were used to analyze the frequency of CD4+ IFN-γ+ IL-4− (Th1), CD4+ IL-4+ IFN-γ− (Th2), CD4+ IL-17+ (Th17), and CD4+ CD25+ CD127− (Tregs), besides the ratio of Th1/Th2 and Th17/Tregs. PBMCs were incubated for 5 h at 5% CO2 and 37°C in an incubator with phorbol 12-myristate 13-acetate (PMA; 10 ng/mL) and ionomycin (0.5 μM) in the presence of monensin to enhance the intracellular cytokine staining. After washing the cells, to determine the frequency of Th1 and Th2 cells, PBMCs were incubated with FITC-conjugated anti-CD4 antibodies (BD Biosciences, CA, USA) for 15 min at 4°C. Then, after washing the cells and permeabilizing them with permeabilization/fixation buffer (eBioscience), they were incubated with APC-labeled anti-IFN-γ and PE-labeled anti-human IL-4 (Becton Dickinson, San Jose, CA) for 20 min at room temperature. Moreover, for the detection of Th17 cells, the incubation was performed for 15 min at 4°C with FITC-labeled anti-human CD4 and PE-labeled anti-human IL-17. To evaluate Treg frequency, the incubation was performed for 45 min at 4°C with FITC-labeled anti-human CD4, PE-labeled anti-human CD25, and APC-conjugated anti-human CD127 (BD Biosciences, CA, USA) antibodies. Then, after washing the cells and resuspension in FACS solution (phosphate-buffered saline [PBS]), flow cytometry was performed using a FACSCalibur (BD Biosciences, CA, USA). Data were analyzed using FlowJo software (Tree Star, Ashland, OR). Lymphocytes were gated according to forward and side scatter parameters.
2.7 Magnetic-activated cell sorting
The magnetic-activated cell sorting (MACS) technique was used for the isolation of peripheral blood CD4+ T cells by the selection protocol (Miltenyi Biotec, San Diego). Isolated cells were washed with PBS (Sigma, Germany) and then cultured at 106 cells/mL in RPMI 1640 medium (Sigma–Aldrich, Chemie, Steinheim, Germany) containing 10% fetal bovine serum (FBS), 100 U/mL of penicillin, and 200 mM L-glutamine in a humidified 5% CO2 atmosphere at 37°C and incubated with an optimum dosage of S-NLCs, C-NLCs, and S-C-NLCs separately for 24 h. The supernatant of the cultured cells was used to measure the concentration of cytokines by enzyme-linked immunosorbent assay (ELISA), after which cultured T cells were subjected to real-time polymerase chain reaction (PCR) and western blotting analysis.
2.8 In vitro cellular uptake
The fluorescent agent Rhodamine B (RhoB) was used to confirm and compare the internalization of blank NLCs and drug-loaded NLCs into T cells. In vitro cellular uptake was performed by encapsulating RhoB (0.5% w/w RhoB ratio to lipid) into the NLCs. T cells from 10 healthy pregnant women were cultured in a 7-well plate and treated with RhoB-labeled NLCs for 1, 3, 6, 12, 24, and 48 h. Then, quantitative cellular uptake was measured by flow cytometry to determine the optimum time of uptake. At that time, the cellular uptake was measured after the cells were treated with RhoB-labeled S-NLCs, C-NLCs, and S-C-NLCs.
2.9 Cell viability assay
To assess the optimum dose of formulations, the MTT assay was performed. T cells of 10 healthy pregnant women were cultured in 96-well plates. After 24 h incubated with SRL, CsA solution, S-NLCs, C-NLCs, and S-C-NLCs, the supernatant of the wells was removed, and 50 μL of the MTT solution (2 mg/mL; PBS) was added; they were incubated for 4 h in 5% CO2 at 37°C. Then, insoluble formazan crystals were dissolved in 200 μL of DMSO and read by an ELISA reader at 570 nm (Stat Fax 2100, Awareness Technology, Palm City, FL).
2.10 Determination of apoptotic cells
T cells of healthy pregnant women were cultured in 7-well plates and then incubated in a medium for 24 h at 37°C (containing SRL and CsA, as well as blank NLCs, S-NLCs, C-NLCs, and S-C-NLCs). Then, the cells were washed twice in cold PBS. Next, they were resuspended in a binding buffer. Finally, the cells were stained with an annexin V/propidium iodide (PI) apoptosis detection kit (Exbio, Czech Republic) according to the manufacturer's instructions. Then, the apoptotic rate of T cells was evaluated by flow cytometry (MACS Quant 10; Miltenyi Biotech GmbH).
2.11 Real-time PCR
The development of effector Th1, Th2, Th17, and Tregs is regulated by specific transcription factors, namely T-box expressed in T cells (T-bet), GATA binding protein 3 (GATA-3), retinoic acid receptor-related orphan receptor γt (RORγt), and forkhead box P3 (Foxp3), respectively.14, 15 Any defect in their expression can be associated with pregnancy complications.16, 17 Thus, real-time PCR was conducted to measure the effect of drug-loaded NLCs on the expression level of such transcription factors. The total RNA of T cells was extracted using TRIzol Reagent (Invitrogen) according to the manufacturer's instructions. The complementary DNA (cDNA) of messenger RNAs (mRNAs) was synthesized with oligo (dT) and random hexamer primers using an M-MLV (H-) Revert Aid Reverse Transcriptase kit (Thermo Fisher, Waltham, MA). Real-time PCR was conducted using gene-specific primers and SYBR Green in a Light Cycler 2.0 Real-Time PCR System machine (Roche Applied Science, Germany). The transcription level of internal controls containing β-actin was used for the normalization of mRNA expression, respectively. The threshold cycle (Ct) value was used according to the 2−ΔΔCt formula for calculating the expression levels of mRNA in the samples. Additionally, 2% agarose gel electrophoresis was used to verify the validity of the amplification.
2.12 Western blot analysis
T-bet, GATA-3, RORγt, and Foxp3 proteins were extracted using RIPA buffer. Then they were separated on a 10% SDS-polyacrylamide gel (Sigma-Aldrich) based on their molecular weights and transferred to a polyvinylidene difluoride (PVDF) membrane (Pharmacia, France) that was blocked with TBS-Tween-20 buffer containing 3% BSA for 2 h at room temperature. After washing, overnight incubation at 4°C was done with primary antibodies (1:5000 diluted, Abcam) on the PVDF membrane. Then, after washing, incubation with the secondary horse radish conjugated antibodies (1:5000 diluted, Abcam) was performed for 2 h at room temperature. To detect immunoreactivity, a chemiluminescent substrate was used according to the manufacturer's instructions. A Western blot test was performed in triplicate.
2.13 ELISA
The levels of IFN-γ, tumor necrosis factor α (TNF-α), interleukin 4 (IL-4), IL-17, IL-21, IL-10, and tumor growth factor β (TGF-β; pg/mL) cytokines were evaluated in the supernatant of cultured T cells using an ELISA kit in duplicates according to the manufacturer's instructions (MyBioSource, San Diego, CA). Besides, the absorbance rate was assessed using a microplate ELISA reader (BP-800, Biohit, Finland) at 450 nm, and cytokine concentrations were calculated based on the standard curve.
2.14 Statistical analysis
GraphPad Prism software version 8.00 (San Diego, CA) was used to draw graphs. Statistical analyses were performed using an unpaired t test and analysis of variance (ANOVA). Descriptive statistics were presented as mean ± SD and analyzed using SPSS version 24.0 (SPSS Inc., Chicago, IL, USA). P values less than 0.05 were considered statistically significant.
3 RESULTS
3.1 Characteristics of nanoparticles
The characterization of blank NLCs, S-NLCs, C-NLCs, and S-C-NLCs is shown in Table 2. Their sizes are in the range of 19–143 nm. They showed negative surface charges with zeta potential values of −8.91 ± 6.00, −3.13 ± 4.00, −11.40 ± 7.00, and − 20.60 ± 6.00 mV, respectively (Figure S1). The PDI of NLCs was <0.5. The SRL and CsA EEs of NLCs were about 95%, and their DLs were about 9.5%. Besides, the morphological characteristics of NLCs showed a spherical shape without any aggregation at the nanoscale (Figure 1).
| Formulation | Blank NLCs | S-NLCs | C-NLCs | S-C-NLCs |
|---|---|---|---|---|
| Size (nm) | 19.39 ± 6.00 | 143.00 ± 3.00 | 34.72 ± 1.00 | 44.46 ± 1.00 |
| Zeta (mV) | −8.91 ± 6.00 | −3.13 ± 4.00 | −11.40 ± 7.00 | −20.60 ± 6.00 |
| PDI | 0.41 ± 0.01 | 0.31 ± 0.04 | 0.23 ± 0.02 | 0.47 ± 0.02 |
| EE of SRL (%) | N.A | 99.83% | N.A | 98.41% |
| EE of CsA (%) | N.A | N.A | 95.65% | 96.83% |
| DL of SRL (%) | N.A | 9.98% | N.A | 9.84% |
| DL of CsA (%) | N.A | N.A | 9.56% | 9.68% |
- Abbreviations: C, Cyclosporine; DL, Drug load; EE, Encapsulation Efficiency; N.A, not applicable; NLCs, nanostructured lipid carriers; PDI, Polydispersity index; S, Sirolimus.

3.2 In vitro cellular uptake
The quantitative cellular uptake of NLCs was determined by flow cytometric analysis. The results showed that blank NLCs had remarkable cellular uptakes at 24 h (75.70 ± 12.53). Accordingly, the cellular uptake of drug-loaded NLCs was evaluated at 24 h. Mean fluorescent intensity (MFI) exhibited that the cellular uptake of S-NLCs, C-NLCs, and S-C-NLCs also occurred upon incubation with T cells, in which significant differences (p = 0.0089, p = 0.0232, and p = 0.0151, respectively) were observed compared with blank NLCs (Figure 2, Figure S2 and Table S1).

3.3 Cellular viability
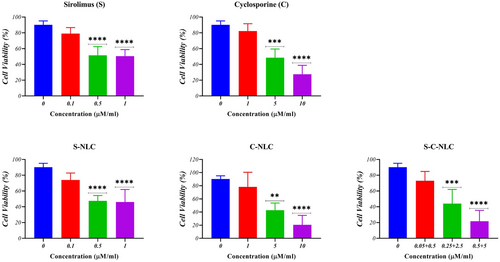
The MTT assay was employed to determine the percentage of cell viability in the mono-delivery of NLCs and co-delivery of SRL and CsA. The results showed that free solutions of SRL and CsA had cell viability up to 79.00% and 82.30% at concentrations of 0.1 μM and 1 μM, respectively. S-NLCs and C-NLCs at concentrations equivalent to 0.1 μM of SRL and 1 μM of CsA had cell viability up to 74.00% and 78.30%, respectively. They were selected as an optimum concentration in this study. The data analysis also indicated that the combination treatment of T cells with 0.05 μM SRL and 0.5 μM CsA co-loaded NLCs resulted in 73.00% cell viability (Figure 3, Table S2).
3.4 Apoptosis
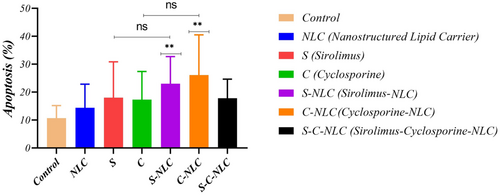
According to the obtained results, S-NLCs and C-NLCs had a higher apoptotic rate in T cells compared to SRL and CsA, respectively but this was not significant. Also, they had a significantly higher apoptotic rate compared to the control group (T cells without exposure to drugs; control and S-NLCs: 10.70 ± 4.47 and 23.00 ± 9.74, respectively, p = 0.0028; control and C-NLCs: 10.70 ± 4.47 and 26.10 ± 14.41, respectively, p = 0.0042). However, no significant difference was found following S-C-NLCs compared to the control (10.70 ± 4.47, 17.80 ± 6.83; Figure 4, Figure S3, and Table S1).
3.5 Frequency of Th1, Th2, Th17, and Tregs
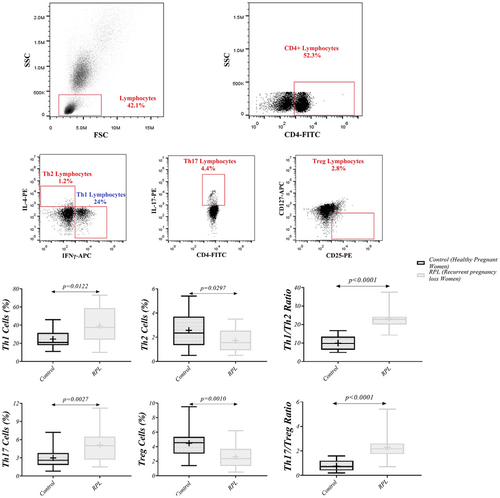
Flow cytometry was used to measure the levels of Th1 (CD4+ IFN-γ+ IL-4−), Th2 (CD4+ IL-4+ IFN-γ−), Th17 (CD4+ IL-17+) and Tregs (CD4+ CD25+ CD127−). Also, for additional identification of dynamic changes in these cells, we evaluated the ratio of Th1/Th2 and Th17/Tregs. In this study, the frequency of Th1 and Th17 demonstrated a significant increase in RPL patients compared to healthy pregnant women (39.25 ± 18.92, 24.70 ± 9.10; p = 0.0122 and 5.12 ± 2.50, 2.98 ± 1.51; p = 0.0027, respectively), while Th2 and Tregs showed a lower frequency in RPL patients compared with controls (1.72 ± 0.85, 2.57 ± 1.32; p = 0.0297 and 2.61 ± 1.42, 4.48 ± 1.88; p = 0.0010, respectively). The ratio of Th1/Th2 and Th17/Tregs also showed an increase in RPL patients compared with controls (23.12 ± 4.91, 9.91 ± 3.82; p < 0.0001 and 2.30 ± 1.18, 0.76 ± 0.42; p < 0.0001, respectively; Figure 5, Table 3).
| Control (N = 20) | RPL patient (N = 20) | NLC patient (N = 20) | S-NLC patient (N = 20) | C-NLC patient (N = 20) | S-C-NLC patient (N = 20) | |
|---|---|---|---|---|---|---|
| Mean ± SD | Mean ± SD | Mean ± SD | Mean ± SD | Mean ± SD | Mean ± SD | |
| p Value | p Value | p Value | p Value | p Value | p Value | |
| Relative gene expression (Fold Change) | ||||||
| T-bet | 1.00 ± 0.09 | 1.84 ± 0.66 | 1.95 ± 0.89 | 1.52 ± 0.54 | 1.45 ± 0.28 | 1.213 ± 0.39 |
| p Value | – | <0.0001 | 0.0008 | 0.0022 | <0.0001 | NS |
| GATA-3 | 1.00 ± 0.08 | 1.10 ± 0.29 | 1.16 ± 0.42 | 0.90 ± 0.20 | 0.88 ± 0.26 | 0.773 ± 0.419 |
| p Value | – | NS | NS | NS | NS | NS |
| RORγT | 1.00 ± 0.07 | 1.89 ± 1.01 | 2.04 ± 0.59 | 1.46 ± 0.20 | 1.55 ± 0.63 | 1.163 ± 0.274 |
| p Value | – | <0.0001 | <0.0001 | 0.0001 | 0.0002 | NS |
| FoxP-3 | 1.00 ± 0.05 | 0.60 ± 0.31 | 0.57 ± 0.45 | 0.67 ± 0.39 | 0.70 ± 0.30 | 0.832 ± 0.491 |
| p Value | – | <0.0001 | 0.0025 | 0.0058 | 0.0019 | NS |
| Protein expression (%) | ||||||
| T-bet | 33.65 ± 19.32 | 70.15 ± 29.94 | 73.65 ± 29.61 | 54.15 ± 20.43 | 51.85 ± 14.85 | 36.05 ± 11.42 |
| p Value | – | 0.0003 | <0.0001 | 0.0116 | 0.0097 | NS |
| GATA-3 | 36.40 ± 14.28 | 38.80 ± 16.60 | 39.35 ± 23.15 | 33.05 ± 9.84 | 31.65 ± 16.72 | 26 ± 21.64 |
| p Value | – | NS | NS | NS | NS | NS |
| RORγT | 19.55 ± 19.12 | 65.35 ± 29.53 | 66.05 ± 30.77 | 38.25 ± 23.70 | 39.80 ± 22.55 | 25.1 ± 25.5 |
| p Value | – | <0.0001 | <0.0001 | 0.0451 | 0.0200 | NS |
| FoxP-3 | 62.35 ± 24.06 | 17.50 ± 8.38 | 16.40 ± 14.63 | 35.60 ± 15.51 | 32.55 ± 22.26 | 47.55 ± 26.31 |
| p Value | – | <0.0001 | <0.0001 | 0.0011 | 0.0012 | NS |
| ELISA (cell supernatant) | ||||||
| IL-4 (pg/mL) | 77.95 ± 34.71 | 95.50 ± 42.79 | 100.20 ± 58.00 | 80.25 ± 48.87 | 81.75 ± 31.00 | 68.65 ± 24.07 |
| p Value | – | NS | NS | NS | NS | NS |
| IFN-γ (pg/mL) | 89.45 ± 35.47 | 153.50 ± 68.62 | 164.50 ± 60.04 | 135.00 ± 39.27 | 132.40 ± 33.68 | 108.8 ± 34.1 |
| p Value | – | 0.0045 | 0.0002 | 0.0022 | 0.0017 | NS |
| TNF-α (pg/mL) | 378.00 ± 158.00 | 652.50 ± 333.70 | 685.00 ± 328.60 | 578.50 ± 227.50 | 555.00 ± 240.60 | 470 ± 261.2 |
| p Value | – | 0.0125 | 0.0041 | 0.0133 | 0.0462 | NS |
| IL-17 (pg/mL) | 87.25 ± 43.81 | 154.30 ± 64.81 | 164.80 ± 67.10 | 140.10 ± 58.01 | 135.10 ± 64.31 | 116.8 ± 44.96 |
| p Value | – | 0.0027 | 0.0007 | 0.0126 | 0.0460 | NS |
| IL-21 (pg/mL) | 201.00 ± 103.40 | 347.10 ± 130.10 | 360.20 ± 149.40 | 307.50 ± 86.63 | 288.80 ± 92.46 | 238.1 ± 148.8 |
| p Value | – | 0.0018 | 0.0020 | 0.0056 | 0.0359 | NS |
| IL-10 (pg/mL) | 108.10 ± 34.81 | 54.80 ± 42.72 | 50.45 ± 23.28 | 72.90 ± 33.79 | 71.75 ± 42.07 | 87 ± 44.62 |
| p Value | – | 0.0006 | <0.0001 | 0.0121 | 0.0249 | NS |
| TGF-β (pg/mL) | 281.90 ± 100.00 | 189.10 ± 107.00 | 196.10 ± 93.95 | 246.70 ± 100.20 | 252.60 ± 103.20 | 284.6 ± 153.2 |
| p Value | – | 0.0357 | 0.0392 | NS | NS | NS |
| Flow cytometry | |||
| Healthy controls | RPL patients | p Value | |
| (N = 20) mean ± SD | (N = 20) mean ± SD | ||
| Th1 (%) | 24.70 ± 9.10 | 39.25 ± 18.92 | 0.0122 |
| Th2 (%) | 2.57 ± 1.32 | 1.72 ± 0.85 | 0.0297 |
| Th17 (%) | 2.98 ± 1.51 | 5.12 ± 2.50 | 0.0027 |
| Treg (%) | 4.48 ± 1.88 | 2.61 ± 1.42 | 0.001 |
| Th1/Th2 Ratio | 9.91 ± 3.82 | 23.12 ± 4.91 | <0.0001 |
| Th17/Treg Ratio | 0.76 ± 0.42 | 2.30 ± 1.18 | <0.0001 |
- Note: Data are presented as number or mean ± standard deviation (SD). P < 0.05 was considered as statistically meaningful.
- Abbreviations: FoxP3, forkhead box P3; GATA-3, GATA binding protein 3; IL, interleukin; RORγt, RAR-related orphan receptor γt; TGF-β, transforming growth factor; Th, T helper; Treg, regulatory T.
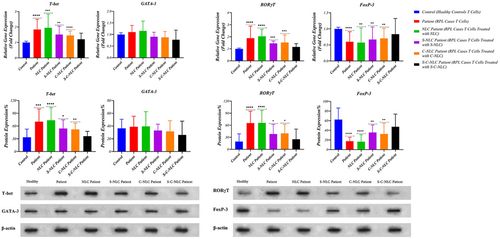
3.6 Expression levels of transcription factors related to T cells
Real-time PCR was performed to study the effects of drug-loaded NLCs on the mRNA expression levels of Th1, Th2, Th17, and Treg transcription factors in the samples from the patients with RPL. The data revealed that the expression of T-bet and RORγt in RPL patients was greater than the healthy pregnant women (p < 0.0001), while Foxp3 was lower (p < 0.0001). After exposure to drug-loaded NLCs, the expression levels of T-bet and RORγt decreased, and the levels of Foxp3 increased in RPL samples. In this context, after S-NLC and C-NLC interventions, a significant difference was found in the expression of T-bet (p = 0.0022 and p < 0.0001, respectively), RORγt (p = 0.0001 and p = 0.0002, respectively), and Foxp3 (p = 0.0058 and p = 0.0019, respectively) in RPL patients compared with controls, while following the S-C-NLC intervention, no meaningful difference was observed in the expression of these factors. Apart from these findings, no significant changes were observed in GATA-3 expression in RPL compared with controls before and after exposure to drug-loaded NLCs (Figure 6 and Table 3).
3.7 Protein levels of transcription factors related to T cells
For additional investigation, a Western blot analysis was performed to measure the protein levels of T-bet, GATA-3, RORγt, and Foxp3. After exposure to S-NLCs and C-NLCs, a significant decrease was observed in the protein levels of T-bet (p = 0.0116 and p = 0.0097, respectively) and RORγt (p = 0.0451 and p = 0.0200, respectively), whereas the Foxp3 level meaningfully increased (p = 0.0011 and p = 0.0012, respectively) in RPL samples compared with controls. Furthermore, following the S-C-NLC intervention, our results did not show any statistical differences in the protein level of these factors in RPL patients compared with controls (Figure 6 and Table 3).
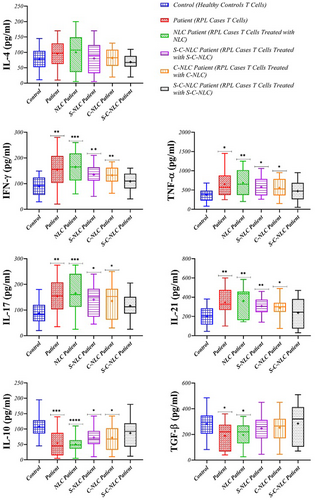
3.8 Cytokine levels
To assess the molecular responses of immune cells, the levels of Th1, Th2, Th17, and Treg-related cytokines were evaluated. The higher levels of IFN-γ, TNF-α, IL-17, and IL-21 (p = 0.0045, p = 0.0125, p = 0.0027, and p = 0.0018, respectively), as well as lower levels of IL-10 and TGF-β (p = 0.0006 and p = 0.0357, respectively), were observed in RPL patients compared with controls. Exposure to drug-loaded NLCs showed a decrease in the levels of IFN-γ, TNF-α, IL-17, and IL-21, as well as an increase in the levels of IL-10 and TGF-β in RPL samples. In this context, following S-NLC and C-NLC interventions, significant differences were observed in the levels of IFN-γ (p = 0.0022 and p = 0.0017, respectively), TNF-α (p = 0.0133 and p = 0.0462, respectively), IL-17 (p = 0.0126 and p = 0.0460, respectively), IL-21 (p = 0.0056 and p = 0.0359, respectively), and IL-10 (p = 0.0121 and p = 0.0249, respectively) compared with controls, while no statistically significant difference was found in TGF-β levels. Also, after the S-C-NLC intervention, no significant differences were observed in the level of these cytokines in RPL patients compared with controls. Our results showed no significant changes in the level of IL-4 in RPL patients compared with controls before and after exposure to drug-loaded NLCs (Figure 7, Table 3).
4 DISCUSSION
In this study, for the first time, the co-delivery of SRL and CsA by NLCs provided a new means of site-specific drug delivery with increasing their therapeutic efficacy as immunosuppressive agents for RPL patients. They can effectively reduce inflammatory states in RPL patients by a balance between Th1/Th2 and Th17/Tregs.
Immune abnormalities could be involved in the pathogenesis of unexplained RPL by impairing maternal-fetal immune tolerance.18 In this case, regulatory mechanisms are unable to control responses against the fetus; thus, failures to preserve adequate Th1/Th2 and Th17/Treg balance create an inflammatory environment in the maternal-fetal interface associated with recurrent miscarriage.19, 20 In line with previous studies, our results showed a higher frequency of Th1 and Th17 cells with lower Th2 and Tregs in RPL patients compared with the healthy group, suggesting a shift toward inflammatory responses.21, 22
CsA and SRL are typical immunosuppressive agents commonly used to prevent the rejection of organ transplant and treat some autoimmune diseases.12 CsA exerts its main effects through the formation of a particular complex with cyclophilins, which binds to calcineurin A. The CsA-cyclophilin complex inhibits lymphokine transcription (including IFN-γ, TNF-α, and IL-2) and lymphocyte proliferation by preventing serine–threonine protein phosphatase activity, leading to immunosuppression.23 SRL (rapamycin) differs in the mechanism of action from a calcineurin inhibitor. SRL interacts with FK506 binding proteins (FKBPs) to generate its biological function. This complex inhibits the mammalian target of rapamycin (mTOR) kinase pathway, resulting in cell cycle arrest at the G1 to S phase.24 SRL exhibits its immunosuppressive effects by blocking intracellular immune responses, downstreaming co-stimulatory signals, and inhibiting the proliferation of T cells stimulated by IL-2.16 SRL has an adverse effect on the decidualization of human endometrium. SRL may improve immune tolerance—but inhibit decidualization—leading to embryo implantation failure or pregnancy loss.25 According to the hydrophobicity and lower solubility of these components in the blood storm,26 they are less available to T cells. In this study, we used a nanocarrier strategy to increase their efficacy and avoid or decrease their toxicity effects. The characteristics of prepared NLCs include a suitable size, zeta potential, higher percentages of EE and DL, and appropriate cellular uptake, besides the spherical shapes of the nanoparticles, confirming optimum formulations in our study. Nanoparticles with sizes from 70 to 200 nm are circulated in the blood longer than free drugs since they can effectively escape elimination from the reticuloendothelial system.27, 28 Besides the particle size, the reasonable zeta potential of nanoparticles prevents aggregation by causing repulsive forces and improving permeability across cell membranes.29 It has been shown that nanoparticles with negative surface charge circulate in blood storms more favorably than positively charged ones since most plasma proteins are negatively charged.30 Based on the results of cell viability, the amount of SRL and CsA could be reduced to a large content due to the co-delivery by NLCs, in which the rate of cell apoptosis was not significantly increased.
To find the correlation of T-bet, GATA-3, RORγt, and Foxp3 transcription factors with RPL, we evaluated their expressions in RPL patients. Our results confirmed previous findings that RPL is associated with increased T-bet and RORγt and decreased Foxp3.5, 21 After exposure to drug-loaded NLCs, the mRNA expression level of T-bet and RORγt decreased, while the expression of Foxp3 increased in RPL patients. Thus, a significant difference was observed in exposure to S-NLCs and C-NLCs—but not S-C-NLC—compared with healthy pregnant women. These results were also verified by protein analysis.
Besides the importance of cellular profile in the pathogenesis of RPL, it has been believed that cytokines develop a complex regulatory network to establish immune homeostasis between the semi-allogenic fetus and mother. Moreover, any dysregulation of cytokines also could play a significant role in RPL development.2, 31 In the present study, significantly higher levels of IFN-γ, TNF-α, IL-17, and IL-21, as well as lower levels of IL-10 and TGF-β, were identified in RPL patients compared with controls. In line with this finding, it has been revealed that Th1-related cytokines increased in RPL patients,32 inhibiting the growth and differentiation of trophoblast cells.33 Hence, TNF-α stimulates the programmed cell death in human primary villous trophoblasts, and IFN-γ increases TNF-α-mediated cell death.2 Moreover, in unexplained RPL patients, the number of Th17 cells and related cytokines (including IL-17 and IL-21) increased in the peripheral blood and decidua compared with healthy pregnancies.34 IL-17 is known as a pro-inflammatory cytokine that is mostly produced by Th17 cells and has a vital role in promoting the inflammatory immune response by stimulating macrophages, dendritic cells, fibroblast cells, epithelial cells, and endothelial cells to produce numerous pro-inflammatory cytokines (such as IL-1, TNF-α, and IL-6).35, 36 In addition, IL-21 is selectively produced by Th17 cells compared with other subsets of T cells to promote Th17 differentiation.37, 38
As we expected, after exposure to drug-loaded NLCs, the levels of IFN-γ, TNF-α, IL-17, and IL-21 decreased, while the levels of IL-10 and TGF-β increased; therefore, a significant difference was observed in IFN-γ, TNF-α, IL-17, IL-21, and IL-10 levels than in exposure to S-NLCs and C-NLCs—but not S-C-NLCs—compared with controls. Regarding the level of TGF-β, no significant difference was found after exposure to drug-loaded NLCs compared with healthy pregnant women. These consequences exhibit the elevation of Treg function, which could be considered important cells in allograft tolerance during pregnancy. They contribute to the expansion and maintenance of peripheral tolerance through their suppression effects, which could be done by producing anti-inflammatory mediators, including IL-10 and TGF-β.39, 40 IL-10 is identified as a compatible cytokine during pregnancy that regulates maternal immune responses to harbor an allogeneic fetus. As indicated by evidence, IL-10 has a significant role in decreasing inflammation-mediated vascular dysfunction and is hypoxic in gestation.41, 42 In addition, our results did not show any statistical difference in Th2 responses in RPL patients before and after exposure to drug-loaded NLCs. The limitations of this study are as follows: Besides a small sample size, we had no information about the use of vitamin D supplementation in the patients, no in vivo study, and no functional assay for T cells due to temporal and financial constraints.
In conclusion, our study revealed an imbalance between Th1/Th2 and Th17/Treg immunity in the peripheral blood of RPL patients. Interestingly, for the first time, we revealed that the co-delivery of SRL and CsA by NLCs effectively balanced the immune responses between these cells in the blood samples of RPL patients to induce maternal immune tolerance, which is conducive to a successful pregnancy. According to this finding, S-C-NLCs, as combined immunotherapy by simultaneously modulating multiple cell-signaling pathways, could be a novel and safe approach for effective treatment and drug administration in RPL patients. It is noteworthy that in vivo studies are required to confirm our findings in terms of the beneficial effects of S-C-NLCs in RPL patients.
ACKNOWLEDGMENTS
The authors acknowledge the Stem Cell Research Center of Tabriz University of Medical Science for their support of this study (Grant No. 64496).
CONFLICT OF INTEREST STATEMENT
The authors declare that there is no conflict of interests.
HUMAN RIGHTS STATEMENTS AND INFORMED CONSENT
The informed consent forms were signed by all participants before the study began.
ANIMAL STUDIES
This article does not contain any studies with human and animal subjects performed by any of the authors.
APPROVAL BY ETHICS COMMITTEE
Study approval was conducted by Tabriz University of Medical Sciences Research ethical committee (IR.TBZMED.REC.1398.1028).


