SCLpred-MEM: Subcellular localization prediction of membrane proteins by deep N-to-1 convolutional neural networks
Funding information: UCD School of Computer Science Bursary; Irish Research Council, Grant/Award Number: GOIPG/2014/603
Abstract
The knowledge of the subcellular location of a protein is a valuable source of information in genomics, drug design, and various other theoretical and analytical perspectives of bioinformatics. Due to the expensive and time-consuming nature of experimental methods of protein subcellular location determination, various computational methods have been developed for subcellular localization prediction. We introduce “SCLpred-MEM,” an ab initio protein subcellular localization predictor, powered by an ensemble of Deep N-to-1 Convolutional Neural Networks (N1-NN) trained and tested on strict redundancy reduced datasets. SCLpred-MEM is available as a web-server predicting query proteins into two classes, membrane and non-membrane proteins. SCLpred-MEM achieves a Matthews correlation coefficient of 0.52 on a strictly homology-reduced independent test set and 0.62 on a less strict homology reduced independent test set, surpassing or matching other state-of-the-art subcellular localization predictors.
1 INTRODUCTION
Membrane proteins are a special category of proteins that are part of, or are attached to, the membrane of the cell or an organelle. Membrane proteins are well-studied due to their critical functions such as assisting the immune system, active and passive transportation of molecules and protecting the cell from foreign threats. Knowledge of membrane proteins is indispensable in medical research and drug design. However, predicting if a protein localizes to a membrane is still an unsolved problem. The inherently complex nature of proteins makes classifying proteins into membrane and non-membrane a difficult task. This difficult nature has resulted in a lack of accurate predictors dedicated for membrane/non-membrane protein classification. However, recently, several subcellular localization predictors have been published predicting various subcellular localization classes that can, in some cases, be mapped into membrane and non-membrane proteins. Most subcellular localization predictors, published in recent years, are powered by machine learning algorithms. Specifically, deep learning1 algorithms are among the most widely used machine learning algorithms for the prediction of protein properties such as proteins secondary structure,2, 3 solvent accessibility,4 contact maps,5 protein domains,6 and subcellular localization.7 Machine learning algorithms are highly successful in protein subcellular localization prediction due to the large volume of freely available databases such as UniProt.8
We developed an ab-initio membrane protein predictor, SCLpred-MEM, a new member of the SCLpred family of predictors,9-11 that works in conjunction with our other predictors to provide comprehensive information on the predicted location of a protein within the cell. Query proteins submitted to the SCLpred-MEM web-server are first classified as part of the endomembrane system and secretory pathway, or not, by SCLpred-EMS.11 Proteins that are classified as endomembrane system and secretory pathway proteins are further classified by SCLpred-MEM as belonging to a membrane or not, within the endomembrane system and secretory pathway system. This ab initio approach does not depend on finding similar proteins (templates) for protein classification, which makes SCLpred-MEM robust and independent.
SCLpred-MEM is implemented as an ensemble of N1-NN networks trained and tested in 5-fold cross-validation on the UniProt Knowledgebase (UniProtKB/Swiss-Prot) release 2019_05.8 We employed a novel homology reduction protocol for strict homology reduction, combined with a novel method to encode the evolutionary information of a protein.4 For comprehensive benchmarking, the final system was tested on two independent test sets, a moderately redundancy reduced set and strictly redundancy reduced set that we call ITS and ITS_strict, respectively. The sequences in these test sets were added to the UniProtKB/Swiss-Pro database after 2016. SCLpred-MEM was benchmarked against DeepLoc,7 SCL-Epred,10 and LocTree3.12 The prediction algorithm of DeepLoc consists of a convolutional neural network, a recurrent neural network and a feedforward neural network. DeepLoc was trained on the UniProt release 2016_04 and predicts query proteins into 10 classes, including membrane bound and soluble proteins. SCL-Epred employs N1-NN networks for prediction and trained on UniProt release 2011_02. LocTree3 is powered by a stack of support vector machines (SVM) and homology and trained on UniProt release 2011_04.
2 MATERIALS AND METHODS
2.1 Datasets
Initially, all entries from humans, rodents, mammals, vertebrates, invertebrates, fungi and plants were extracted from UniProtKB release 2019_058 resulting in 189 818 proteins from 7859 species. We further processed these sequences retaining only metazoa proteins with a UniProtKB subcellular location annotation supported by published experimental evidence (ECO code ECO:0000269) leaving 29 573 sequences. This set of proteins was further reduced by removing any protein that was less than 30 amino acids long or greater than 10 000 amino acids long. The set was split into two groups: the endomembrane system and secretory pathway; and “other.” 10 223 sequences remained in the endomembrane system and secretory pathway which were further split into membrane and non-membrane. The majority of sequences are labeled with more than one subcellular location, we found 5236 sequences that were labeled with only non-membrane locations, 4093 sequences that were labeled with only membrane locations, and 894 sequences that were labeled with both membrane and non-membrane locations, these were added to the membrane set.
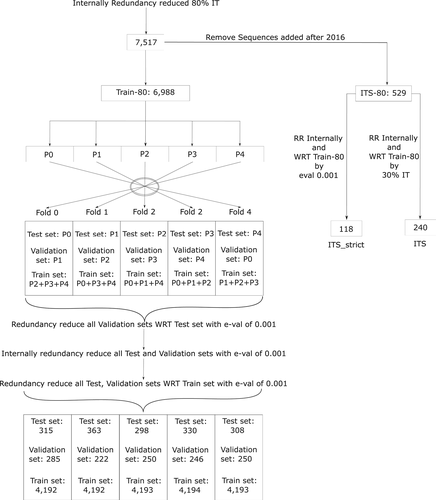
The resulting set was then internally redundancy reduced using BLAST13 as follows: the first sequence in the set is kept; after N sequences from the set have been examined and K kept, sequence number N + 1 is aligned (using BLAST) against all K that have been kept, discarded if it is more than 80% identical to any of them, or added to them otherwise. The process carries on until all 10 223 sequences in the initial set have been considered. Finally, 7517 sequences were retained and no two sequences were more than 80% identical to each other. A subset of sequences that were added to UniprotKB after 2016 was set aside in the 80% Independent Test Set (ITS-80) to allow for objective benchmarking against other webservers that were developed after 2016. The remaining 6988 sequences after removal of the ITS-80 became the Train-80 and were divided into five parts. These five parts were used to form five folds that are used for 5-fold cross-validation. For each of the 5-fold subdivisions, one of the five parts was assigned as the test set, a second part was assigned as the validation set and the remaining three parts were combined to create the training set. The rest of the folds were formed by repeating the same procedure (See Figure 1).

In the resulting folds, the validation set was redundancy reduced with respect to the test set using BLAST with an e-value of 0.001. Then the test and validation sets were internally redundancy reduced using BLAST with an e-value of 0.001. Finally, the test set and validation sets were redundancy reduced with respect to their corresponding training set using BLAST with an e-value of 0.001.
Two subsets of ITS-80 were used to benchmark other available web servers. The ITS-80 set was internally redundancy reduced and redundancy reduced to less than 30% sequence identity with respect to Train-80 leaving 240 sequences. We call the resulting set the ITS. We then created a second “strict” set by internally redundancy reducing the ITS-80 set using BLAST with an e-value of 0.001, and then redundancy reducing it with respect to Train-80 using BLAST with an e-value of 0.001, leaving 118 sequences. We call this set ITS_strict. Table 1 shows the number of proteins belonging to each class in the Training, ITS and ITS_strict sets.
| Membrane | Other | Total | |
|---|---|---|---|
| Training set | 2766 | 2026 | 4792 |
| ITS_strict | 45 | 72 | 118 |
| ITS | 119 | 121 | 240 |
This rather complex strategy of redundancy reduction ensures that there is minimal similarity between the sequences in the test and validation set with respect to each other and to the training set (e-value ≤ 0.001). However, it allows for a larger training set with sequences with up to 80% sequence identity within the training dataset. Furthermore, the two independent test sets have been redundancy reduced with respect to the training set to ≤ 30% sequence identity or e-value ≤ 0.001 ensuring that these two sets are indeed independent of the training set. Although, reducing redundancy on the entire set of proteins at the beginning of the procedure would be more straightforward, this would have resulted in a much smaller training set.
2.2 Alignments and data encoding
We generated alignments of multiple homologous sequences (MSA) for all datasets used in SCLpred-MEM by iterating PSI-BLAST13 for three rounds with an e-value of 0.001 against the June 2016 version of UniRef90.8 These alignments were encoded into MSA profiles by calculating frequencies of residues and gaps. The frequencies of the amino acids present in the original sequence were then “clipped” to 1, similar to2, 4 where each amino acid was represented by a vector of 22 number frequencies of an amino acid type from the list of homologous sequences.
2.3 Predictive architecture
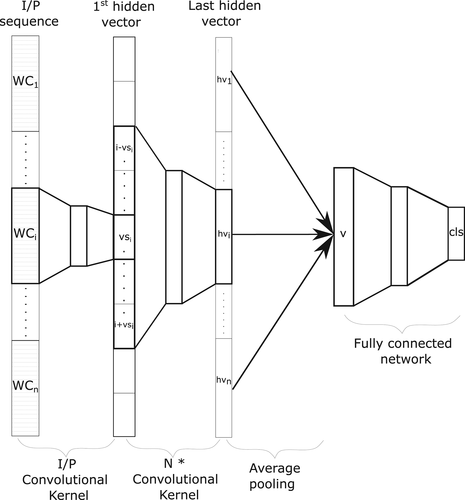
 (1)
(1) at position i and predicts an intermediate state vector
  at position i.
 (2)
(2) of the last hidden kernel at each position i are averaged element wise into a single vector v. A fully connected network predicts the final subcellular location cls of each protein from the final vector v. The fully connected network learns a nonlinear function O.
 (3)
(3)
2.4 Hyperparameter tuning
An extensive hyperparameter search is essential to optimize the model for higher generalization capacity. We adopted a grid search approach for hyperparameter fine-tuning carried out on the first fold of the datasets. Input amino acid window sizes of 1 to 31 were tested and the generalization capability of the model deteriorated significantly after 31 amino acids. The models performed best with two hidden convolutional kernels each containing an input window size of 11 to 31.
The hyperparameters of the best performing model on the first fold of the validation set were considered as the optimal model. This optimal model consists of an input convolutional kernel followed by a stack of two hidden convolutional kernels followed by average pooling and two fully connected layers. This corresponds to a total of 7 inner layers containing roughly 540 weights with an effective input window of 21 amino acids.
2.5 Training and ensembling
The optimal model selected during the hyperparameter tuning phase was trained and tested in 5-fold cross-validation. In order to achieve a higher stability and greater generalization capability from the final system, the five best performing models were selected from each fold based on their performance on their respective validation sets. These best performing five models were ensembled within each fold to gauge the performance of each fold against the respective test sets. The final system contains an ensemble of 25 models selected across five folds on the basis of five best performing models per fold. This 25 model ensemble rectifies the performance fluctuation for unseen proteins and stabilizes the system for a better estimation of performance.
2.6 Performance evaluation
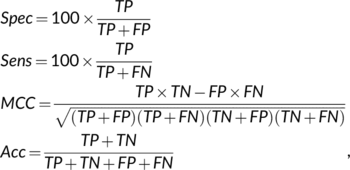
 (4)
(4)• True positives (TP): the number of sequences predicted in the membrane class that are observed in that class.
• False positives (FP): the number of sequences predicted in the membrane class that are not observed in that class.
• True negatives (TN): the number of sequences predicted not to be in the membrane class that are not observed in that class.
• False negatives (FN): the number of sequences predicted not to be in the membrane class that are observed in that class.
2.7 Benchmarking
The performance of SCLpred-MEM is compared to other state-of-the-art subcellular localization predictors. However, due to the high number of subcellular locations of eukaryotic cells, subcellular localization predictors classify query proteins into various locations within the cell. In order to compare them with SCLpred-MEM, we recast the predicted locations of other available predictors into membrane and non-membrane classes. Table 2 shows the mapping of predicted classes for the ITS and ITS_strict for each predictor.
| Predictor | Membrane classes | Non-membrane classes |
|---|---|---|
| DeepLoc | “Membrane” | “Soluble” |
| SCL-Epred | “Membrane” | “Secreted” |
| “Other” | ||
| LocTree3 | “Endoplasmic reticulum membrane” | “Chloroplast” |
| “Golgi apparatus membrane” | “Cytoplasm” | |
| “Plasma membrane” | “Endoplasmic reticulum” | |
| “Mitochondrion membrane” | “Golgi apparatus” | |
| “Mitochondrion” | ||
| “Nucleus” | ||
| “Peroxisome” | ||
| “Secreted” | ||
| “Vacuole” |
3 RESULTS
SCLpred-MEM was extensively tested for hyperparameter and model selection. The selected models were trained in 5-fold cross-validation and tested using two independent test sets to benchmark against current state-of-the-art subcellular localization predictors. The final predictor uses an ensemble of 25 trained models that had the best generalizing capability to predict subcellular locations for unseen proteins. The results of the 5-fold cross-validation are shown in Table 3.
| MCC | Spec | Sen | ACC | |
|---|---|---|---|---|
| Fold 0 | 0.56 | 82.32% | 77.14% | 78.10% |
| Fold 1 | 0.63 | 84.18% | 79.26% | 81.54% |
| Fold 2 | 0.66 | 80.81% | 88.54% | 82.89% |
| Fold 3 | 0.62 | 83.43% | 80.11% | 80.91% |
| Fold 4 | 0.66 | 84.81% | 82.21% | 82.79% |
| Average | 0.63 | 83.11% | 81.45% | 81.25% |
- Abbreviation: MCC, Matthews correlation coefficient.
The performance of SCLpred-MEM was benchmarked against DeepLoc 1.0,7 SCL-Epred,10 and LocTree3.12 SCLpred-MEM outperforms all the benchmarking predictors on the ITS_strict and performs better than all the predictors except DeepLoc on the ITS (Table 4). We found a statistically significant difference between group means as determined by one-way ANOVA (F[3945] = 9.48056, P < .00001) on the ITS. Specifically, a Post Hoc Tukey HSD showed a significant difference between the number of correctly and incorrectly predicted sequences between SCLpred-MEM and SCLpred-Epred (P = .00004), and SCLpred-MEM and LocTree3 (P = .02409), but not between SCLpred-MEM and DeepLoc. There were no statistically significant differences between group means as determined by one-way ANOVA (F[3466] = 1.81625, P = .31971) on the ITS_strict, perhaps because of the small size of the dataset.
| ITS N = 240 | ||||
|---|---|---|---|---|
| MCC | Spec | Sen | ACC | |
| SCLpred-MEM | 0.62 | 85.4% | 74.0% | 80.8% |
| DeepLoc | 0.63 | 93.8% | 63.9% | 80.0% |
| SCL-Epred | 0.57 | 87.7% | 62.8% | 77.4% |
| LocTree3 | 0.46 | 92.6% | 42.0% | 69.5% |
| ITS_strict N = 118 | ||||
|---|---|---|---|---|
| MCC | Spec | Sen | ACC | |
| SCLpred-MEM | 0.52 | 78.8% | 57.8% | 78.0% |
| DeepLoc | 0.51 | 87.5% | 46.7% | 77.1% |
| SCL-Epred | 0.43 | 76.9% | 45.5% | 74.1% |
| LocTree3 | 0.39 | 92.3% | 26.7% | 71.2% |
- Abbreviation: MCC, Matthews correlation coefficient.
SCLpred-MEM has a moderate specificity. This indicates that the model may be setting its biases to favor the positive class (membrane proteins). However, the sensitivity of SCLpred-MEM is also considerably higher than other predictors tested. This indicates that the probability of correctly predicting the positive class is high. The performance of SCLpred-MEM against the ITS is not considerably better compared to the ITS_strict whereas the performance of other predictors against the ITS is considerably better compared to their performance against the ITS_strict. This indicates that the generalizing capability of SCLpred-MEM is more robust than that of other state-of-the-art subcellular localization predictors.
4 DISCUSSION AND CONCLUSION
The performance of SCLpred-MEM is better than any subcellular localization predictor we benchmarked on the ITS_strict set. While the performance of DeepLoc is particularly impressive on the ITS, its generalization capability deteriorates considerably when stricter homology reduction is introduced. This weakness in generalization capability is observed for most of the predictors. This suggests the critical need for stricter homology reduction in subcellular localization training and testing datasets. The performance of predictors such as SCLpred-MEM and DeepLoc suggests that machine learning based predictors for protein subcellular localization are an efficient alternative to expensive and time-consuming experimental methods. The benchmarking results of current state-of-the-art systems also reveal that there is considerable room for improvement in machine learning based subcellular localization prediction. We recommend employing a stricter homology reduction, as genuine testing of unseen example will be crucial in improving subcellular localization predictions in the future.
SCLpred-MEM has been implemented as a fast state-of-the-art publicly available web-server. The user can submit a list of protein sequences in FASTA format, and SCLpred-MEM predicts the probability that each of these protein will localize to a membrane or not. SCLpred-MEM accepts multiple queries per submission, processes the queries in the background and sends the results to the user via an optional email address if provided. SCLpred-MEM is freely available for academic users at http://distilldeep.ucd.ie/SCLpred-MEM/. The datasets used to test and train SCLpred-MEM are available here: http://distilldeep.ucd.ie/SCLpred-MEM/data/.
ACKNOWLEDGMENTS
The authors acknowledge the Research IT Service at University College Dublin for providing HPC resources that have contributed to the research results reported within this article. http://www.ucd.ie/itservices/ourservices/researchit/. We would like to acknowledge helpful comments from Prof. Jeremy Simpson (School of Biology & Environmental Science, University College Dublin, Dublin, Ireland). This work was supported by the Irish Research Council (GOIPG/2014/603 to Manaz Kaleel) and a UCD School of Computer Science Bursary.
Open access funding enabled and organized by Projekt DEAL.
Open Research
DATA AVAILABILITY STATEMENT
The datasets used to test and train SCLpred-MEM are available here: http://distilldeep.ucd.ie/SCLpred-MEM/data/.


