Computational design of membrane proteins using RosettaMembrane
Abstract
Computational membrane protein design is challenging due to the small number of high-resolution structures available to elucidate the physical basis of membrane protein structure, multiple functionally important conformational states, and a limited number of high-throughput biophysical assays to monitor function. However, structural determination of membrane proteins has made tremendous progress in the past years. Concurrently the field of soluble computational design has made impressive inroads. These developments allow us to tackle the formidable challenge of designing functional membrane proteins. Herein, Rosetta is benchmarked for membrane protein design. We evaluate strategies to cope with the often reduced quality of experimental membrane protein structures. Further, we test the usage of symmetry in design protocols, which is particularly important as many membrane proteins exist as homo-oligomers. We compare a soluble scoring function with a scoring function optimized for membrane proteins, RosettaMembrane. Both scoring functions recovered around half of the native sequence when completely redesigning membrane proteins. However, RosettaMembrane recovered the most native-like amino acid property composition. While leucine was overrepresented in the inner and outer-hydrophobic regions of RosettaMembrane designs, it resulted in a native-like surface hydrophobicity indicating that it is currently the best option for designing membrane proteins with Rosetta.
Abbreviations
-
- Å
-
- Angstrom
-
- β
-
- beta
-
- CSC
-
- constraint to the start coordinates
-
- MWC
-
- minimize with constraints
-
- PDB
-
- Protein Data Bank
-
- RMSD
-
- root-mean-square deviation
-
- PPM
-
- Positioning of Proteins in Membrane
-
- PDBTM
-
- Protein Data Bank of Transmembrane Proteins
Introduction
Membrane proteins comprise approximately 30% of all open reading frames of known genomes.1 However, in the Protein Data Bank (PDB)2 membrane proteins continue to be underrepresented. Membrane proteins, many of which are alpha-helical, include classes of proteins that are responsible for functions such as channel and transporter proteins, or signal transduction in receptors. Additionally, more than 60% of drugs target membrane proteins,3 therefore insight to the structure and function of membrane proteins is valuable for the development of treatment strategies for diseases such as cancer,4, 5 cardiac arrhythmia,6, 7 schizophrenia,8, 9 and many more.
Membrane proteins are difficult to structurally characterize because over-expression of the protein is typically toxic to bacterial cells,3, 10 resulting in low protein yields. Additionally, membrane proteins must be reconstituted into micelles, bicelles, nanodisks, or liposomes to provide a native-like environment. Often an extensive screening for the optimal detergents and lipids is needed for maximal solubility and stability.3 However, membrane mimetics can have a destabilizing effect on the structure of the membrane protein. Finally, membrane proteins have inherent conformational dynamics,11 which often requires engineering of a thermodynamically stabilized mutant for structural studies.
Challenges in membrane protein structure determination has resulted in limited available structural information for membrane proteins. In the PDB less than 3% of structures are membrane proteins. Approximately 700 unique membrane proteins structures have been deposited in the PDB2, 12 to date, which is a vast improvement to the structural information that was available nearly a decade ago, but far away from complete coverage of membrane protein folds. Computational modeling by de novo and comparative modeling can provide structural insights to membrane proteins without experimentally determined structures. However, in order to obtain more accurate models of membrane proteins, more high-resolution structures are needed to understand the physical basis of membrane protein folding and derive more accurate scoring functions.
The PDB is a depository of structure files which provides the knowledge-base for proteins of known structure to drive the development of accurate scoring functions and for rigorous testing of newly developed computational methods. As a result, methods for computational membrane protein structure prediction lag behind considerably, and computational design of function—an area of great success for soluble proteins in the past ten years—is largely absent for membrane proteins. However, the structures of many important membrane proteins have been determined at a stunning rate over the past 10 years13-17 increasing the knowledge-base for scoring function development, providing higher-resolution structures for benchmarking, and yielding templates of important membrane protein classes to begin engineering.
Computational protein design is a difficult problem due to the large number of possible sequences for a particular protein backbone. Computational design tools aim to rapidly evaluate possible interactions between side-chains to determine likely sequences of low-energy. Some methods have an emphasis on calculations that evaluate electrostatics and solvation of a side-chain in its environment.18-20 However the environment for membrane proteins is complicated and consideration for differences in membrane protein folding should be taken into account.21 Additionally, these methods fail to consider features that many membrane proteins have that are important for function and membrane solubility.22 Tools have been developed empirically to overcome the shortcomings of these calculations for membrane proteins. Walters and Degrado23 developed idealized geometries and position-specific sequence propensities for helix-packing motifs most commonly seen in membrane proteins. Senes et al.24 developed a potential based on the membrane depth dependent propensities of amino acids to predict if sequences would insert in the membrane.
The Rosetta software suite for biomolecular modeling and design has an impressive track record in the design of soluble proteins including the design of a de novo protein fold,25 enzymes,26-29 protein–protein interactions,30-33 protein–small molecule interfaces,34 and self-assembling materials.35-38 The Monte Carlo search strategy that allows changes to amino acid identities during sampling combined with a multiscale knowledge-based scoring function that is optimized to capture structural features at the protein fold level as well as at atomic detail create a unique ability to engineer proteins that set Rosetta apart from other computational strategies. The scoring function and sampling methods used by Rosetta, however, are tailored for the needs of soluble-protein modelers; despite some progress in adapting it for membrane proteins, modeling abilities in membrane proteins lag behind those of soluble proteins.
Rosetta's knowledge-base has been derived in large part using statistical analysis of geometric arrangements within structures reported in the PDB. For protocols involving minimization, backbone torsion angles are randomly perturbed and rotational side-chain conformations are optimized for interactions including van der Waals, electrostatics, and hydrogen-bonding.39, 40 Interactions with the solvent are modeled implicitly by determining the likelihood of a certain amino acid type being in a particular burial state. Monte Carlo sampling combined with knowledge-based scoring functions are parameterized so that resulting models exhibit properties of proteins of known structure.41 The membrane protein scoring function, RosettaMembrane, additionally considers the likelihood of an amino acid being in a particular membrane environment and burial state.42, 43
Previously, Rosetta was used to completely redesign 108 soluble proteins. Designs recovered 51% of the native sequence in the protein core. The terms involving the Lennard–Jones potential and Lazaridis solvation drove the scoring function to design sequences that were native-like.44 In the current study, complete redesign of membrane proteins was benchmarked using RosettaMembrane,42, 43 and for comparison, the Rosetta scoring function for soluble proteins “Talaris.”45, 46 Many membrane proteins like channels and transporters are functional homo-oligomers. In order to model membrane proteins in their native states and obtain correct representation of the surfaces and interfaces, one must consider how such a protein might symmetrically assemble. Therefore, homo-oligomeric membrane proteins were modeled with RosettaSymmetry47 which is able to sample and rapidly score these larger assemblies while considering interface interactions between subunits.
One important application of membrane protein design is thermostabilization to facilitate structural characterization. Membrane proteins often require flexibility in order to perform their function.11, 48 By stabilizing a single conformation, one can reduce the flexibility, thus yielding a more ideal protein for experimental structure determination. Computational methods like RosettaDesign can propose an optimal sequence for a particular conformation by using information from known membrane protein structures. The proposed mutations in the optimized sequence could presumably lead to a thermostabilized membrane protein.
This study evaluates how well Rosetta recovers native sequences for membrane proteins when fully redesigned. We find that the methods for minimizing the structure prior to design play a role in native sequence recovery. Additionally, total sequence recovery was similar among different scoring functions; however, unsurprisingly, RosettaMembrane performed best in designing membrane proteins with native-like properties.
Results and Discussion
Initial energy minimization improves membrane protein design for low-resolution experimental structures
When benchmarking protein design algorithms, the question arises whether or not to minimize the starting experimental structure with the respective scoring function. The argument against minimization is that adjustment of backbone and side-chain coordinates to minimize energy will imprint a “memory” for the correct amino acid into the backbone coordinates. The native amino acid will score better as the backbone is positioned in such a way that the native amino acid can be placed in an energy minimum for the scoring function used. As a result, artificially inflated sequence recovery values might be reported. The counter argument is that energetic frustrations such as clashes in the starting structures that could be relieved with energy minimization might cause the design algorithm to prefer smaller, non-native amino acids in these locations. This is a particular concern for membrane proteins where many structures of reduced resolution are deposited in the PDB. For soluble proteins the latter problem can be easily circumvented by benchmarking only on highest-quality protein structures with resolutions better than 2 Å.44 However, the sparseness of membrane proteins in the PDB requires usage of lower-quality structures. Accordingly, we developed a protocol that applies an initial moderate energy minimization to resolve frustrations but avoids an aggressive optimization that might result in inflated sequence recovery values.
Without initial energy minimization, the sequence recovery of fully redesigned membrane proteins correlates with the resolution of the input structure such that low-resolution structures tend to have reduced sequence recovery (Fig. 1). For monomeric membrane proteins, the Pearson's correlation coefficient is strongly negative at −0.75 (R2 = 0.56). For homo-oligomeric membrane proteins, the Pearson's correlation coefficient is −0.47 (R2 = 0.22). When extrapolated, sequence recovery for a structure with 0 Å resolution is approximately 57 and 45% for monomeric and homo-oligomeric membrane proteins, respectively. Upon energy minimization, the correlation is absent independent of the Rosetta minimization protocol employed (Fig. 1). At the same time, we observe that average sequence recovery for monomeric membrane proteins improves from 31% without backbone energy minimization to 38, 49, 48, and 54% with the four Rosetta minimization protocols minimization with constraints (MWC), constrained to the start coordinate (CSC) relax, FastRelax, and Dualspace, respectively. For homo-oligomeric membrane proteins, average sequence recovery starts at 36% and results in 35, 48, 48, and 55%, respectively.
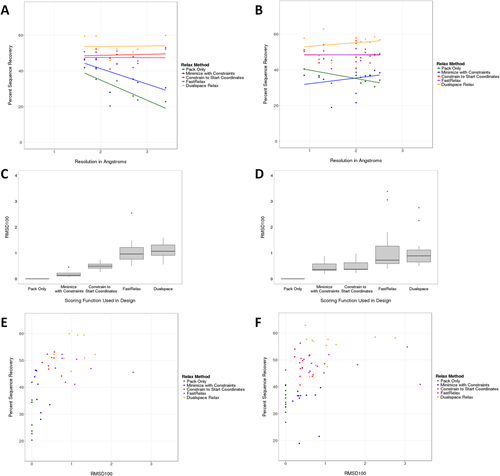
Sequence recovery for monomeric (A,C,E) and homo-oligomeric (B,D,F) sets. Various minimization methods were used to prepare crystal structures as input for Rosetta. When considering sequence recovery by resolution (A,B), pack-only and less stringent minimization (MWC) result in a correlation. CSC, FastRelax, and Dualspace minimization resulted in a consistently high sequence recovery independent of the initial structure resolution. The normalized, average movement of minimized structures for each minimization protocol (C,D) showed that FastRelax and Dualspace tend to move the protein further away from the starting structure. When examining sequence recovery by average movement (E,F), we find that pack-only and MWC had a larger range over low sequence recovery whereas protocols that allowed more movement during minimization, CSC, FastRelax, and Dualspace, yielded more consistently high sequence recovery rates. FastRelax and Dualspace in some cases moved the backbone further than 1 Å.
Our analysis indicates that both initial concerns have merit. A clear correlation between model resolution and sequence recovery is observed. Upon energy minimization this correlation vanishes. However, aggressive minimization protocols such as Dualspace, may inflate sequence recovery beyond what would be expected from the extrapolation to a membrane protein model with 0 Å resolution. To measure movement of the minimized protein from the original structure, the root-mean-square deviation (RMSD) was calculated. FastRelax and Dualspace move the protein beyond 1 Å RMSD100,49 whereas CSC attains similar average sequence recovery rates despite movement of less than 1 Å RMSD100 during minimization [Fig. 1(E,F)]. We conclude that CSC, the limited energy minimization with a constraint to starting coordinates, is a good compromise to avoid over- and under-reporting algorithm accuracy.
Interestingly, for the highest resolution monomer, PDBID, the pack-only preparation resulted in an average sequence recovery of 42%, while MWC was 46%. Using the recommended CSC protocol, the average sequence recovery is 47% [Fig. S1(A), Supporting Information]. This indicates that any major clashes that typically lessen sequence recovery were resolved prior to minimization. Additionally, for the lowest resolution monomer, PDBID, the pack-only and MWC preparations resulted in sequence recoveries of 23 and 31%. However, after more flexible minimization strategies, CSC, FastRelax, and Dualspace, sequence recoveries increased to 53, 52, and 60%, respectively, indicating that perhaps major clashes were resolved once more flexibility was introduced.
For homo-oligomers, this analysis had a different finding. While most of the homo-oligomeric structures were of high-resolution more stringent minimization—CSC, FastRelax, or Dualspace—was required in order to achieve higher sequence recovery percentages [Fig. S1(B)]. This is likely due to an option used during symmetric relax which enables rigid body movement (see protocol capture in Supporting Information). Whereas the pack-only preparation would only move side-chains while MWC might constrain the minimization without considering the placement of the rigid bodies with respect to each other.
Sequence recovery is highest in the core of the protein
To evaluate the performance of RosettaMembrane42, 43 redesigning membrane proteins, we compared the performance of the soluble scoring function Talaris.45, 46 The largest differences in score terms between RosettaMembrane and Talaris are the membrane-related terms that describe the membrane-specific environment (including burial state) and differences in solubility. We used Talaris to test how well Rosetta can design native-like membrane proteins in the absence of these membrane protein specific terms.
For both monomeric and homo-oligomeric sets, average core sequence recovery was higher with the Talaris scoring function when compared to RosettaMembrane [Fig. 2(B)]. Talaris had an average core sequence recovery of 63 and 65% for monomeric and homo-oligomeric datasets, respectively, compared to RosettaMembrane with 52 and 55%. A Wilcoxon signed rank test determined that the difference in percent core sequence recovery between RosettaMembrane and Talaris was significant for both monomers and homo-oligomers (z = 2.49, P = 0.013; z = 3.04, P = 0.002). Residues in the core are less influenced by the membrane environment than surface residues that are likely interacting with the lipid bilayer. Therefore, sampling and scoring in the core is driven by van der Waals packing interactions that are similar for membrane and soluble proteins. RosettaMembrane was derived from score 12, the scoring function that preceded Talaris. Membrane specific scoring terms were added. Meanwhile, score 12 evolved to Talaris through improvement of the electrostatic term, hydrogen bond terms, and reference energies.45, 46 These changes give rise to the improved core sequence recovery observed with the Talaris energy function (Fig. 2) as amino acid interactions are modeled more precisely.

Percent of native sequence recovery for design of membrane proteins using various scoring functions. Boxplots show recovery of native sequence on the surface (A) and core (B) of the protein. RosettaMembrane (Membrane) designed monomeric proteins have a higher average surface recovery than Talaris. The total sequence recovery (C) shows that both scoring functions evaluated appear to have similar native sequence recovery percentages; however, core recovery is higher in Talaris which likely contributes to the total sequence recovery. When homo-oligomers were modeled as monomers, the total average sequence recovery rate was approximately 5% lower than the sequence recovery rate for design considering homo-oligomeric interfaces.
Surface sequence recovery for monomers improved in designs using RosettaMembrane (40%) when compared with Talaris [34%, Fig. 2(A)]. However for homo-oligomers, the average surface sequence recovery was 35% for both RosettaMembrane and Talaris. A Wilcoxon signed rank test determined that the difference in percent surface sequence recovery between RosettaMembrane and Talaris was significant for monomers (z = 2, P = 0.046), and not significant for homo-oligomers (z = 0.69, P = 0.492). RosettaMembrane models a membrane of fixed thickness implicitly. The higher surface sequence recovery observed with RosettaMembrane is attributed to the membrane-specific score terms that adjust the polarity of the environment (Fig. 2). However, the improvement in sequence recovery on the surface within RosettaMembrane when compared to Talaris is only moderate. We attribute this to the absence of specific interactions on the surface of the proteins that allow for the presence of only one specific amino acid. A more pronounced improvement is observed when comparing amino acid property composition between RosettaMembrane and Talaris (Fig. 3).
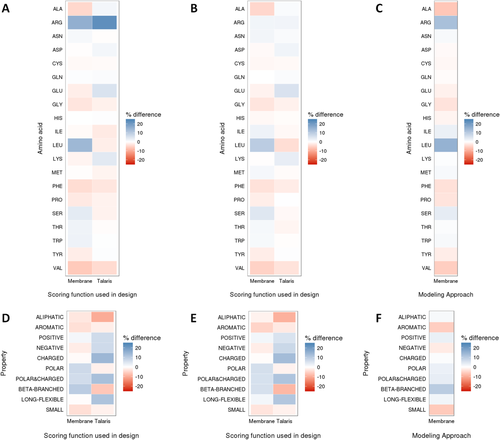
Heatmaps for composition of sequence (A–C) and amino acid properties (D–F) by percent difference of wild-type from design. Datasets evaluated were monomers (A,D), homo-oligomers (B,E), and homo-oligomers as monomers (C,F). Both RosettaMembrane (Membrane) and Talaris scoring functions have strong and weak amino acid recovery for different amino acids in the monomeric set (A,D). The homo-oligomeric set (B,E) performs similarly to the monomeric set for each respective scoring function. Finally, when homo-oligomers are designed as monomers using RosettaMembrane (C,F), the design is less native-like, but has a similar sequence composition as the homo-oligomeric design.
Finally, when evaluating the total sequence recovery in monomers, RosettaMembrane had an average of 46% while Talaris had an average of 48%. In homo-oligomers, the average total sequence recovery was calculated to be 48% for RosettaMembrane and 53% for Talaris. A Wilcoxon signed rank test revealed that the difference in percent total sequence recovery between RosettaMembrane and Talaris was not significant for monomers (z = 0.81, P = 0.421) while it was significant for homo-oligomers (z = 2.1, P = 0.036). When homo-oligomers were designed as monomers, the average percent native sequence recovery for surface [Fig. 2(A)] and core [Fig. 2(B)] were similar to that of homo-oligomers designed in a homo-oligomeric state. A Wilcoxon signed rank test confirmed there was no significant difference (z = 1.24, P = 0.217; z = 0.33, P = 0.739). However, the difference in percent total sequence recovery was found to be significant (z = 2.77, P = 0.006). This is likely due to a subset of residues not classified as either surface (less than or equal to 16 neighbors within a c-beta (C-β) distance of 10 Å) or core residues (more than 24 neighbors within a C-β distance of 10 Å) contributing to the difference in percent total sequence recovery differences.
We selected top models as representatives to better understand which residues were designed by mapping those residues on the structure. For both scoring functions, designed residues tended to be on the surface where residues would be lipid-exposed (Fig. S3), in monomers (Fig. S4), and homo-oligomers (Fig. S5). Residues at the interface of subunits [Figs. S3(C,E) and S5(C,F)] appear to be designed less frequently and result in core-like recovery indicating that design considers neighboring residues from different chains when using RosettaSymmetry.
Amino acid properties are most native-like in proteins designed using RosettaMembrane
Sequence recovery is a limited metric for design in that it only reports how much of the sequence changes from the native sequence. The percent difference in sequence composition (design percent composition—native percent composition) was calculated to further detail how design sequences differed from native (Fig. 3). A negative percent difference (red) indicates that Rosetta introduces that particular amino acid less frequently than is observed in the native proteins in our dataset, while a positive percent difference (blue) indicates Rosetta introduces it more frequently. The average absolute deviation from native sequence composition for monomers was ±3.4% for RosettaMembrane, and ±2.8% for Talaris. For homo-oligomers, a similar trend was seen with ±2.5% for RosettaMembrane, ±1.6% for and Talaris.
Arginine was found more frequently in designs than in native membrane proteins. To visualize where arginines are found in native proteins compared to designs, we have plotted the fraction recovered (Fig. 4) and number of occurrences (Fig. 5) of arginines in all native, best-scoring RosettaMembrane designs, and best-scoring Talaris designs with respect to their position in the membrane layer. This representation can also be seen broken down by monomeric (Figs. S6 and S8) and homo-oligomeric datasets (Figs. S7 and S9). In Figure 4, the fraction recovered drops in the inner hydrophobic layer for RosettaMembrane designs. In Figure 5, it is clear that Talaris is solubilizing the designs as an increase in occurrence of arginine is seen in the inner and outer hydrophobic regions.
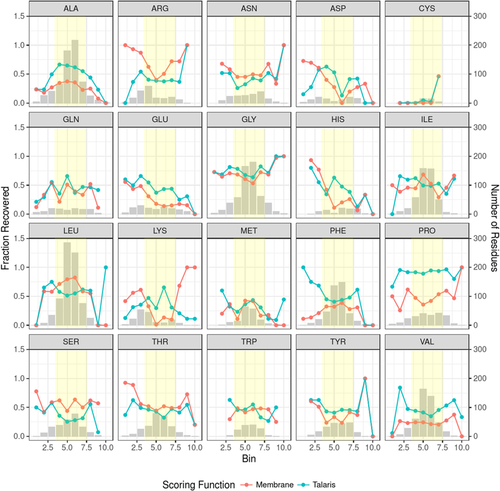
Fraction of sequence recovery for each amino acid with respect to distance from the membrane center. Bars indicate the raw number of residues observed at a particular distance bin (see Table 1) from the membrane center. Dots indicate the fraction recovered at that particular distance bin and lines are not to infer a continuous dataset. The distance bins are discrete and the lines are only to aid the eye in following the trend between layers. The yellow box overlays bins of distance that would contain the inner and outer hydrophobic layers of the protein.
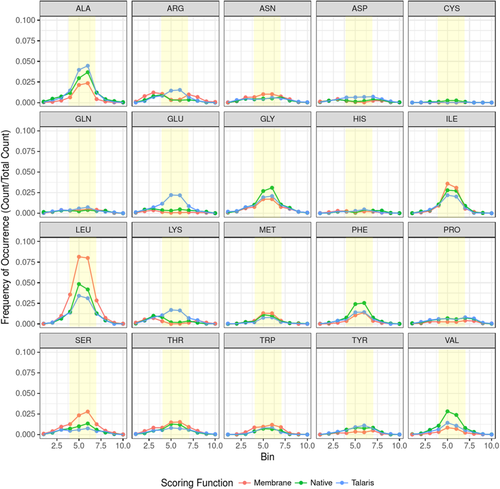
Frequency of occurrence for each amino acid by membrane layer. Bins are a range of distances from the membrane center (see Table I). Dots indicate the frequency of occurrence of an amino acid seen at a particular distance from the membrane center, and lines are not to infer a continuous dataset. The distance bins are discrete and the lines are only to aid the eye in following the trend between layers. The yellow box overlays bins of distance that would contain the inner and outer hydrophobic layers of the protein.
| Bin number | Distance (Å) from membrane center | Membrane layer |
|---|---|---|
| 1 | −40 to −30 | Water |
| 2 | −30 to −24 | Polar |
| 3 | −24 to −18 | Interface |
| 4 | −18 to −12 | Outer hydrophobic |
| 5 | −12 to 0 | Inner hydrophobic |
| 6 | 0 to 12 | Inner hydrophobic |
| 7 | 12 to 18 | Outer hydrophobic |
| 8 | 18 to 24 | Interface |
| 9 | 24 to 30 | Polar |
| 10 | 30 to 40 | Water |
However, for RosettaMembrane, only the outer hydrophobic and interface regions have an increase of occurrence. Additionally, this is more pronounced in the monomeric dataset (Fig. S8), perhaps indicating that there is an additional cost of designing in a bulky residue at a protein-protein interface region (Fig. S9). Talaris adds charged residues such as arginine, aspartate, glutamate, and lysine on the surface and in the inner and outer hydrophobic regions, as expected, to solubilize the protein.
The most striking difference for RosettaMembrane designs when compared with native membrane protein sequences was that the amino acid composition is shifted toward leucine residues (Fig. 4) while other hydrophobic amino acids such as phenylalanine, valine, and alanine, have a lower than native probability. This indicates that RosettaMembrane has a bias toward leucine at the cost of other hydrophobic amino acids. The fraction recovered for leucine in the inner and outer hydrophobic regions ranged from 58 to 82% while valine and alanine had recoveries in the ranges of 20–24 and 23–37%, respectively (Fig. 4). When the number of occurrences of leucine in native proteins and designed proteins was plotted with respect to their position in the membrane layer, leucine was found to be overrepresented by 1.9-fold in the inner and outer hydrophobic regions for RosettaMembrane designs (Fig. 5). An increase is also seen in both datasets with a 2.2-fold increase for monomers (Fig. S8), and a 1.6-fold increase for homo-oligomers (Fig. S9). Additionally, RosettaMembrane designs valine and alanine less frequently than what is seen in native proteins in the inner and outer hydrophobic regions by 3.4- and 1.6-fold, respectively. This further supports that in the hydrophobic regions, valine and alanine are replaced by leucine in RosettaMembrane designs.
Sequence recovery may be too crude of an analysis to determine the extent of which designed proteins have changed. In addition to calculating recovery of native amino acid identities, we calculated the percent difference in the composition of amino acids grouped by properties such as polarity and charge (design percent composition—native percent composition). Here, the average absolute deviation from native amino acid property composition in monomers was 3.9% for RosettaMembrane, and 7.4% for Talaris, while in homo-oligomers, it was 3.4% for RosettaMembrane, and 7.3% for Talaris. When considering the composition of all amino acid properties, RosettaMembrane resulted in proteins with more native-like properties in both monomeric and homo-oligomeric sets [Fig. 3(D,E)]. The differences in sequence composition between native and designed proteins are primarily caused by mutations on the protein surface as core sequence recovery is high for both, Talaris and RosettaMembrane. Recall that surface sequence recovery rates of monomers averaged at 40% for RosettaMembrane designs, whereas Talaris had lower averages of 34 and 38%, respectively [Fig. 2(A)]. However, when comparing the difference in amino acids that are aliphatic [Fig. 3(D,E)], RosettaMembrane is near native with a percent difference of nearly −3% in monomers and −1% in homo-oligomers whereas Talaris had a percent difference near −10% for both monomers and homo-oligomers.
To further investigate which amino acid mutations would be tolerated by evolution, position specific scoring matrix (PSSM) recovery50 was calculated using the uniref50membrane database. Because PSSM recovery is considering all tolerated amino acids that have been seen in known sequences, PSSM recovery will be higher than sequence recovery alone.51 In monomers, RosettaMembrane had an average PSSM recovery of 73% while Talaris had a recovery of 72% [Fig. 6(A)]. In homo-oligomers, RosettaMembrane had an average PSSM recovery of 69% while Talaris was at 70% [Fig. 6(B)]. Despite using a membrane specific database, the PSSM recovery did not favor RosettaMembrane designs.

Heatmaps for PSSM recovery for the monomeric set (A) and homo-oligomeric set (B). The PSSM recovery for each scoring function is similar when comparing the monomeric set to the homo-oligomeric set. RosettaMembrane (Membrane) has limitations for recovering histidine and proline, but shows improved recovery for isoleucine, leucine, valine, and phenylalanine.
RosettaMembrane designs a native-like hydrophobicity gradient and predicted ΔGtransfer
The HotPatch server52 was used to visualize the relative hydrophobicity on the surface of proteins (Fig. S10). For Talaris, despite having a similar sequence composition as native structures [Fig. 3(A,B)], the resulting designs had a noticeably different surface composition. This is supported by the sequence recovery analysis where core sequence recovery is typically much higher than the surface sequence recovery [Fig. 2(A,B)]. Representative design models selected for monomers show that both scoring functions resulted in a large amount of surface residues being redesigned [Fig. S1(A,B)]. Design models of assembled homo-oligomers highlight a similar feature; however, design at the interface of subunits is typically more restricted and thus more core-like [Fig. S1(C–F)]. For Talaris, the surfaces of the majority of the protein designs were covered in hydrophilic residues (Fig. S10) as the scoring function attempted to solubilize the surface of the protein. However, RosettaMembrane resulted in a designed protein with a native-like hydrophobicity gradient on the surface. These models had more strongly hydrophobic and hydrophilic areas whereas native surfaces had moderate hydrophobic and hydrophilic regions.
The positioning of proteins in membrane (PPM) server53, 54 was used to predict the ΔGtransfer for both monomeric and homo-oligomeric sets (Fig. 7). The server tends to predict that integral membrane proteins and peptides have a ΔGtransfer between −400 and −10 kcal/mol.54 For our datasets, the native proteins were in the range of −44 to −164. Designs by the RosettaMembrane scoring function were near and above native in a range of −71 to −275 whereas designs by Talaris were near zero indicating that the designed protein would not be membrane soluble.
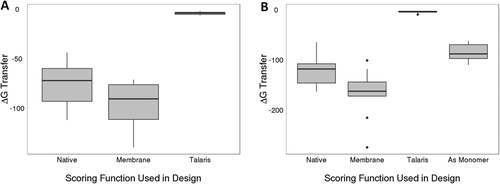
Predicted ΔGtransfer for designs from RosettaMembrane (membrane) and Talaris. For both monomeric (A) and homo-oligomeric (B) sets, the membrane scoring function resulted in more native-like ΔGtransfer values in comparison to Talaris. For the soluble scoring function Talaris, the value was nearly zero indicating it would likely not partition into the membrane. Finally, the homo-oligomeric design took into account surfaces when assembled as an homo-oligomer, resulting in more native-like values.
RosettaMembrane replaces other hydrophobics with leucine
RosettaMembrane chooses leucine over other hydrophobic amino acids. Although leucine may be ideal for the particular membrane environment modeled in Rosetta, this may not be ideal biologically as it does not account for asymmetry and heterogeneity of the membrane. A previous study showed leucine to be the most frequent amino acid in the inner hydrophobic and outer hydrophobic layers of the membrane.42 Because leucine has such a high frequency compared to other amino acids, it scores quite favorably in RosettaMembrane and is overrepresented in designs often replacing native, hydrophobic amino acids [Figs. 3(A) and 5].
To further investigate how leucine might replace hydrophobic amino acids such as alanine, valine, and phenylalanine, we mapped their occurrences onto the structures to understand where each scoring function would typically place them compared to where they are found on the native membrane protein. For both monomers and homo-oligomers, native membrane proteins have alanine in the core as well as on the surface (Fig. S11). Both scoring functions typically placed alanine in the core of the protein and RosettaMembrane had a lower alanine sequence composition than native membrane proteins. In homo-oligomers, very few alanine occur on the surface of the protein that would be lipid-exposed, and very few are seen in the interface between subunits, likely due to alanine's small size.
Designs from both scoring functions resulted in fewer valine and phenylalanine. Both residues are hydrophobic and, in the case of RosettaMembrane, were likely replaced by leucine. Valine was typically designed in the core of the protein regardless of scoring function; however, in homo-oligomers, Talaris does place valine in the core-like interface between subunits more frequently than RosettaMembrane (Fig. S12). Despite phenylalanine typically occurring in the interface and inner and outer hydrophobic layers, fewer phenylalanines are seen on the surface of designs from both scoring functions (Fig. S13). This suggests that leucine's abundance in these layers overshadows the presence of phenylalanine in native membrane proteins. As a comparison, arginine, was also highlighted onto structures (Fig. S14). Although the percent difference in composition was like that of leucine, the number of occurrences (Fig. 4) was much lower, so the effect was pronounced.
A closer look at trends seen in designs
Core residues have a better chance of recovering the native amino acid. For example, the core of PDBID has several residues surrounding asparagine 64 that remain the same for both scoring functions [Fig. 8(A–C)]. The native core is likely well-packed with favorable hydrophobicity. The largest differences among designs are expected at the surface of the protein. While RosettaMembrane is designing toward an optimal hydrophobicity gradient so that the protein can partition in the membrane, Talaris is designing toward a soluble protein [Fig. 8(D–F)]. For this reason, many of the surface residues that were designed by Talaris are charged when the native protein would likely not tolerate multiple charged residues embedded in the membrane. As previously noted, an interesting finding was the abundance of leucine on the surface of proteins designed using RosettaMembrane. In many cases, native hydrophobic residues, such as phenylalanine at position 45 and methionine 49 [Fig. 8(D–F)], were replaced by leucine.
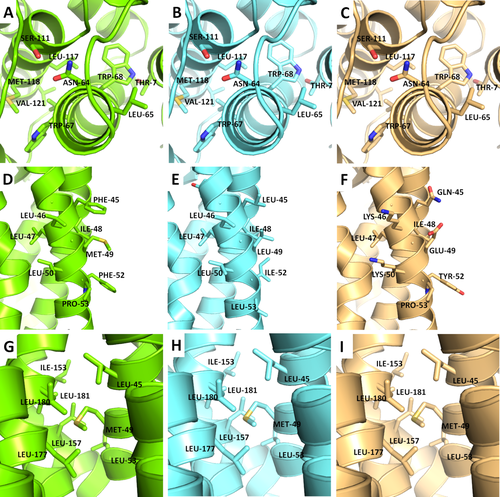
Atomic detail of designs compared to wild-type. A closer look at typical interactions at the core (A–C), surface (D–F), and homo-oligomeric interface (G–I). Representative cases were selected from PDBID (A–C), PDBID (D–F), and PDBID (G–I). Green represents respective minimized native, aquamarine is RosettaMembrane, and light orange is Talaris.
In homo-oligomers, the surface and core are similar to that in monomers; however, the homo-oligomers have interface regions between the subunits. The interface regions should be designed similarly to the core in that they are surrounded by neighboring residues, provided that distance is close enough to be considered buried, despite those residues residing on a different chain. As expected, these regions, when well packed, will remain the native amino acid for both scoring functions [Fig. 8(G–I)].
RosettaMembrane designs membrane proteins that capture native-like properties. We have reported in silico sequence redesign experiments using two different Rosetta scoring functions. Despite having similar sequence recoveries (Fig. 2), Talaris did not, as expected, appropriately design the surface. RosettaMembrane was developed to implicitly model an appropriate hydrophobic gradient that is often seen in native membrane proteins.43 RosettaMembrane designed a hydrophobic gradient that was native-like (Fig. S10). However, an artifact of designing in RosettaMembrane was the over-use of leucine because of their high frequency at various layers in the membrane (Figs. 5 and 9).
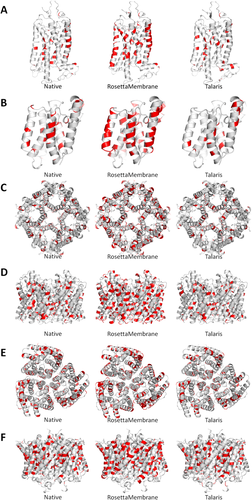
Visualization of leucine on models. Top models were selected to visualize where leucines occur in monomers PDBID (A), PDBID (B) and in homo-oligomers PDBID (C, top; D, down) and PDBID (E, top; F, down). Native structures (left) were compared to representative models of proteins designed using RosettaMembrane and Talaris. RosettaMembrane designs proteins with an abundance of leucine at multiple layers of the membrane and surface residues. In homo-oligomers, leucine is also seen in regions that are buried at the interface between subunits and in the core of the protein.
Also indicative of a native-like surface, the ΔGtransfer was above or near native for RosettaMembrane designs, whereas Talaris designs were near zero (Figs. 6 and 7). Interestingly, although both scoring functions resulted in a similar amino acid composition [Fig. 3(A,B)], the difference in composition of amino acid properties made it evident that RosettaMembrane designed in amino acids that were aliphatic, charged, or long and flexible more realistically [Fig. 3(D–F)]. Additionally, when evaluating PSSM recovery, RosettaMembrane's strength was recovering hydrophobic residues such as isoleucine, leucine, valine, and phenylalanine (Fig. 6). Despite both of the scoring functions resulting in similar amino acid composition, design using RosettaMembrane results in membrane protein designs with more native-like properties.
RosettaMembrane and symmetry can be used in conjunction to model obligate homo-oligomeric membrane proteins
Because many membrane proteins are functional as homo-oligomers, it is important the RosettaDesign algorithm works well with RosettaSymmetry so that both the internal energy of all subunits and interface interactions are taken into account during the design process. RosettaSymmetry is ideal for larger, symmetric systems because the subunits in homo-oligomers are moved in the same way, which enables the sampling process to rapidly occur. The homo-oligomeric set performed similarly to the monomeric set in amino acid composition and slightly better in recovering native-like properties. To ensure this comparison was not an artifact of the sets of proteins, the homo-oligomeric set was modeled as monomers in a separate design experiment. This revealed that although the patterns for amino acid composition were similar, the monomeric representation deviated further from the native [Fig. 3(B,C)] indicating that homo-oligomeric modeling result in more native-like designs.
Conclusion
This study illustrates that with minimized structures, membrane proteins have core sequence recovery rates of 52–63% for monomeric membrane proteins and 53–65% for homo-oligomeric membrane proteins. These rates are similar to the 51% core sequence recovery rates calculated from a large soluble protein set.44 The chance of designing a position with the correct amino acid identity is roughly 5% (selecting the correct amino acid out of 20), so a recovery of approximately 50% indicates the algorithm is working well. Increasing sequence recovery even further would involve extensive backbone minimization and/or an improved scoring function. We find that PSSM recovery (here averaging around 70%) is a more reliable metric because the recovery tolerates mutations that have been seen in evolution. Additionally, to avoid minimizing structures that imprint the native sequence, we recommend using CSC to prepare structures for design as this reduces backbone RMSD from native during minimization and still achieves moderately high sequence recovery for a range of starting resolutions.
While RosettaMembrane designs native-like surface hydrophobicity, it is important to note that RosettaMembrane has a tendency to favor leucine over other hydrophobic residues at these positions. This may be due to high occurrence of leucine for proteins in the original training set. An updated RosettaMembrane scoring function with a larger, more diverse, and higher resolution membrane protein knowledge-base may help dampen this bias. Finally, as membrane protein structures have varying membrane thicknesses, an accurate depiction of the hydrophobicity gradient during modeling and design of membrane proteins in Rosetta could improve the quality of native-like designs even further.
Methods
A set of 20 membrane proteins with resolutions ranging from 0.88 to 3.4 Å was compiled. Twelve of these membrane proteins are modeled as homo-oligomers (Table S1). All of the coordinates were obtained from the PDB. Solvent and ions were excluded for the duration of this study. Span files that specify the trans-membrane spanning region were created using information obtained from the protein data bank of transmembrane proteins (PDBTM).55 The symmetry definition files were created using the noncrystallographic symmetry mode in the make_symmdef_file.pl script provided in Rosetta. This mode calculates the point symmetries using the homo-oligomers present in the PDB file, or from symmetry mates generated in Pymol from the original PDB file. The RosettaScripts eXtensible markup language (XML) scripting language framework33 from the Rosetta week 52 build was used for all of the protocols tested. The Rosetta software suite is publically accessible and free for noncommercial use.
Preminimization trials
Five minimization protocols were tested on this benchmark set: pack-only where the backbone is not perturbed and only the side-chains conformations are optimized; minimize with constraints (MWC) where harmonic constraints are used to minimize both the backbone and side-chains to within 0.5 Å of the starting position56 (used to prepare structures for thermostability calculations57); FastRelax with an added CSC which is similar to MWC, but ramps the weight of the repulsive term to allow for more flexibility. FastRelax, the standard minimization protocol; and DualSpace relax58 which uses a combination of internal and Cartesian minimization. Three of these protocols, CSC, FastRelax, and Dualspace, were set up using the FastRelax mover in Rosetta Scripts and can also be set up using the relax application by including command-line options appropriate for each protocol. For pack-only and MWC, the appropriate applications and options were used (please see a complete, detailed protocol capture in Supporting Information, parts 1a, 1b).
Full redesign to assess preminimized structures
Full redesign, where all canonical amino acids identities are allowed to be sampled at each position, was performed on the preminimized membrane protein sets. For each minimization protocol, two to three top models by score and RMSD for each membrane protein were chosen as the input models for full redesign to introduce backbone diversity. Full redesign was set up using PackRotamersMover and the SymPackRotamersMover, where appropriate, to generate design models of each minimized model. The top ten percent models by score were chosen for sequence recovery analysis (protocol capture, Supporting Information, parts 1a, 1b).
Full redesign using various scoring functions
Full redesign was performed on the top three models by score and RMSD from the CSC protocol. The scoring functions tested were the RosettaMembrane full atom smoothed potential (membrane_highres_Menv_smooth.wts) and Talaris (talaris2013.wts). Full redesign was set up using PackRotamersMover and SymPackRotamersMover, where appropriate, to generate design models from each selected minimized model. The top scoring ten percent models were used to calculate sequence recovery of the native protein sequence (protocol capture, Supporting Information, parts 2a, 2b).
Sequence analysis of redesigned proteins
The top 10% of designs by score were analyzed. Native sequence recovery was calculated for the full protein, core residues (a residue with at least 24 contacts within a C-β distance of 10 Å), and surface residues (a residue with at most 16 contacts within a C-β distance of 10 Å) using the Sequence Recovery application in Rosetta. Additionally, we determined whether the scoring functions reproduced native-like amino acid composition.


