The SubCons webserver: A user friendly web interface for state-of-the-art subcellular localization prediction
Abstract
SubCons is a recently developed method that predicts the subcellular localization of a protein. It combines predictions from four predictors using a Random Forest classifier. Here, we present the user-friendly web-interface implementation of SubCons. Starting from a protein sequence, the server rapidly predicts the subcellular localizations of an individual protein. In addition, the server accepts the submission of sets of proteins either by uploading the files or programmatically by using command line WSDL API scripts. This makes SubCons ideal for proteome wide analyses allowing the user to scan a whole proteome in few days. From the web page, it is also possible to download precalculated predictions for several eukaryotic organisms. To evaluate the performance of SubCons we present a benchmark of LocTree3 and SubCons using two recent mass-spectrometry based datasets of mouse and drosophila proteins. The server is available at http://subcons.bioinfo.se/
Abbreviations
-
- CYT
-
- cytoplasm
-
- ERE
-
- endoplasmic reticulum
-
- EXC
-
- extracellular
-
- GLG
-
- Golgi apparatus
-
- LYS
-
- lysosome
-
- MEM
-
- plasma membrane
-
- MIT
-
- mitochondria
-
- MSA
-
- multiple sequence alignment
-
- NUC
-
- nucleus
-
- PEX
-
- peroxisome
-
- PSSM
-
- Position-specific scoring matrix
Introduction
In eukaryotic cells proteins are located in different subcellular compartment. Localization and function of a protein are closely related. Therefore, the correct localization of proteins is crucial, and atypical subcellular localization can lead to several diseases, such as cancer1 and Alzheimer.2
To understand the system of a cell is necessary to have a complete map of subcellular proteomes. For many years, imaging3 and purification-based methods have been the most used experimental approaches.4, 5 Unfortunately, these methods are not always perfectly accurate, rather expensive and time-consuming.
In contrast, computational methods are cheaper and faster, therefore they are an important complement to experimental methods. Many localization predictors have been developed and improved since the introduction of the first signal peptide predictor more than 30 years ago.6 Today, prediction methods for specific localization,7, 8 for a few localizations9 or for a wide range of localizations10-15 exist.
Most of the computation tools combine biological understanding on how subcellular localization work with some machine-learning algorithm, including deep learning.16 They can roughly be divided into sequence- or annotation-based methods. Sequence-based methods use co- and post-translational targeting signals, linear motifs detections, amino acid distributions, gapped-paired, surface or pseudo amino acid compositions to predict the localization from the sequence directly. In contrast, annotation-based methods use annotations from databases including localization of homologous protein(s), annotated gene ontology terms, functional domains, text information from PubMed abstracts and protein-protein interactions.17 The most successful methods use a combination of both the approaches.
Most of these tools were developed using subcellular annotations from UniProt.18 Therefore, the evaluation of the performance is difficult, as there is often an overlap between training and test sets.19 In contrast to most other methods, SubCons was developed using data from a “golden dataset” consisting of only proteins with two confirmatory experimental evidences in either UniProt or in recent large-scale experimental studies of human cells.3-5
Some of the best tools are not easily accessible for the general scientists, either due to computational requirements or due to licensing. Therefore, for most users web-based tools is the best method to access subcellular prediction tools. However, a limitation of most web-based tools is that they do not scale, i.e. they cannot be used for proteomic wide predictions. Here, we present the SubCons web server, a web interface based on the SubCons algorithm that predicts nine subcellular localizations, combining four predictors using a Random Forest classifier.19 SubCons provide rapid, and accurate predictions by using a fast approach to generate PSSMs as introduced earlier in TOPCONS,20 but also provides the user the option to submit entire proteomes.
In addition to presenting the web-server we also demonstrate the good performance of SubCons using two novel mass spectrometry datasets of mouse and drosophila proteins.21, 22 We compare the performance in these dataset with the state of the art method, LocTree3.23
Results and Discussion
Instructions for SubCons
The SubCons web server has an user-friendly environment see Figure 1. The input to the server can either be one amino-acid sequence or a file with multiple sequences in FASTA-format that will be processed in due time. It is possible to submit up to 10,000 proteins to the server. To facilitate proteome-wide assignments, we have also developed a standard WSDL interface for programmatic access to the server.
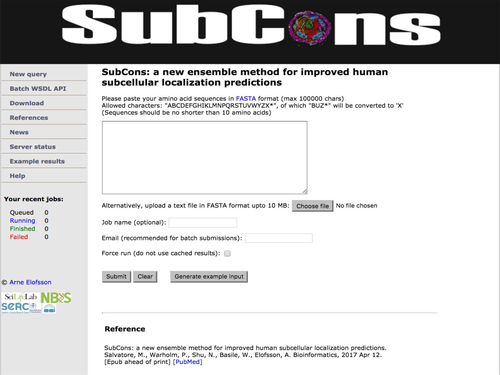
The SubCons web page. The image shows the SubCons web interface that can be used to run single or multiple fasta sequences. The users can either paste the sequence(s) or upload a file containing the protein sequence(s). Providing an email address the user can receive a notification when the job is finished. In the download section, we provide precalculated localization prediction for organisms including Danio rerio, Caenorhabditis elegans, Gallus domesticus, Drosophila melanogaster, Mus musculus, and Homo sapiens.
Today, many tools in Bioinformatics use profiles/PSSMs. Profiles are often obtained by searching large sequence database such as Uniprot18 with PSI-BLAST.24 However, the rapid increase of database sizes slows down the search so that it usually takes up to several minutes. Clearly, this is a bottleneck for a web-server, where in general a user expects a quick response. To improve the response time we are using PRODRES20 a method that often speeds up a typical PSI-BLAST search one order of magnitude, for details see the methods section. Currently the average time to run a single protein in the web-server is a few minutes, depending on the overload of the server. Result will appear immediately if the subcellular localization of the protein has been predicted before, as the server caches the predictions.
SubCons output
Users can analyze results either graphically on the screen see Figures 2, 3 and 4 and/or download the predictions in plain-text format. Moreover, if provided, results can be sent via email. The results show the prediction score for each of the nine subcellular localizations (CYT, ERE, EXC, GLG, LYS, MEM, MIT, NUC, PEX) both for SubCons (SubCons-RF-Score) and the other tools (CELLO2.5, MultiLoc2, and SherLoc2). To note, LocTree2 provides only single localization, thus we can show only the score for the predicted localization.
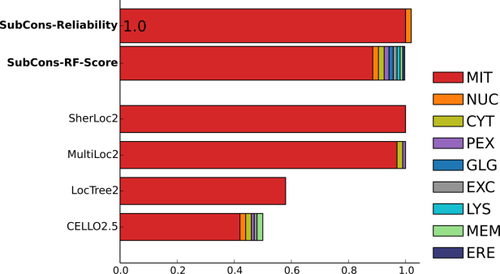
Graphical example output of SubCons. The example shows results for the protein P10515 (ODP2_HUMAN) that is a component of pyruvate dehydrogenase complex in mitochondria.
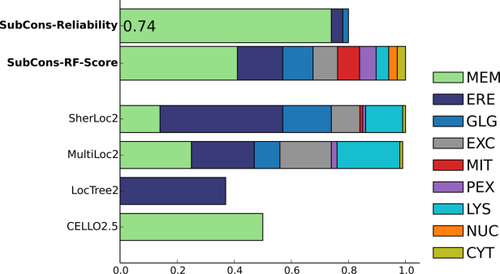
Graphical example output of SubCons. The example shows results for the protein B9EJG8 (T150C_HUMAN) that is a transmembrane protein. This is a typical case in which is very hard to define the correct localization since all the tools have the different prediction. In this scenario, a consensus prediction is more powerful in identifying the exact localization.
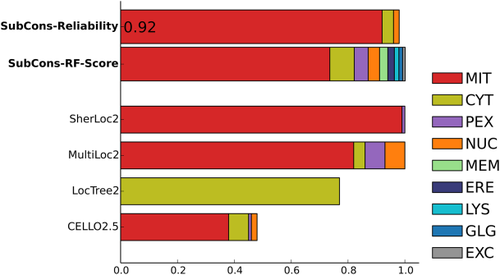
Graphical example output of SubCons. The example shows results for the protein P36552 (HEM6_MOUSE) that is a component oxygen-dependent coproporphyrinogen-III oxidase in mitochondria. Even though SubCons has been trained only using human proteins, it is able to rich high level of reliability and similar to the other tools.
The predicted localization probabilities of SubCons are computed as the mean predicted class probabilities of each tree in the forest. However, the score from classes are not directly related to the reliability of the prediction. Therefore, SubCons output shows a reliability score of the predicted class (SubCons reliability), calculated from the ROC curve describing the relationship between score and prediction accuracy for each subcellular localization see Figure 5.19
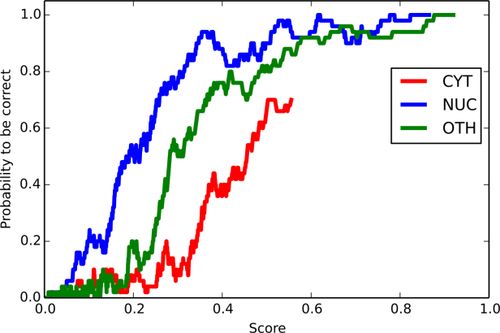
Curve to attest the SubCons reliability scores using the average precision of the first 50 top scores from the ROC curve calculated in 19. The figure shows the curves for the classes CYT (red), NUC (blue) and OTH (green). The class OTH combines altogether the scores for ERE, EXC, GLG, LYS, MEM, MIT, and PEX.
SubCons database
For convenience we also provide precalculated localization prediction for organisms including Danio rerio, Caenorhabditis elegans, Gallus domesticus, Drosophila melanogaster, Mus musculus, and Homo sapiens.
Benchmark dataset
SubCons was originally trained using only human proteins. Here, we have tested the performance of SubCons on two independent mass-spectrometry datasets.21, 22 A mouse and drosophila datasets which have at most 20% sequence identity to proteins in the same sets and in the SubCons training data set. We compare SubCons with LocTree3, another state-of-the-art subcellular localization predictor that largely transfers its predictions directly from Uniprot. Due to this it is not feasible to compare the predictors on Uniprot directly.
Mouse dataset
From Table 1, it can be seen that the dataset is clearly biased towards mitochondrial proteins with more than 40% of the proteins classified to be mitochondrial. This bias does not seem to severely affect any of the predictors as they accurately estimate the correct number of mitochondrial proteins.
| Loc | Mass-Spec | LocTree3 | SubCons |
|---|---|---|---|
| NUC | 17% | 22% | 13% |
| CYT | 14% | 19% | 25% |
| MIT | 44% | 39% | 43% |
| PEX | 2% | 1% | 2% |
| ERE | 5% | 6% | 4% |
| GLG | 0% | 2% | 0% |
| LYS | 5% | 0% | 4% |
| MEM | 10% | 5% | 8% |
| EXC | 1% | 6% | 2% |
- Here, we show the number of predicted localizations by LocTree3 and SubCons based on the experimental proteins of the mouse dataset.
However, there are some small differences in the number of proteins predicted by the two methods when compared with the experimental dataset. Both prediction methods overpredict cytoplasmic and extracellular proteins and underpredict membrane proteins, see Table 1.
As described in SubCons,19 we evaluate the results for single location using the F1 score25 (F1) and Matthews correlation coefficient (MCC).26 For the evaluation of the performance over all subcellular locations, we use the generalized squared correlation (GC2)27 as well as F1 score, which in the multiclass case, is defined as the weighted average of the F1 score for each class.19
In Table 3, we show the performance of SubCons and LocTree3 using two different measures. In general the two methods perform on par, the F1 score is similar, around 80%. However, using GC2, that is less dependent on an uneven distribution, we observed that the performance of SubCons appears slightly better (0.47 vs. 0.43). The difference in performance between the two predictors is mainly due to the inability of LocTree3 to predict lysosomal proteins. Therefore, we estime that the overall performance of the two individual predictors is similar, but it varies for different subcellular compartments.
It can be observed that the F1-score of LocTree3 is higher than SubCons for nuclear, cytosolic, and endoplasmic reticulum, while SubCons shows a better performance for membrane, mitochondrial and extracellular proteins, see Table 3. This indicates that there is sometimes a balance between performances in different compartments. Both methods perform equally for mitochondrial protein. SubCons predict lysosomal proteins, with an F1-score of 82%, while Loctree3 cannot predict this class at all. Both predictors perform best for mitochondrial, endoplasmic reticulum and nuclear proteins. It can also be noted that no Golgi proteins are present in the examined dataset.
Benchmark on a Drosophila dataset
Table 2 shows that the dataset is clearly biased towards membrane proteins with 49% of all entries in this class compared to an estimate of 20–30% of a typical genome.28 It can also be seen that both SubCons and LocTree3 over-predict cytoplasmic and under-predict membrane proteins, see Table 2.
| Loc | Mass-Spec | LocTree3 | SubCons |
|---|---|---|---|
| NUC | 6% | 12% | 9% |
| CYT | 17% | 42% | 42% |
| MIT | 16% | 14% | 19% |
| PEX | 1% | 1% | 2% |
| ERE | 7% | 9% | 6% |
| GLG | 3% | 5% | 2% |
| LYS | 1% | 0% | 1% |
| MEM | 49% | 8% | 17% |
| EXC | 0% | 9% | 2% |
- Here, we show the number of predicted localizations by LocTree3 and SubCons based on the experimental proteins of the drosophila dataset.
| Loc | # | LocTree3 | MCC | SubCons | MCC |
|---|---|---|---|---|---|
| F1 | F1 | ||||
| NUC | 109 | 0.87 | 0.85 | 0.75 | 0.72 |
| CYT | 90 | 0.72 | 0.67 | 0.62 | 0.56 |
| MIT | 277 | 0.92 | 0.87 | 0.93 | 0.88 |
| PEX | 13 | 0.73 | 0.74 | 0.75 | 0.75 |
| ERE | 34 | 0.86 | 0.86 | 0.77 | 0.78 |
| GLG | 0 | 0 | 0 | 0 | 0 |
| LYS | 33 | 0 | 0 | 0.82 | 0.83 |
| MEM | 64 | 0.54 | 0.53 | 0.55 | 0.5 |
| EXC | 9 | 0.31 | 0.37 | 0.7 | 0.71 |
| # | F1 | GC2 | F1 | GC2 | |
| Overall | 629 | 0.78 | 0.43 | 0.8 | 0.47 |
- The table shows the performance in the mouse data set yield by LocTree3 and SubCons in terms of F1 score and generalized correlation coefficient. Moreover, the table shows the fraction of correct predictions, in terms of F1 score and Matthews correlation coefficient, for each of the nine standard localizations.(# = proteins in the dataset for each localization, GC2 = generalized correlation coefficient, F1 = F1 score, and MCC = Matthews correlation coefficient.
The F1 score of SubCons is slightly better (55%) than LocTree3 (48%), while the opposite is seen when using GC2, 0.42 for LocTree3 vs. 0.37 for SubCons. Even in this dataset the overall performance of the two predictors is similar, but it differs for different subcellular compartments.
Looking at F1 score for individual compartments, it is clear that LocTree3 is better than SubCons for lysosomal, cytosolic, mitochondrial, endoplasmic reticulum, and peroxisomal proteins, see Table 4. On the other hand, SubCons shows a better performance for membrane proteins and both methods perform similarly for nuclear proteins. Finally, it can also be noted that no extracellular proteins are present in this dataset.
| Loc | # | LocTree3 | MCC | SubCons | MCC |
|---|---|---|---|---|---|
| F1 | F1 | ||||
| NUC | 11 | 0.65 | 0.67 | 0.64 | 0.63 |
| CYT | 33 | 0.5 | 0.4 | 0.39 | 0.23 |
| MIT | 30 | 0.81 | 0.77 | 0.78 | 0.73 |
| PEX | 2 | 1 | 1 | 0.67 | 0.7 |
| ERE | 13 | 0.73 | 0.72 | 0.67 | 0.65 |
| GLG | 5 | 0.71 | 0.74 | 0.5 | 0.51 |
| LYS | 2 | 0 | 0 | 0.67 | 0.71 |
| MEM | 94 | 0.29 | 0.31 | 0.5 | 0.44 |
| EXC | 0 | 0 | 0 | 0 | 0 |
| # | F1 | GC2 | F1 | GC2 | |
| Overall | 190 | 0.48 | 0.42 | 0.55 | 0.37 |
- The table shows the performance in the drosophila data set yield by LocTree3 and SubCons in terms of F1 score and generalized correlation coefficient. Moreover, the table shows the fraction of correct predictions, in terms of F1 score and Matthews Correlation Coefficient, for each of the 9 standard localizations.(# = proteins in the dataset for each localization, GC2 = generalized correlation coefficient, F1 = F1 score, and MCC = Matthews correlation coefficient.
Conclusions
Here, we introduce the SubCons web server—a state of the art method for subcellular localization. SubCons can be helpful to understand the localization of a protein, in particular as it scales to complete genomes. In addition to providing state of the art predictions, a confidence score rates the reliability of a prediction enabling the user to evaluate the reliability of the prediction. We believe that SubCons should be a valuable resource for protein scientists.
We do also provide a comparison of SubCons19 and LocTree323 using two recent mass spectrometry datasets.21, 22 Here, it is shown that the overall performance is similar but differs for different subcellular compartments.
Materials and Methods
Dataset used in this study
SubCons was originally trained only using human proteins as described earlier.19 Here we investigate the performance of SubCons and LocTree3 in two datasets of mouse and drosophila proteins derived from mass spectrometry studies using the hyperLOPIT method.4, 21
The initial mouse and drosophila datasets contains 885 and 203 proteins, respectively. After homology reduction at 20% sequence identity using BLASTClust29 629 mouse and 190 drosophila proteins remained.
Both the datasets were originally generated using a combination of mass spectrometry, biochemical fractionation, and iTRAQ 8-plex.4 We retrieved all the experimental protein localizations using the pRloc package (www.bioconductor.org/packages).
The original datasets4, 22 provides subcellular localizations at different resolution see supplementary table in Ref.,19 therefore, to make comparisons feasible we have mapped all subcellular classifications into nine standard compartments (CYT, ERE, EXC, GLG, LYS, MEM, MIT, NUC, PEX). The composition of the mapped dataset is showed in Table 1. Here, it is evident that mitochondrial proteins represent the most present class (44%), followed by nuclear (17%), cytoplasmic (14%) and membrane (10%) proteins. The presence of other localization varies between 1 and 5%. It can also be noted that no Golgi apparatus proteins are present. On the other hand, in the drosophila it is evident that membrane proteins represent the most present class (49%), followed by cytoplasmic (17%), mitochondrial (16%), endoplasmic reticulum (7%), and nucleus (6%) proteins. The presence of other localization varies between 1 and 3%.
The SubCons algorithm
To increase the number of proteins of known localization and to train SubCons, we used two experimentally verified data sets19 and manually reviewed localizations from UniProt (www.uniprot.org).18
In SubCons, the scores of the predictors are combined into a vector of 36 values (4 predictors times 9 “standard” localizations).19 LocTree2 provides only single localization, thus we use the predicted score for the predicted class and 0 for all other classes. On the other hand, CELLO2.5, MultiLoc2, and SherLoc2 provide a score for each localization, that we could directly use. This vector is thereafter used as an input for a Random Forest classifier30, 31 implemented using the Scikit-learn library,32 see Figure 6.
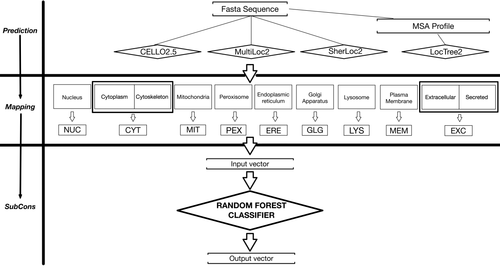
The figure shows the SubCons workflow. SubCons combines predictions from four predictors using a Random Forest classifier. These tools can either accept a fasta sequence(s) (CELLO2.5, MultiLoc2 and SherLoc2) or a fasta plus an MSA profile (LocTree2). The latest is constructed using PRODRES. The predicted localizations are first mapped to a standard 3 letters code. Thereafter, a vector of 9 × 4 values is used as an input for a Random forest classifier that output 9 values (one for each class). The value of each class corresponds to the average score of the class into the forest.
To generate the PSSM profile required by LocTree2,11 we use PRODRES a tool developed in our lab that first scans a query sequence(s) against the Pfam database and then use all the full-length sequences to create a query-specific database that is further scanned for homologous proteins.20 Importantly, if no hits are found, PRODRES uses Psi-Blast24 to generate the PSSM profile20
LocTree3
LocTree3 is a further step of methods based on sequence homology and on the assumption that a protein tends to stay in the same compartment in the course of evolution. It is not trivial to determine how similar a pair of proteins has to be in order to infer the possible subcellular localization. Using sequence alignment programs such as BLAST, it is possible to transfer the subcellular localization annotation from the best hit to the query, or in another word to infer subcellular localization from the annotation of homologs which do not necessarily have experimentally known subcellular localization.17
LocTree3 combines homology search information when available and all the features used in LocTree2.11
The annotated localizations are transferred by homology using PSI-BLAST.24 For all proteins with experimentally known localization, a PSI-BLAST profile24 is generated, using an 80% nonredundant database combining UniProt18 and PDB.33 These profiles are then aligned against all proteins with experimental annotation of a single localization. PSI-BLAST24 hits to the input protein are excluded.23
Acknowledgments
This work has been supported by the Sven och Lilly Lawski's fond för naturvetenskaplig forskning, the Swedish Research Council (VR-NT 2012–5046) and the Swedish E-science Research Center.
Conflict of interests
No conflict of interests is declared.


