Urinary Proteomics as a Tool to Identify Kidney Responders to Dipeptidyl Peptidase-4 Inhibition: A Hypothesis-Generating Analysis from the MARLINA-T2D Trial
See accompanying commentary by Alberto Ortiz, https://doi.org/10.1002/prca.201900004
Abstract
Purpose
Chronic kidney disease (CKD) is a serious complication of hyperglycemia and treatment options to slow its progression are scarce. Dipeptidyl peptidase-4 (DPP-4) inhibitors are common glucose-lowering drugs in type 2 diabetes (T2D). Among these, linagliptin has been suggested to exert kidney protective effects. It is investigated whether an effect of linagliptin on kidney function could be unmasked by characterizing the urinary proteome profile (UPP) in albuminuric T2D individuals.
Experimental design
Participants of the MARLINA-T2D trial (NCT01792518) are randomized 1:1 to receive either linagliptin 5 mg or placebo for 24 weeks. A previously developed proteome-based classifier, CKD273, is assessed.
Results
Results confirm a significant correlation between CKD273 and clinical kidney parameters as well as with eGFR decline. Patient stratification using CKD273 at baseline, show a trend toward attenuation of renal function loss in high CKD-risk patients treated with linagliptin. Moreover, characterized are linagliptin affected peptides of which the majority contained a DPP-4 target sequence.
Conclusions and clinical relevance
CKD273 is a promising tool for identifying patients at high risk for CKD progression and may unmask a potential of linagliptin to slow progressive kidney function loss in high CKD-risk patients. UPP characterization reveals a significant impact of linagliptin on urinary peptides.
1 Introduction
The prevalence of people living with type 2 diabetes (T2D) has reached an epidemic dimension and numbers are expected to further rise. Controlling hyperglycemia remains one of the mainstays in diabetes treatment and despite controversies elicited by recent clinical trials, tight regulation of glycemia has been shown to prevent progression of microvascular complications1 and, with more controversial evidence, macrovascular2 complications after long-term follow-up in T2D. However, glucose control remains suboptimal in most patients with diabetes.3 The classical armamentarium of pharmaceutical interventions for glycemic control addresses insulin resistance, glucose absorption, insulin secretion, repletion of endogenous insulin or glucagon-like peptide 1 (GLP-1), respectively, by injections, removal of excess glucose by inducing sustained glucosuria (SGLT2 inhibitors), or increase of endogenous GLP-1 levels by preventing its break down by a specific protease.
Inhibition of dipeptidyl peptidase-4 (DPP-4) significantly increases endogenous GLP-1 levels, with an ensuing augmentation of insulin secretion in a glucose-dependent manner.4 Several groups of chemical substances have been identified as possible inhibitory ligands for the catalytic site on the DPP-4 molecule. Linagliptin is a selective and highly potent DPP-4 inhibitor with a xanthine-based molecular structure, and is indicated for the treatment of T2D.5 In vitro inhibition of DPP-4 by linagliptin was first described by Thomas and colleagues.6 The glucose-lowering efficacy of linagliptin has been demonstrated in a range of clinical trials of patients with T2D.7-9 The safety and tolerability of linagliptin has also been established during its clinical development; a recent pooled analysis of 22 randomized, double-blind trials of linagliptin showed that the frequency of adverse events was overall similar for linagliptin- and placebo-treated patients across a broad range of patients, including elderly subjects and individuals across the range of chronic kidney disease (CKD) stages and levels of impaired renal function.10
MARLINA-T2D, was a Phase IIIb, multicentre, multinational, randomized, double-blind, placebo-controlled, parallel group study to evaluate the glycemic efficacy of once daily administration of linagliptin (5 mg for 24 weeks) in 360 T2D patients with insufficient glycemic control and concomitant micro- or macroalbuminuria (30–3000 mg/g creatinine), despite current standard treatment for diabetic kidney disease (DKD, single agent ACEi or ARB). The key secondary endpoint in MARLINA-T2D was defined as change in urinary albumin creatinine ratio (UACR) from baseline to study end. After 24 weeks, linagliptin was associated with a significant −0.6% (95% confidence interval [CI] −0.78 to −0.43, p < 0.0001) reduction in HbA1C versus placebo. Change in albuminuria, however, was not significantly lower with linagliptin versus placebo11 (−6.0% [95% CI −15.0 to −3.0; p = 0.1954]).
The measurement of proteins and peptides in biological fluids has emerged as a potential tool to discover novel markers that may help to identify subjects at risk for progressive CKD.12-14 Proteome analysis enables the detection of short and long-term physiological or pathological changes occurring in chronic conditions such as T2D. Such an approach may also be used for to the discovery of novel peptides that predict response to specific drug interventions. We have developed a capillary electrophoresis coupled to mass-spectrometry (CE-MS) platform that allows measurement of thousands of peptides to discover specific proteins that may predict response to therapy as well as peptides that may change as a result of the treatment.15, 16 Using this technique, we have previously established a urinary multipeptide classifier, CKD273.17 This score has been shown to identify early signs of kidney disease in patients with diabetes,18-20 to predict progression in CKD.21-23as well as to predict treatment response to spironolactone in T2D diabetes patients and hypertension.24
The aim of this exploratory study presented here was to investigate associations of the CKD273 with i) kidney relevant clinical parameters at baseline and with ii) the risk of progressive kidney function loss over 24 weeks in the well characterized MARLINA-T2D cohort of T2D patients with early stages of DKD.
Whereas the first aim would confirm previous reports on the CKD273 the second aim addressed novel hypotheses: our first main hypothesis was that the CKD273 may yield potential to identify a subgroup of patients with a particular beneficial renal response to linagliptin treatment. Our second main hypothesis was that linagliptin treatment would induce significant changes within the urinary proteome profile (UPP) and we were seeking to decipher specific patterns after treatment. In a third hypothesis, we postulated that the UPP might inform on the activity of urinary DPP-4, and consequently on the kidney DPP-4 inhibition by linagliptin in patients with T2D.
2 Experimental Section
2.1 Patients and Sample Collection
Samples were derived from the completed MARLINA-T2D study (NCT NCT01792518) and the study design, methodology and key results have been reported.11, 25 In brief, 360 T2D patients with prevalent albuminuria (30–3000 mg/g) despite stable background RAS blockade that met the eligibility criteria after a 2-week placebo run-in period, were randomized 1:1 to receive double-blind, once-daily oral treatment with linagliptin 5 mg or placebo (on top of recommend standard of care for DKD) for 24 weeks. Urine samples available for proteome analyses were collected after the placebo run-in period (i.e., at baseline) and after the 24 weeks of treatment (end of study) according the standardized study procedures as reported.26 Both urine samples were available for 89.7% (n = 323) of the total study population. Estimated glomerular filtration rate (eGFR) and UACR levels were analyzed every 6 weeks during study conduct. The study was designed and conducted in accordance with the standards of good clinical practice and principles of the Helsinki Declaration. Written informed consent was obtained from all participants. MARLINA-T2D was approved by independent ethics committees institutional review boards at each participating centre.
Clinical Relevance
Diabetic kidney disease (DKD) is the leading cause of end-stage kidney disease (ESKD) worldwide. Mechanisms of disease onset and progression are not fully elucidated. Although several treatment options exist, risk of ESKD remains increased with significant challenges in patient clinical management. For complex conditions like DKD, frequently characterized by clinical heterogeneity between affected individuals, a personalized patient management is desired to reach optimized treatment response.
In this study, we evaluated the clinical utility of the urinary peptide-based CKD273 classifier in the multicentre, randomized MARLINA-T2D trial. The study cohort was previously established to assess the efficacy and safety of a DPP-4-inhibitor, linagliptin, in patients with type 2 diabetes (T2D) and albuminuria. Our results show a significant association of CKD273 with markers of both, DKD prevalence, and progression at study baseline. Our key finding is that, despite no change in glomerular filtration rate between linagliptin and placebo in the overall study population of MARLINA-T2D, stratification of the cohort according to low and high CKD273 scoring unmasked a trend toward attenuation of renal function loss in the high risk patients treated with linagliptin. This data indicate clinical potential to use CKD273 for patient risk stratification, which could further support personalized interventions. Stratification by CKD273 shows potential to identify patients that may benefit from linagliptin treatment, by reducing chronic renal function loss. Our hypothesis generating data warrants further clinical research for identifying personalized treatment options for patients with T2D at risk for progressive kidney disease.
2.2 Urinary DPP-4 Activity
The DPP-4 assay was carried out using 10 µL human urine. Briefly, 40 µL of buffer containing 100 mm Tris and 100 mm NaCl, pH 7.8 was transferred to 10 µL urine. Subsequently, 50 µL Ala-Pro-AFC (H-Ala-Pro-7-amido-4-trifluoro-methylcoumarin) with a final concentration of 100 µ µm was added and incubated for 60 min at room temperature. The AFC release was measured using SpectraMax M5 fluorescence microplate reader (Molecular Devices) at 405 nm excitation/535 nm emission respectively. Urinary DPP-4 activity was normalized to urinary creatinine.
2.3 Urinary Proteome Analysis
Urine samples were prepared and analyzed using a P/ACE MDQ capillary electrophoresis system (Beckman Coulter, Fullerton, USA) on line coupled to a MicroTOF MS (Bruker, Bremen, Germany) described previously in detail.27 The MosaiquesVisu software was used for data evaluation.28 Accuracy, precision, selectivity, sensitivity, reproducibility, and stability of the CE-MS method have been previously described.29 Internal standard peptides were used for calibration, as previously described.30 All detected peptides were deposited, matched, and annotated in a MicrosoftSQL database, allowing for further analysis and comparison between groups.
To assess the CKD273 score a previously generated classifier was used.17 CKD273 is a support vector machine-based classification model that allows the classification of samples in a high-dimensional parameter space using MosaCluster software (version 1.7.0).31, 32 MosaCluster calculated classification scores are based on amplitudes of identified biomarkers within CKD273. Technicians performing proteomics analyses were blinded in terms of treatment allocation and study endpoints. To retrieve amino acid sequences of identified peptides, the Human Urinary Proteome Database, version 2.0.33 was utilized and respective peptides from this database were sequenced, as previously described.33, 34
2.4 Statistical Analysis
CKD273 scores, eGFR, and UACR values were not normally distributed, and therefore a nonparametric Spearman's rank correlation coefficient was used for estimating respective correlation coefficients by MedCalc (version 12.1.0.0, http://www.medcalc.be; MedCalc Software, Mariakerke, Belgium).35 GFR slopes calculation based on within-patient regression analysis using all available eGFR values estimated between the baseline and follow-up visit. Renal function loss was defined based on calculated eGFR % slopes per year. These eGFR slopes served as a dependent variable in multiple regression analyses and the additional predictive value of the CKD273 was estimated on top of relevant baseline covariates (UACR and eGFR, independent variables). To exclude potential bias introduced by linagliptin treatment, in this analysis, only data of 155 patients treated with placebo were used. The eGFR values between the linaglitin and placebo-treated groups were compared using the nonparametric Mann–Whitney test. A paired Wilcoxon test was used to analyze the eGFR changes before and after linaglitin or placebo treatment (MedCalc35).
To identify peptides significantly altered by linagliptin treatment, UPP from baseline and follow-up samples were compared. Statistical analysis was performed using non-parametric Wilcoxon rank sum test. Only peptides that were present at a frequency of 30% or higher in either baseline or follow-up samples were investigated, ensuring that altered peptides were not biased by preanalytics and/or potential population-specific genetic variability. A false discovery rate adjustment of Benjamini–Hochberg36 was employed to correct for multiple testing. In addition, a correlation analysis between baseline peptide amplitude (signal intensity) and follow-up DPP-4 peptidase activity (µg/g urine creatinin) was performed also by MedCalc35 using Spearman's rank correlation analysis. Overall, a p-value < 0.05 was considered to be statistically significant.
3 Results
For 323 patients (89.7%) of the total MARLINA-T2D population two urine samples were available for our study (baseline and 24 weeks). Baseline clinical data were available for 319 patients. Thereof, data for three end-of-study samples did not pass quality control for CE-MS data standards and were excluded from subsequent analyses. Baseline and follow-up characteristics of the study population are given in the Table S1, Supporting Information.
3.1 Urinary CKD273 Classification Score and Parameters of Kidney Disease at Baseline
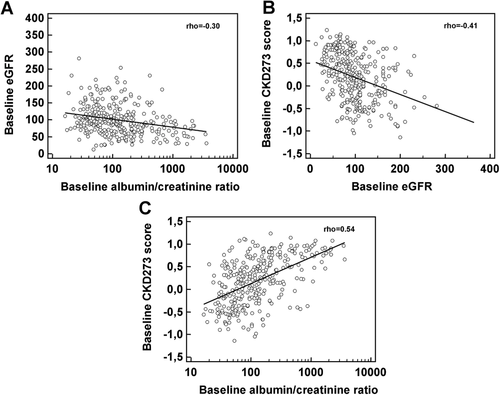
As expected in our cross-sectional analyses, the MARLINA-T2D cohort confirmed previous results from other cohorts reporting a significant correlation between eGFR and UACR values at baseline (rho = −0.30; Figure 1A). Moreover, we confirmed previous reports of a significant, inverse correlation between the CKD273 and eGFR (rho = −0.41; Figure 1B) and a positive correlation of the CKD273 with UACR (rho = 0.54; Figure 1C).
3.2 Urinary CKD273 Classification Score and Prediction of CKD Progression after 24 Weeks
In the next step, we aimed to explore whether CKD273 could predict CKD progression in MARLINA-T2D, as previously described in several cohorts of patients with CKD stages 1–4.20, 22, 23, 37 To exclude potential bias introduced by linagliptin treatment, we utilized the available baseline and follow-up data of 155 patients treated with placebo and calculated the percent decrease in eGFR expressed as annual slopes as described previously.20 In order to assess if the CKD273 could independently predict CKD progression (i.e., annual eGFR decrease), this parameter was added alongside baseline UACR and eGFR as an independent variable into a multivariate regression analysis. In result, the CKD273 (p = 0.027) as well as baseline eGFR values (p = 0.015) were independently associated with progressive GFR loss.
3.3 Urinary CKD273 Classification Score and Kidney Treatment Response to Linagliptin
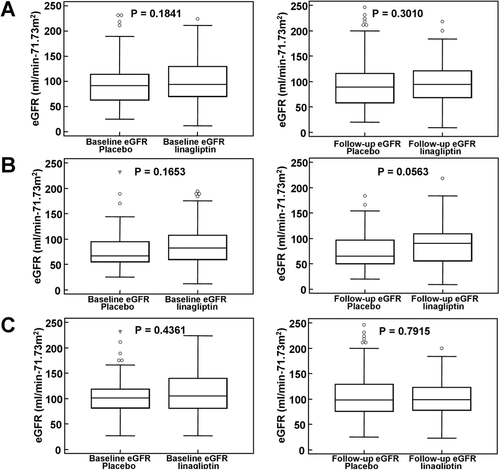
Among the total study population, the renal function, expressed as eGFR (Table S1, Supporting Information), was not significantly different between the placebo and linagliptin group at baseline (median GFR placebo: 92 mL/min /1.73 m², interquartile range [IR]: 63–114 vs median eGFR linagliptin: 95 mL/min/1.73 m², IR: 71–130, p = 0.184) and there were no clinically meaningful changes in either group after 24 weeks of treatment (median eGFR placebo: 89 mL/min/1.73 m², IR: 59–116 vs median eGFR linagliptin: 96 mL/min/1.73 m², IR: 70–121, p = 0.301) (see Figure 2A). To explore our first main hypothesis, we stratified patients according to their respective baseline CKD273 classification score into a high or low CKD progression risk group, respectively (cut-off 0.343, as established previously17). There were no significant differences in baseline eGFR among the high CKD-risk individuals receiving either placebo (n = 64) or linagliptin (n = 70, median eGFR placebo: 66.5 mL/min/1.73 m² [IR: 56–95] vs median eGFR linagliptin: 82.5 mL/min/1.73 m² [IR: 61–114], p = 0.165). Notably, after 24 weeks, we observed a trend toward preservation of eGFR for the linagliptin treated high CKD-risk group (median GFR: 90 mL/min/1.73 m², IR: 56–109) as compared to the high CKD-risk placebo group (median GFR: 65 mL/min/1.73 m², IR: 51–97; p = 0.0563; Figure 2B). A paired analysis of the eGFR values before and after placebo treatment resulted in a significant (p = 0.035) decrease of the renal function at study end. The observed increase of the eGFR values after linagliptin treatment at study end was not significant from matching baseline the GFR values. There again, eGFR changes did not differ between linagliptin and placebo arms for the low CKD-risk group before (median eGFR placebo: 101 mL/min/1.73 m², IR: 82–121 vs median eGFR linagliptin: 106 mL/min/1.73 m², IR: 82–140, p = 0.436) and after active treatment (median eGFR placebo: 99 mL/min/1.73 m², IR: 77–129 vs median eGFR linagliptin: 99 mL/min/1.73 m², IR: 78–126, p = 0.7915), respectively (Figure 2C). In the case of albuminuria, no differences between the linagliptin and placebo-treated group were observed before and after the treatment in the whole, low and even high CKD-risk group. Not even a trend toward significance (see Figure S1, Supporting Information) was detected.
Since it was expected that linagliptin would alter the CKD273 score, we further assessed the correlation between the CKD273 score at week 24 with eGFR values at week 24 (i.e., end of study correlation). Consistent with results at baseline, we found a significant correlation between CKD273 and eGFR for the linagliptin and placebo groups (rho = −0.360, p < 0.0001; and rho = −0.259, p = 0.0012, respectively).
3.4 Linagliptin Treatment and Changes in Urinary Proteome Profiles
To test our second main hypothesis, we compared the UPP of n = 163 and n = 153 individuals treated with either linagliptin or placebo, respectively after 24 weeks. Comprehensive UPP of the two treatment groups at baseline and after 24 weeks, respectively, are shown in Figure 3A.
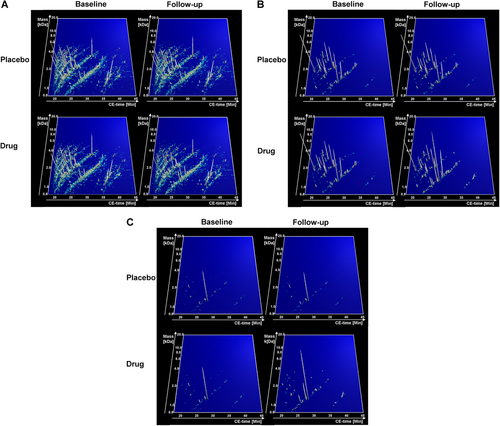
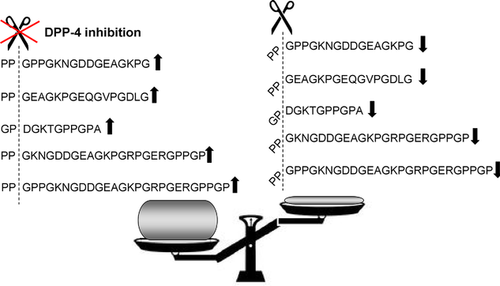
As expected, no significant changes in UPP before and after treatment were observed for the placebo group. In contrast, the analysis of the UPP of the linagliptin group resulted in the identification of 993 peptides significantly changed after 24 weeks of treatment. We were able to identify the amino acid sequence for 314 of these peptides (Figure 3B). For more in-depth investigations, we selected the top 30% of sequenced altered peptides (n = 95 peptides, defined by lowest p-values) as shown in Table S2, Supporting Information, and further depicted in Figure 3C. The majority of these peptides were fragments of different collagens (n = 77) and 86% were found to be increased after 24 weeks of linagliptin treatment. It is expected that inhibition of an abundant protease in proximal tubular cells, such as DPP-4, responsible for cleavage of various peptides, significantly alters UPP. DPP-4 cleaves X-proline dipeptides from the N-terminus of polypeptides and we thus investigated if the altered UPP after linagliptin would be reminiscent of this proteolytic pattern; 53 of the 95 peptides had a DPP-4 cleavage site (i.e., proline in the penultimate position), and are thus expected to increase after linagliptin treatment. Moreover, peptide levels with an N-terminal X-proline-containing sequence were also elevated, whereas peptides that may have resulted from the cleavage of those N-terminal amino acid sequences were decreased. As an example for the above described and proline-dependent alterations in peptides after linagliptin treatment, collagen alpha-1 (I) fragments as shown in Figure 4.
3.5 Correlation of Urinary DPP-4 Peptidase Activity with Urinary Peptide Abundance
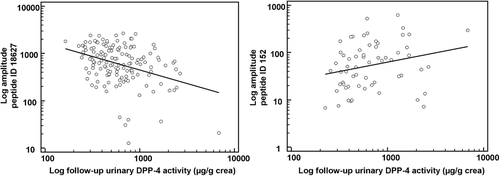
To test for our third hypothesis we correlated urinary DPP-4 peptidase activity after linagliptin treatment with the abundance (signal intensity) of all 314 linagliptin-affected sequenced urinary peptides at baseline (i.e., before drug exposure). We identified 20 peptides showing significant correlations (p < 0.05) with urinary DPP-4 activity, thereby indicative of dynamic changes after linagliptin treatment. These peptides are listed in Table S3, Supporting Information. Two specific examples of peptides depicting either an increase or decrease after linagliptin treatment are further shown in Figure 5. The majority of the above identified peptides showed a negative correlation with urinary DPP-4 activity (n = 17, 85%).
4 Discussion
The urinary multipeptide CKD273 classifier was previously established to support the early diagnosis and risk prediction of CKD.17 After the initial development of the classifier further observational studies showed a significant clinical utility of CKD273 to complement the clinical value of commonly used clinical kidney parameters like albuminuria or/and GFR.21, 38
MARLINA-T2D was designed to investigate the glycemic and renal effects of linagliptin in individuals with T2D over 24 weeks. Leveraging a predefined biobank of this study we were able to investigate three main study objectives in a cohort of patients with early DKD and treated with recommended standard of care for kidney disease: i) to cross-sectionally test the association of the CKD273 with baseline clinical parameters; ii) to longitudinally assess if CKD273 could predict the progression of CKD; iii) to explore for the first time if CKD273 could predict the renal response to linagliptin treatment. For the cross-sectional assessments we analyzed baseline data and available samples of the total study cohort and 319 baseline samples were available for our correlation analyses. In accordance with previous results from Schanstra et al.,20 the association of baseline eGFR in the MARLINA-T2D study with CKD273 (rho = −0.41) was greater than with albuminuria (rho = −0.30). In addition, we also longitudinally investigated the ability of CKD273 to predict progressive renal function loss in the MARLINA-T2D cohort. In order to account for an expected treatment bias on CKD273 by linagliptin, we exclusively used data of the placebo arm of the study for this analysis (i.e., n = 157). Acknowledging the limitations of the smaller sample size, we demonstrated a significant association of CKD273 with progressive renal function loss over the course of the study like also demonstrated by Schanstra et al.20
A particular novel aspect of our study was to investigate if the stratification of MARLINA-T2D patients by CKD273 (i.e., as previously reported by the PRIORITY trial39) may enable the identification of linagliptin treatment responders, with response being defined as a potential beneficial effect of linagliptin on slowing renal function loss. In the overall study population of MARLINA-T2D, treatment with linagliptin was not associated with a significant change in eGFR as compared to placebo. However, after stratification of the study population according to low and high CKD-risk (based on CKD273 classification) we detected a trend toward lower renal function loss in the high risk patients treated with linagliptin as compared to placebo. In addition, we showed that linagliptin treatment prevented a significant loss of the renal function. Such significant renal function loss was observed in the placebo-treated high CKD-risk group. Notably, no differences between linagliptin and placebo groups were observed in the low CKD-risk categories.
CE-MS analysis of urinary peptides allows for the detection of significant changes in the UPP after pharmacological interventions.40, 41 To obtain novel insights on the impact of DPP-4 inhibition by linagliptin on urinary peptides, we performed further investigations of the urine samples from the MARLINA-T2D trial before and after 24 weeks of linagliptin or placebo treatment. As expected, the placebo group did not show any significant changes in the urinary peptide profile at study end. In contrast, linagliptin treatment resulted in a prominent and dynamic impact on urinary peptides. As a result, we could identify 993 peptides potentially affected by linagliptin treatment. Noteworthy was the abundance of the most prominently affected urinary peptides (with lowest p-values), indicating that inhibition of selective proteases (e.g., such as DPP-4) could result in such large changes in urinary peptide concentrations. It is thus tempting to hypothesize that these increases were a direct consequence of the tubular inhibition of DPP-4 by linagliptin. DPP-4 is known to cleave X-proline dipeptides from the N-terminus of polypeptides. Our finding that 53 of the 95 most affected peptides have a proline in the second position and were increased at study end in the linagliptin group is therefore well aligned with the established biology of DPP-4. In addition, we could identify pairs of peptides for which the N-terminal X-proline-containing peptide was increased, whereas the corresponding peptide lacking the two N-terminal amino acids was consequently decreased. We believe this pattern is likely the result of altered generation of DPP-4 cleavage products, which would further support the hypothesis that these peptides reflect DPP-4 peptidase activity.
An important limitation of our study is the modest sample size and the relatively short follow-up, which decreased the statistical power highlighted by the lack of significant differences between the treatment groups. Furthermore this may have resulted in borderline p-values (e.g., between 0.05 and 0.1) observed for some of the endpoints.
-
confirm previous findings of CKD273 to predict both, presence of as well as risk for CKD progression
-
indicate a potential for linagliptin to slow progression of renal function loss in high CKD-risk patients, defined by a baseline CKD273 score > 0.343. We acknowledge that MARLINA-T2D was neither designed nor powered to assess the predictive treatment value of CKD273 for linagliptin. In addition, the CKD273 score was not equally balanced between the placebo and linagliptin arms at baseline. Therefore, we consider our observations hypothesis-generating in nature and future research is needed to confirmatively investigate whether CKD273 has the potential to identify individuals who may benefit from linagliptin treatment.
-
demonstrate a significant impact of DPP-4 inhibition on the overall UPP, with dynamic changes in peptide pattern that may reflect potent inhibition of the DPP-4 protease activity within the kidney by linagliptin.
Acknowledgements
The European Union Seventh Framework Programme (FP7/2007–2013) under grant agreements 279277 (PRIORITY) and 305507 (HoMAGE) supported research on which the presented results are based.
Conflict of Interest
J.S. is employed by Mosaiques Diagnostics. T.K., M.R., and M.v.E. are employed by Boehringer Ingelheim.


