Examining the effect of weight-related recruitment information on participant characteristics: A randomized field experiment
Abstract
Objective
Although 82% of American adults have a body mass index (BMI) of over 25, individuals with elevated BMI are considered difficult to recruit for studies. Effective participant identification and recruitment are crucial to minimize the likelihood of sampling bias. One understudied factor that could lead to sampling bias is the study information presented in recruitment materials. In the context of weight research, potential participants with higher weight may avoid studies that advertise weight-related procedures. Thus, this study experimentally manipulated the phrasing of weight-related information included in recruitment materials and examined its impact on participants' characteristics.
Methods
Two visually similar flyers, either weight-salient or neutral, were randomly posted throughout a university campus to recruit participants (N = 300) for a short survey, assessing their internalized weight bias, anticipated and experienced stigmatizing experiences, eating habits, and general demographic characteristics.
Results
Although the weight-salient (vs. neutral) flyer took 18.5 days longer to recruit the target sample size, there were no between flyer differences in respondents' internalized weight bias, anticipated/experienced weight stigma, disordered eating behaviors, BMI, or perceived weight. Absolute levels of these variables, however, were low overall.
Conclusion
Providing detailed information about study procedures allows participants to have more autonomy over their participation without differentially affecting participant characteristics.
Graphical Abstract
Study information presented in recruitment materials is an understudied factor that could lead to sampling bias, especially in the context of weight research. This study experimentally manipulated the phrasing of weight-related information included in recruitment materials and examined its impact on participants' characteristics. We found that providing detailed information about study procedures allows participants to have more autonomy over their participation without affecting participant characteristics.
1 INTRODUCTION
Individuals with elevated body mass index (BMI) are considered hard to reach and recruit in studies, despite the fact that nearly 82% of adults in the United States have a BMI higher than 25.1, 2 Study recruitment, or the process of engaging potential participants to enroll and participate in a study, starts with communication between the researcher and potential participants about the study's eligibility criteria and the task participants are expected to complete for the study.3 Identifying and recruiting study participants is important for ensuring that studies can meet the targeted sample size and collect data from a sample that is representative of the targeted general population.4, 5 When the sample represents the target population, the results are considered to have high external validity and are generalizable to the rest of the population. However, if there are systematic differences between those who participate and those who do not participate in the study, sampling bias is introduced.6 This threatens the study's external validity and introduces the potential for Type I and Type II errors that could call the study's conclusions into question.7, 8
One factor that influences sampling bias, as suggested by correlational and experimental evidence, is the type of task involved in the study. For example, participants in studies that involve stressful procedures, such as electric shocks and higher temperatures, or that concern drug effects and sexual behavior, tend to be male, more arousal-seeking, more extroverted, and less neurotic than nonvolunteers.9-11 Furthermore, women are more likely to participate in social science research, especially in surveys, compared to men.6, 12, 13
In the context of weight, recruitment phrasing usually explicitly informs potential participants that weight-related information will be collected in the study. Within the United States, where the weight stigma is widespread14 and many equate thinness to health and beauty, researchers have found that having a higher BMI is associated with shame.15 Higher BMI individuals, therefore, may be reluctant to participate in a study that identifies them as part of a stigmatized identity and may not want to engage in tasks that bring attention to weight-salient aspects of themselves. As a consequence, researchers examining weight-related topics often encounter problems with generalizability.16-18 In the current study, we examine recruitment differences in the medium of flyers, one of the most frequently used recruitment materials and strategies because of their feasibility and effectiveness.19, 20 The phrasing used in flyers, therefore, could play a role in differentiating the characteristics of participants and nonparticipants.
Although some researchers have studied the effects of recruitment materials phrasing on participants, the literature in this area is scant. Researchers have found that information phrasing in flyers can affect the perception, understanding, and decision-making of prospective participants.21, 22 Foroughi et al.23 used flyers that looked similar but contained different information to recruit their experimental and control group participants that were designed to differ according to specific characteristics. By phrasing study information as “brain training & cognitive enhancement” in the experimental condition and “email today & participate in a study” in the control condition, they were able to recruit participants who held strong positive beliefs in the malleability of intelligence in the experimental condition and their counterparts who did not hold such beliefs in the control condition.23 For weight researchers, weight-related information such as body measurements, weight-related social experiences and attitudes, dietary intake, and eating habits in recruitment materials might cause selection bias. Thus, the current study examined participants' characteristics by manipulating the phrasing of weight-related information included in the recruitment materials.
In a pre-registered randomized experiment, we posted two visually similar flyers of the same study that were either weight-salient or neutral. We posted the flyers throughout a university campus to recruit participants to complete a short survey. Specific participant characteristics examined in the study included internalized weight bias, anticipated and experienced stigmatizing experiences, eating habits, personality, and general demographic characteristics. We hypothesized that participants recruited through the weight-salient flyers would report lower internalized weight bias and less disordered eating behaviors; anticipate and have experienced fewer stigmatizing experiences; and have lower BMIs and lower perceived weight compared to participants recruited through the neutral flyers. We also hypothesized that the weight-salient flyers would take a longer period of time to reach the targeted sample size than the neutral flyers.
2 METHODS
All methods and analytic plans were pre-registered on the Open Science Framework at https://osf.io/9ze7j.
2.1 Participants
A sample of 300 participants was initially recruited from a large public U.S. university. Individuals 18 years or older were eligible to participate in the study. After excluding participants who failed to pass the attention check (n = 7) and removing repeated responses from those who participated multiple times (n = 4), data from a total of 289 participants were retained for analysis. Participants had a mean age of 21.83 years (SD = 5.19). The majority of participants (73.6%) identified as women, 21.3% identified as men, and the remaining 5.1% identified outside the gender binary. The largest racial population was Asian (51.4%), followed by white (37.2%) and Black/African American (5.7%). The ethnic makeup of the sample was as follows: 22% Hispanic or Latino/a/x, and 78% were non-Hispanic or Latino/a/x. Participants were compensated with a $5 Amazon gift card for their participation. The Institutional Review Board North General Committee approved all study procedures.
2.2 Materials
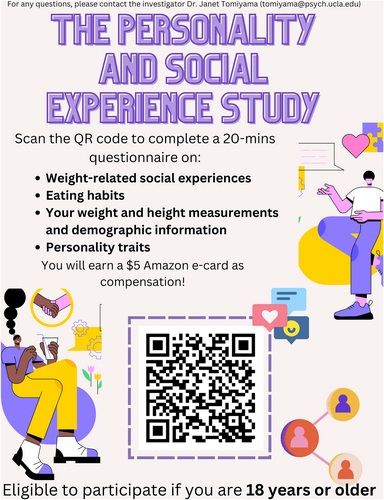
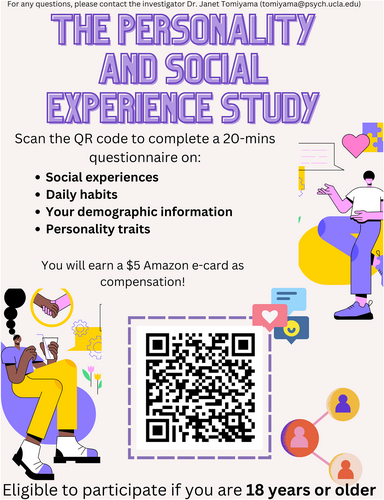
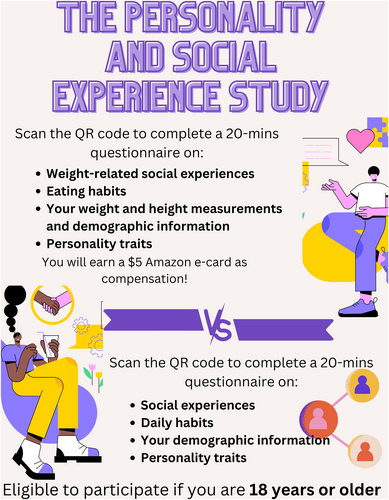
The study used two different but visually similar versions of the study flyer. The first version, the weight-salient flyer, stated that a questionnaire would be administered on “weight-related social experiences” and “eating habits.” The flyer also explicitly stated that height and weight measurements would be taken. The second version, the neutral flyer, included more generic information by stating that the questionnaire would contain questions about “social experiences” and “daily habits.” Crucially, this version also omitted any mention of collecting data on height, weight, and eating. Both versions of the flyer mentioned that demographic and personality measures would be collected (see Figures 1 and 2).

Weight-salient recruitment flyer.

Weight-neutral recruitment flyer.
2.3 Procedure
Researchers audited 141 locations across the university campus by contacting the department administrators of each building through email and phone and visiting the locations physically. Locations were deemed to be suitable if permission could be gained from the department head, and there were bulletin boards that could be used at the location. Of the 141 locations audited, 100 were selected for the experiment. The two versions of the flyers were then randomly assigned to the 100 bulletin boards. On Tuesday afternoon of the 4th week of the academic quarter, flyers were distributed to 19 research assistants (RAs), with each RA receiving only one version of the flyer. The RAs all left the laboratory simultaneously and placed all the flyers within 25 minutes of leaving. Flyers were taped or pinned in all four corners. After the flyers were posted, RAs audited their assigned bulletin boards weekly to ensure the flyers were still on display and took photographs documenting the flyer placement. Auditing was done on the same day and around the same time each week. If any flyers had been taken down, replacements were posted within the same day.
Participants scanned a QR code on the flyer and were directed to a 20-min questionnaire on Qualtrics in which various measures were taken. Although each version of the flyer directed participants to different surveys on Qualtrics, both surveys included the same questionnaires. After each version of the flyer recruited 75 participants, the study was paused, and all flyers were taken down.
The following quarter, roughly 12 weeks later, the flyer locations were counterbalanced: locations with the weight-salient flyer were switched to display the neutral flyer and vice-versa. The same procedure was carried out around the same time in the following quarter with the swapped locations. Participants were recruited until 150 participants (75 participants per quarter) were reached for both versions of the flyer, after which the data collection was concluded.
2.4 Measures
The dependent variables for this study included internalized weight bias, anticipated and experienced stigmatizing experiences, disordered eating, BMI, perceived weight, and recruitment speed (i.e., the number of days required to recruit 75 participants in each quarter).
2.4.1 Internalized weight bias
Internalized weight bias was measured via the Weight Bias Internalization Scale - modified version (WBIS-M).24The scale consists of 11 items asking participants the extent to which they feel negatively about themselves because of their weight from 1 (strongly disagree) to 7 (strongly agree). A mean score was calculated, with higher scores indicating more weight bias internalization (α = 0.81).
2.4.2 Anticipated and experienced weight stigma
Anticipated and experienced weight stigma was assessed through questionnaires that were developed based on Hunger and Major25 and Williams et al.26 Participants reported on a 4-point scale (Not at all - Often) indicating the frequency of anticipating and experiencing discrimination related to their weight. A mean score for the anticipated and experienced weight-related discriminatory experiences was calculated, respectively, with higher scores indicating higher anticipated (α = 0.65) and experienced (α = 0.87) stigmatizing experiences.
2.4.3 Disordered eating
Disordered eating was measured using the 12-item Eating Disorder Examination Questionnaire (EDE-QS).27 Participants reported on a 4-point rating scale (0–7 days) and (Not at all - Markedly) in reference to behaviors, thoughts, and feelings over the past 7 days. A sum was calculated, with higher scores indicating higher symptoms (α = 0.91).
2.4.4 Self-reported body mass index (BMI)
Body mass index (BMI) was calculated with the standard BMI formula28 of weight in pounds divided by height in inches squared x 703 using self-reported height (feet and inches) and weight measurements (pounds).
2.4.5 Perceived weight status
Perceived weight status was assessed using a one-question item asking individuals to rate their weight status on a scale of 1 (very underweight) to 5 (very overweight). A higher score reflects a higher perceived weight status.
2.4.6 Recruitment speed
Recruitment speed was operationalized as the number of days it took for each version of the flyer to garner 75 participants at each time point after the flyers had been put up. A total mean score was calculated for each version of the flyer.
2.5 Statistical analysis
We used SPSS software (v. 28) to complete the analyses. One-way ANOVAs were conducted to test for differences in internalized weight bias, anticipated and experienced weight stigma, personality, disordered eating, BMI, and perceived weight between the two groups that saw different versions of the study flyer, respectively. Descriptive data were examined for recruitment speed such that we compared the average number of days that each version of the flyer took to reach 75 participants across the two quarters.
3 RESULTS
In terms of recruitment speed, the weight-salient flyers took 54.5 days on average across the two quarters to recruit 75 participants per quarter, whereas the neutral flyers took 36 days on average across the two quarters to recruit 75 participants per quarter.
One-way ANOVAs tested whether participants recruited through the weight-salient flyers versus neutral flyers differed in their internalized weight bias, anticipated and experienced stigmatizing experiences, disordered eating symptomatology, BMI, and perceived weight status. Table 1 displays the ANOVA output. To control for Type I error, we further used the false-discovery-rate approach29 and set a false-positive rate at 5% per model. The ANOVA initially revealed a significant difference in participants' internalized weight bias between the two conditions. However, the difference was no longer significant using the false-discovery-rate correction. Anticipated and experienced stigma, disordered eating symptomatology, BMI, and perceived weight status were not different between conditions. Results are shown in Table 1.
| Outcome variable | Total mean (SD) | Weight-salient mean (SD) | Control mean (SD) | F | p |
|---|---|---|---|---|---|
| Weight bias internalization | 3.32(1.39) | 3.51(1.34) | 3.14(1.43) | 5.12 | 0.024a |
| Anticipated weight stigma | 2.02(0.69) | 2.06(0.70) | 1.99(0.67) | 0.81 | 0.368 |
| Experienced weight stigma | 1.48(0.66) | 1.53(0.71) | 1.44(0.62) | 1.33 | 0.250 |
| Disordered eating | 9.66(7.62) | 10.12(7.37) | 9.20(7.85) | 1.05 | 0.306 |
| Body Mass Index | 23.40(4.81) | 23.49(5.12) | 23.31(4.50) | 0.10 | 0.749 |
| Perceived weight | 3.29(0.76) | 3.33(0.79) | 3.25 (0.77) | 0.86 | 0.355 |
- a Note. The False Discovery Rate approach requires this p value to be < .008 to be statistically significant.
4 DISCUSSION
The present study aimed to investigate how the phrasing of study information (weight-salient vs. neutral) in flyers affected the weight-related characteristics of the participants being recruited. We hypothesized that weight-salient flyers would recruit participants reporting lower internalized weight bias, less disordered eating behaviors, fewer anticipated and experienced stigmatizing experiences, lower BMIs, and lower perceived weight compared to neutral flyer-recruited participants. Additionally, we hypothesized that weight-salient flyers would take longer than neutral flyers to recruit the targeted sample size. Although we found that weight-salient flyers took 18.5 days longer than control flyers to recruit the target sample size, we did not find evidence for any of the other hypotheses.
Although there were no differences between the flyer conditions, the mean of weight bias internalization reported by all participants was below the midpoint of the 7-point Likert scale. Similarly, participants anticipated and experienced relatively few weight-related stigmatizing experiences (on average between “not at all” and “rarely”), reported a low level of disordered eating behaviors (on average tried to control their weight “1–2 days” in a week and “slightly” dissatisfied with their weight), belonged to the lower BMI category (i.e., 76.4% had a BMI <25), and had relatively low perceived weight status (on average perceived themselves “about the right weight”). Thus, studies that wish to target individuals with high levels of these variables may incur challenges in recruitment. The general hesitancy of these populations to participate in studies aligns with the existing literature. For example, other studies30, 31 have noted that higher-weight populations are more difficult to reach because they may try to conceal their group identity due to widespread weight stigma. Similarly, a study of children and their parents by Bergmann et al.32 found that participants with elevated BMI tended to avoid participating in weight-related research. Therefore, studies recruiting a higher-weight sample may require more targeted recruitment strategies.
4.1 Strengths and limitations
One strength of the current study is its rigorous design. By conducting a field experiment, we examined how flyers recruited participants in a study in a real-world setting. With strong ecological validity, the study provided insights into individuals' true decision-making instead of simply assessing their behavioral intentions, which previous studies have found are not a strong indicator of actual action.33 Moreover, the use of randomization, counterbalancing, and visually identical designs of the two flyers maximized internal validity, ensuring that the study results were due to the phrasing of the study information. To minimize history effects, we put up all flyers simultaneously on the same week of the quarter and on the same day of the week across the two counterbalanced quarters.
One limitation of this study is its low sample diversity. The study took place at a university in the United States, and the majority of the participants were women, non-Hispanic or Latino/a/x Asian, or white young adults, which was not representative of the general population. Based on past studies, non-Hispanic Asian and white female young adults tended to have a lower BMI compared to the rest of the population.34, 35 Such a difference could potentially explain the study results that despite 73.8% of adults in the United States having a higher BMI (i.e., BMI ≥ 25), the sample reported having a predominantly lower BMI. Thus, future studies should be conducted in a variety of contexts to provide a more comprehensive understanding of the effect of flyers' phrasing and participants' characteristics.
5 CONCLUSION
Study information phrasing and language used in flyers is an understudied factor that has the potential to attract specific types of participants, consequently introducing sampling bias. Through a randomized field experiment that presented flyers that were visually similar but contained different weight-related study information, we found that participants recruited through the weight-salient flyer took longer to recruit the target sample size than a neutral flyer. However, this study indicates that participants can know detailed information about a study - leading to more autonomy over what they are opting into - without it negatively impacting the composition of the study.
AUTHOR CONTRIBUTIONS
Christy Wang: Project administration, study design, data collection, data analysis, data interpretation, and original draft preparation. Jeffrey M. Hunger: Conceptualization, methodology, study design, validation, and writing review and editing. Joseph Liao: Data collection and original draft preparation. David Figueroa: Study design, data collection, and writing review and editing. Alejandra Lopez: Study design, data collection, and writing review and editing. A. Janet Tomiyama: Conceptualization, methodology, study design, data collection, supervision, validation, and writing review and editing.
ACKNOWLEDGMENTS
We thank 2022–2023 Dieting, Stress, and Health Lab undergraduate and graduate students for their contribution to this publication. This research received no specific grant from any funding agency in the public, commercial, or not-for-profit sectors.
CONFLICT OF INTEREST STATEMENT
The authors declare no conflicts of interest.


