Oxidative Stress Mediated by N6-Methyladenosine Methylation Contributes to High-Fat Diet Induced Male Reproductive Dysfunction
Abstract
Objective
To determine the mechanism of oxidative stress mediated by N6-methyladenosine (m6A) methylation contributing to high fat diet-induced reproductive dysfunction.
Results
In vivo, compared with those in the Control group, the sperm count and sperm motility decrease significantly; the testosterone, luteinizing hormone levels, hyaluronidase, acrosomal enzyme levels, and total antioxidant capacity decrease significantly; malondialdehyde increases significantly in the DIO and DIO-R groups. The expression of nuclear factor erythroid 2-related factor 2 (Nrf2), superoxide dismutase 1 (SOD1), and NAD(P)H quinone dehydrogenase 1 (NQO1) decreases significantly in the DIO and DIO-R groups; m6A levels in testis tissue in the DIO and DIO-R groups increase; the enrichment of m6A-modified Nrf2 mRNA in testis in the DIO group and DIO-R group increases significantly. Also the m6A regulatory proteins increase significantly in the DIO group and DIO-R group. In vitro, compared to palmitic acid treated cells, the reactive oxygen species (ROS) level significantly decreases in STM2457, S-Adenosylhomocysteine treated cells and YTHDC2, YTHDF2 gene silence cells; however, Nrf2 expression increases in all treated cells. In addition, m6A expression decreases.
Conclusions
Oxidative stress mediates by methylation of m6A may contribute to high fat diet-induced male reproductive dysfunction.
1 Introduction
Due to its high prevalence, obesity has been studied by numerous researchers. As reported by the World Health Organization (WHO) in 2016, more than 1.9 billion adults, 18 years and older, were overweight. Of these over 650 million were obese.[1] According to the global burden of disease, over four million people died due to overweight or obesity in 2017.[2] Obesity may cause many diseases,[3] infertility being one of these diseases, which has resulted in many investigations.[4]
The reasons for obesity are complex, and include environmental and genetic factors.[5] A high-fat diet is a common and important factor.[6] Research has shown that obesity caused by a high fat diet is related to infertility.[7] Poor semen quality and a low level of testosterone in obese men were caused by high fat diet.[7] Our previous study also found that high fat diet-induced obesity can affect male reproductive dysfunction.
The reasons for male reproductive dysfunction caused by high fat diet are unclear. Our previous study and another study found that an imbalance between the oxidation and antioxidant systems in the testes (oxidative stress) may be an important reason for male reproductive dysfunction.[3, 7, 8]
Oxidative stress is a state in which the body is subjected to harmful stimulation. Excess reactive oxygen species (ROS, oxidation system) or a decline in antioxidant system function may result in an imbalance between the oxidation and antioxidant systems in the body. With regard to the oxidation system, research has shown that oxidative stress which is caused by excessive ROS in the reproductive system may affect the translation and folding of proteins during spermatogenesis, resulting in poor function and low vitality of sperm, mitochondrial dysfunction, and even infertility.[9] In our previous study on the antioxidant system, it was found that a decrease in total antioxidant capacity played an important role in male reproductive dysfunction caused by high fat diet.[10] Nuclear factor erythroid 2-related factor 2 (Nrf2) is an important antioxidant regulator and has been reported in many studies.[11] We assume that a decline in Nrf2 and increase in ROS together may play a key role in male reproductive dysfunction caused by high fat diet.
To study the cause of the decline of Nrf2 and increase in ROS, N6-methyladenosine (m6A) was investigated. M6A is one of the most common RNA internal modifications and is involved in the pathogenesis of a variety of diseases, such as cancer, neurological diseases, autoimmune diseases, and infertility.[12] The research by Zhao et al. indicated that up-regulation of m6A modification could induce Leydig cell injury, which might be related to many physiological disorders such as histone acetylation, ROS biosynthesis, the MAPK signaling pathway, hormone secretion regulation, and autophagy regulation.[13] There may be a relationship between the increase in m6A modification level and excess ROS.[13] Another study proved that increased enrichment of m6A-modified Nrf2 mRNA in testis led to a decrease in Nrf2 protein expression.[14] We considered that m6A may play an important role in oxidative stress which is the main reason for reproductive dysfunction caused by high fat diet.
M6A methylation modification of mRNA is the result of the combined action of methyltransferases (Writers), binding proteins (Readers), and demethylases (Erasers).[12] However, there is little research on the relationship between m6A modification and oxidative stress in male reproductive disorders induced by high fat diet. We speculated that the decline in male reproductive function caused by high fat diet was mainly caused by the increase in ROS and decreased expression of Nrf2. The increase in ROS and decrease in Nrf2 may be caused by increased m6A and the enrichment of m6A-modified Nrf2 mRNA.
Therefore, in this experiment, a high fat diet model was established in male mice by feeding them a high fat diet for 10 weeks to determine the mechanism of oxidative stress mediated by m6A contributing to high fat diet-induced reproductive dysfunction. Reproductive damage, levels of hormones and enzymes, oxidative stress, the enrichment of m6A-modified Nrf2 mRNA, and key regulatory proteins of m6A in murine testicular tissue were measured. We also established a high fat diet-induced obesity and resistant mouse model to prove the role of high fat diet on male reproductive dysfunction. A GC-1 spg cell model was also established to further verify the mechanism of high fat diet on male reproductive dysfunction.
2 Experimental Section
2.1 Animal Experiments
2.1.1 Animals
C57BL/6J mice (male, 10–12 g) were provided by the Experimental Animal Center, Shenyang Pharmaceutical University. The Quality certificate number of the animals was 211002300061252. The experimental mice were housed in the Animal Center of Shenyang Medical University at room temperature of (25 ± 2) °C, (55 ± 10)% relative humidity, and a 12 h light/dark cycle with free access to food and water. The Institutional Animal Care and Use Committee of Shenyang Pharmaceutical University approved the study (accreditation number: SYPU-IACUC-C2020-8-12-107). All experiments were carried out in accordance with the instructions for the care and use of laboratory animals from Shenyang Pharmaceutical University and the National Institute of Health Guide for the Care and Use of Laboratory Animals. All efforts were made to minimize animal suffering.
2.1.2 Diet
The mice were randomly assigned to a standard laboratory mouse diet (Experimental Animal Center, Shenyang Pharmaceutical University, in accordance with GB 14924.3-2010, China) or a 60% High-Fat Diet (TP23300, TROPHIC Animal Feed High-Tech Co., Ltd., China). The standard laboratory mouse diet consisted of 12% calories from fat, 21% calories from protein, 67% calories from carbohydrates (3.44 kcal g−1). The 60% high-fat diet consisted of 60% calories from fat, 19.4% calories from protein, 20.6% calories from carbohydrates (5.0 kcal g−1).
2.1.3 Animal Models
Forty mice were acclimated to the new environment 1 week before the experiment. Ten mice were selected as control mice (Control) according to a random number table and fed with standard laboratory mouse diet until the end of the experiment. The remaining 30 mice were fed the 60% high-fat diet. After 10 weeks, the mice fed with the high fat diet were sorted according to body weight gain. Ten mice with the highest body weight gain were selected as diet-induced obese (DIO) mice. Ten mice in the lowest body weight gain were selected as diet-induced obesity resistant (DIO-R) mice, and the remaining 10 mice were removed from the experiment.[15]
2.1.4 Sample Collection/Experimental Procedures
At the end of the experiment, the mice were anesthetized with ether. Blood was collected from the inferior vena cava and stored at −80 °C for determination of hormone levels. Testes were collected and stored at −80 °C for hematoxylin and eosin (HE) staining and immunofluorescence staining of m6A using an ELISA kit, m6A-IP-qPCR, and Western blot. The epididymis was immediately placed into an Eppendorf tube and a sperm suspension was prepared for the determination of sperm count and sperm motility.
2.1.5 Sperm Motility and Count
According to the WHO guidelines[16] (count ≥200 sperm per sample) sperm motility was assessed under a microscope. Sperm motility was classified as either forward, non-forward, or non-moving. Sperm motility was obtained by counting the number of forward and non-forward moving sperm in 200 sperm. Then 10 µL sperm suspension was aspirated and placed into a blood count plate. The number of sperm was recorded under the microscope and the sperm density was calculated. The detailed methods were described previously, n = 10.[8]
2.1.6 Light Microscopy
The testis tissue (n = 6) was fixed in 4% paraformaldehyde, gradient dehydrated with ethanol, cleared with xylene, embedded in paraffin, cut into slices 5 µm thick using a rotary microtome (Leica, Buffalo Grove, IL, USA) and stained with HE. Observations and photography were conducted under the microscope (Olympus, Tokyo, Japan). The detailed methods were described previously.[8]
2.1.7 Hyaluronidase, Acrosomal Enzyme, Hormones, MDA, Total Antioxidant Capacity
Hyaluronidase (HAse), acrosomal enzyme (ACE) levels, hormone levels, malondialdehyde (MDA), total antioxidant capacity (T-AOC), and m6A RNA methylation were detected using kits. All methods were performed according to the instructions provided with the kit.
HAse and ACE levels in testis tissue (n = 8) were detected using the ELISA method. The mouse HAse ELISA kit (ml037445) and the mouse ACE ELISA kit (ml057967) were obtained from Mlbio (Shanghai, China).
Testosterone (T), estrogen (E2), and luteinizing hormone (LH) were detected by the ELISA method. All methods were performed according to the instructions provided with the ELISA kit. The mouse T ELISA kit (ml001948), mouse LH ELISA kit (ml1063366), and mouse E2 ELISA kit (ml001962) were obtained from Mlbio, n = 10.
MDA and T-AOC in testis tissue (n = 10) were detected by biochemical methods. The MDA and T-AOC contents were measured using assay kits in strict accordance with the manufacturer's instructions. The analysis kits for MDA and T-AOC assay were provided by Nanjing Jiancheng Bioengineering Institute (A003-1-2; Nanjing, China) and Beyotime Biotechnology (S0121; Jiangsu, China), respectively.
2.1.8 Nrf2 mRNA Level Detection—Real-Time PCR
Total mRNA was extracted from testes tissue (n = 4) using Trizol (TaKaRa Biotechnology Co., Ltd.). Real-time PCR was performed with a SYBR green PCR kit (TaKaRa Biotechnology Co., Ltd., Dalian, China) using a real-time PCR system (Applied Biosystems 7500 Real-Time PCR system).
The primer sequence of Nrf2 was as follows: Forward: CTCGCTGGAAAAAGAAGTGG, Reverse: CCGTCCAGGAGTTCAGAGAG, and β-actin was Forward: 5’-CATCCGTAAAGACCTCTATGCCAAC-3’, Reverse: 5’-ATGGAGCCACCGA TCCACA-3’. Detailed methods could be found in a previous study.[17]
2.1.9 m6A RNA Methylation Level Detection—Colorimetric and Immunofluorescence Methods
Total mRNA was extracted from testes tissue using Trizol (TaKaRa Biotechnology Co., Ltd.). Then M6A RNA methylation was detected using a colorimetric method. The m6A RNA methylation assay kit (AB 185912) was obtained from Abcam (Cambridge, UK), n = 6. Assessment of m6A levels was also detected by immunofluorescence: following slicing as described in Section 2.1.6., m6A rabbit pAb (A17924 ABclonal, China) was used for immunofluorescence staining. Fluorescence microscopy was used for observations and photography (Olympus, Tokyo, Japan). Integrated density (IntDen) and area were counted using ImageJ software, and the average fluorescence intensity = IntDen/Area, n = 6.
2.1.10 Detection of the Modification of m6A in Nrf2 mRNA by Co-Immunoprecipitation
The enrichment of m6A in Nrf2 mRNA was detected by N6-methyladenosine Co-Immunoprecipitation quantitative polymerase chain reaction (m6A-IP-qPCR). Total RNA was extracted according to a previously published experimental method.[10] N6-methyladenosine rabbit pAb pretreated immunomagnetic beads underwent immunoprecipitation which was carried out according to the instructions on the A/G Co-Immunoprecipitation kit (BEAVER, Suzhou, China). The m6A enrichment of Nrf2 mRNA was quantified by RT-qPCR according to a previous experimental method.[10] The primer sequence of Nrf2 was as follows: Forward: GGTTGCCCACATTCCCAAAC; Reverse: AGTGACTGACTGATGGCAGC. The formula used to calculate the enrichment result (Input%) was as follows: Input% = 2(CT(Input) - Ct(m6A-IP)) × Fd × 100% (Fd was the input dilution factor), n = 6.
2.1.11 Protein Level Detection—Western Blot Analysis
Nrf2, SOD1, NQO1, FTO, ALKBH5, METTL3, METTL14, YTHDC2, and YTHDF2 levels were detected by Western blot analysis. The testes (n = 6) were washed twice in ice cold phosphate-buffered saline (PBS). RIPA buffer (50 µL) was added and the testes were placed on ice for 20 min, followed by centrifugation for 20 min at 12,000 × g. After blocking in PBST containing 4% skimmed milk for 2 h at room temperature, the polyvinylidene fluoride membranes were incubated with rabbit polyclonal primary antibody (1:200) in PBST overnight at 4 °C. The membranes were then washed three times with PBST and incubated in peroxidase-conjugated AffiniPure secondary antibodies (diluted 1:5000; ZSGB-BIO, Beijing, China) in PBST for 2 h at room temperature. Detection was carried out by chemiluminescence using ECL solution (Thermo Fisher Scientific, Waltham, MA, USA). Each sample was measured at least three times. The detailed methods were described previously.[8]
Primary antibodies were as follows: Nrf2 rabbit pAb (A0674 ABclonal, Wuhan, China); SOD1 rabbit pAb (A12537 ABclonal, China); NQO1 rabbit pAb (A19586, ABclonal China); FTO rabbit pAb (A1438 ABclonal, China); ALKBH5 rabbit pAb (A11684 ABclonal, China); METTL3 rabbit pAb (A19079 ABclonal, China); METTL14 rabbit pAb (A8530 ABclonal, China); YTHDC2 rabbit pAb (A15004 ABclonal, China); YTHDF2 rabbit pAb (A15616 ABclonal China); β-actin rabbit pAb (AC026, ABclonal China)/goat anti-rabbit IgG (H+L) (AS014 ABclonal China).
2.2 Cell Experiments
2.2.1 Cell Culture and Treatment
The GC-1 spg cells, a well-established mouse type B spermatogonia cell line, were obtained from FuHeng BioLogy Company (FuHeng, FH1400). The cells were cultured in DMEM/high glucose medium (Hyclone, SH30243.01) supplemented with 10% fetal bovine serum (FBS) (Lonsera, LR-S711-001S). The GC-1 spg cells were then cultured in 6-well plates, at a density of 2 × 10 5 cells mL−1. After reaching 60–80% confluence, the cells were exposed to medium supplemented with different concentrations of palmitic acid (PA, MedChemExpress, USA, 114514) at 0, 50, 100, 200, 400 µM and STM2457 (STM, inhibitor of METTL3, Sigma, Germany, SLCG7895) at 0, 1, 3, 10, 30, 100 µM. S-Adenosylhomocysteine (SAH, inhibitor of METTL14, Abmole, USA, M9611) at 0, 0.05, 0.15, 0.5, 1.5, 5 µM. YTHDC2 silencing transfection reagent (si-YTHDC2) and YTHDF2 silencing transfection reagent (si-YTHDF2) were obtained from General BIOL Company (Anhui, China, RX062461). After 24 h, the cells were collected for follow-up experiments.
CCK-8 (Cell Counting Kit-8) Assay: The prepared cells were seeded into 96 well plates (5000 cells per well), 10 µL CCK-8 was added into each well, and the plates were subsequently placed in an incubator at 37 °C and 5% CO2. After 3 h, the absorbance (OD value) was measured on a microplate reader at the wavelength of 450 nm. All experiments were repeated three times, and the average OD value for each experiment was calculated. The cell survival histogram was prepared using GraphPad Prism 6.0 software.
GC-1 spg cells were seeded on 24 well culture plates, and siRNA was transfected with ribotracer TM fluorescent oligo (green). The siRNA knockout efficiency was detected by laser confocal microscopy.
Finally, the cells were exposed to 200 µM PA, 10 µM STM2457, 1.5 µM SAH. Six groups were selected in these experiments for detecting the role of METTL3 and METTL14: Control group, PA group (200 µM), STM2457 (10 µM), SAH (1.5 µM), PA (200 µM)+ STM2457 (10 µM), and PA (200 µM)+ SAH (1.5 µM) group. All experiments were repeated in two independent experiments and in triplicate for reproducibility of results. Four groups were selected in these experiments for detecting the role of YTHDC2 and YTHDF2: Control group, PA group (200 µM), PA (200 µM)+ Si-YTHDC2, and PA (200 µM)+ Si-YTHDF2 group.
2.2.2 ROS Assay
The cell culture medium was removed, an appropriate volume of diluted DCFH-DN was added, and then incubated at 37 °C for 1 h. The cells were washed three times with serum-free cell culture medium. A confocal analysis system was performed using a laser confocal scanning microscope (C2-si, Nikon) according to established methods.
2.2.3 m6A RNA Methylation Level Detection—Immunofluorescence Method
The treated GC-1 spg cells were fixed in methanol for 20 min at room temperature, blocked with 3% BSA for 30 min and permeabilized with 0.25% Triton X-100 in PBS for 10 min. Different protein primary antibodies were incubated overnight at 4 °C. Goat anti-rabbit IgG/RBITC and DNA dye DAPI were used (blue). A confocal analysis system was performed using a laser confocal scanning microscope (C2-si, Nikon) according to established methods, utilizing continuous laser excitation to minimize the possibility of fluorescence emission leakage.
2.2.4 Protein Level Detection—Western Blot Analysis and Immunofluorescence Method
Nrf2, FTO, ALKBH5, METTL3, METTL14, YTHDC2, and YTHDF2 levels in GC-1 spg cells were detected by Western blot analysis. Total protein in each group of GC-1 spg cells was extracted using RIPA buffer with 1 mM phenylmethanesulfonyl fluoride (PMSF) followed by 10 min centrifugation at 14,000 rpm at 4 °C. Protein concentration was measured by the BCA protein kit. Equal quantities of protein were separated by SDS-PAGE and transferred to a polyvinylidene difluoride (PVDF) membrane. The membrane was blocked with 4% skim milk. Immunoblotting was performed with the first antibody (the same as that in Section 2.1.11) and then the secondary antibody (1:4000) (ZSGB-BIO, Beijing, China). After three washes with TBST, the density of each blot was visualized using the Odyssey infrared imaging system. Nrf2 in GC-1 spg cells was also detected by the immunofluorescence method (Section 2.2.4).
2.3 Statistical Analyses
Data were analyzed using SPSS 21.0 analysis software. The experimental data were presented as mean ± standard deviation (mean ± SD). One-way analysis of variance (ANOVA) was used to compare differences among the three groups, followed by the LSD test. The significance level was set at 0.05.
3 Results
3.1 Animal Results
3.1.1 Effect of High Fat Diet on Body Weight
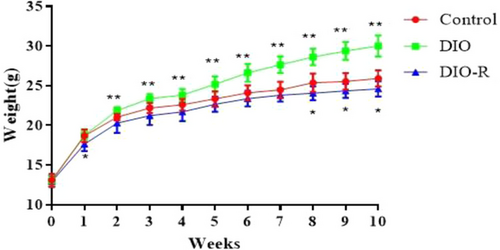
As shown in Figure 1, at the 10th week, the body weight of DIO mice (30.01 ± 1.32 g) was significantly greater than that in Control mice (25.9 ± 1.03 g) (p < 0.01), and body weight in DIO-R mice (24.60 ± 0.97 g) was significantly lower than that in the Control group (p < 0.05), which indicated that the obesity model and obesity resistant model were successfully established.
3.1.2 Effect of High Fat Diet on Reproductive Organs
As shown in Table 1, the testis weight in DIO mice was significantly lower than that in Control mice (p < 0.05). However, there was no significant difference between the Control and DIO-R mice (p > 0.05).
| Group | Relative Tes. weight [g 100 g−1] | Relative epididymis weight [g 100 g−1] | Relative Sem. weight [g 100 g−1] |
|---|---|---|---|
| Control | 0.71 ± 0.06 | 0.32 ± 0.06 | 0.86 ± 0.07 |
| DIO | 0.60 ± 0.15* | 0.31 ± 0.05 | 0.90 ± 0.10 |
| DIO-R | 0.74 ± 0.07 | 0.31 ± 0.05 | 0.89 ± 0.11 |
- * p < 0.05 versus the Control group.
3.1.3 Effect of High Fat Diet on the Sperm Count and Sperm Motility
As shown in Figure 2, the sperm count in the DIO group (1.79± 0.38 × 10⁶ mL−1) and DIO-R group (1.89 ± 0.46×10⁶ mL−1) were significantly decreased compared with the Control group (2.93 ± 0.63 × 10⁶ mL−1) (p < 0.01). Sperm motility in the DIO group (33.90 ± 13.72%) and DIO-R group (39.10 ± 15.01%) was significantly decreased compared with the Control group (51.90 ± 11.96%) (p < 0.01). However, there was no significant difference between the DIO and DIO-R mice (p > 0.05).

3.1.4 Effect of High Fat Diet on Pathological Changes
Histological images of testis sections from each group are presented in Figure 3. The testis morphology in the DIO group changed. Germ cells and Sertoli cells showed a loose arrangement with decreased cell number. The number of sperm in seminiferous tubules decreased, and significant vacuolation of the cytoplasm was observed. In the DIO-R group, the number of germ cells and Sertoli cells in mouse testis tissue decreased, some seminiferous tubules were deformed, and the cytoplasm also showed vacuolation.

3.1.5 Effect of High Fat Diet on HAse and ACE Levels
As shown in Table 2, the levels of HAse and ACE in the DIO group and DIO-R group were significantly reduced compared with the Control group (p < 0.05, p < 0.01). However, there was no significant difference between the DIO and DIO-R mice (p > 0.05).
3.1.6 Effect of High Fat Diet on Testosterone, Estradiol, and LH Levels
As shown in Table 3, the levels of E2 in the DIO group and DIO-R group were significantly higher than that in the Control group (p < 0.01). The levels of T and LH in the DIO group and DIO-R group were significantly lower than that in the Control group (p < 0.05, p < 0.01). However, there was no significant difference between the DIO and DIO-R mice (p > 0.05).
| Group | Testosterone [ng mL−1] | Estradiol [nmol mg−1] | LH [mIU mg−1] |
|---|---|---|---|
| Control | 14.70 ± 2.37 | 14.73 ± 1.26 | 2.28 ± 0.20 |
| DIO | 11.06 ± 1.24* | 17.62 ± 0.89** | 1.83 ± 0.73** |
| DIO-R | 11.15 ± 0.98* | 20.53 ± 6.50** | 1.72 ± 0.17** |
- * p < 0.05 versus the Control group.
- ** p < 0.01 versus the Control group.
3.1.7 Effect of High Fat Diet on MDA and T-AOC Levels
The levels of MDA in the DIO group and DIO-R group were significantly higher than that in the Control group (p< 0.01). However, compared with the Control group, the T-AOC content in the DIO group and DIO-R group was significantly decreased (p < 0.01), Table 4. However, there was no significant difference between the DIO and DIO-R mice (p > 0.05).
3.1.8 Effect of High Fat Diet on Protein Expression Levels of Nrf2, SOD1, and NQO1 in Testis Tissue
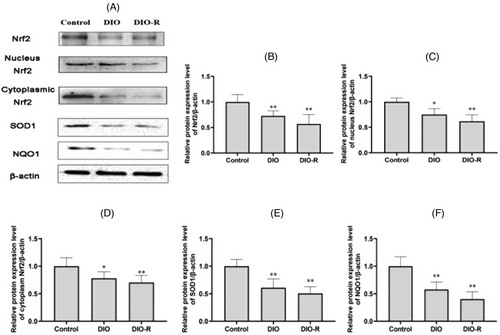
As shown in Figure 4, compared with the Control group, the expression of Nrf2 (total, nucleus, cytoplasmic), SOD1, and NQO1 in the DIO group and DIO-R group decreased significantly (p < 0.05, p < 0.01). However, there was no significant difference between the DIO and DIO-R mice (p > 0.05).
3.1.9 Effect of High Fat Diet on mRNA Expression of Nrf2 in Testis Tissue
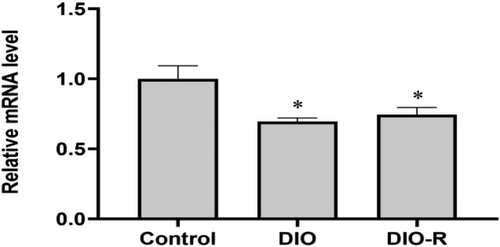
As shown in Figure 5, compared with the Control group, the expression of Nrf2 mRNA in the DIO group and DIO-R group decreased significantly (p < 0.05). However, there was no significant difference between the DIO and DIO-R mice (p > 0.05).
3.1.10 Effect of High Fat Diet on m6A Levels in Testis Tissue
The immunofluorescence results of m6A are shown in Figure 6A,B. Compared with the Control group, the red fluorescence intensity in the DIO-R group and DIO group increased significantly (p < 0.05).
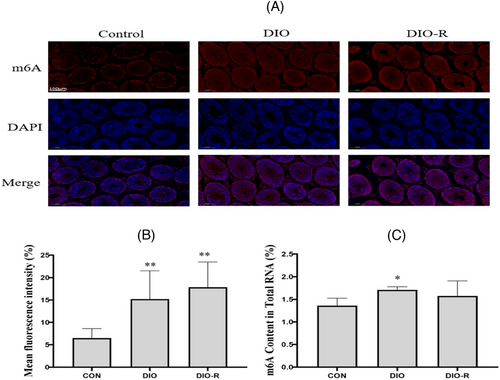
The results of m6A RNA levels detected by the m6A RNA methylation assay kit are shown in Figure 6C. Compared with the Control group, the m6A levels in the testis tissue of the DIO group increased significantly (p < 0.05). The m6A levels in the testis tissue of the DIO-R group also showed an increasing trend. However, there was no significant difference between the Control and DIO-R mice (p > 0.05).
3.1.11 Enrichment of m6A-Modified Nrf2 mRNA in Testis
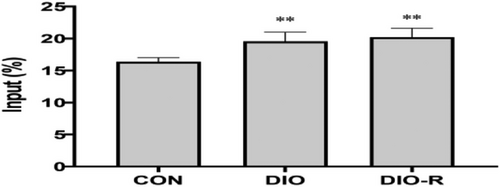
The m6A-IP-qPCR was carried out to evaluate m6A enrichment of Nrf2 mRNA. As shown in Figure 7, m6A modification ratios were significantly higher in the DIO group and DIO-R group than that in the Control Group (p < 0.01). However, there was no significant difference between the DIO and DIO-R mice (p > 0.05).
3.1.12 Effect of High Fat Diet on m6A Regulatory Protein Levels in Testis Tissue
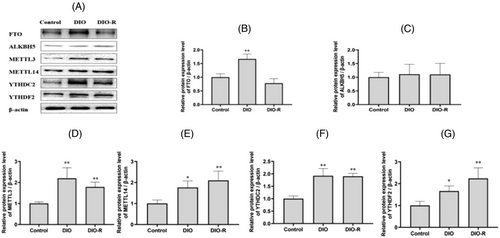
As shown in Figure 8, FTO expression in testis tissue of the DIO group was significantly higher than that in the Control group (p < 0.05). The protein expression of METTL3, METTL14, YTHDC2, and YTHDF2 increased significantly in both the DIO and DIO-R groups compared to the Control group (p < 0.05).
3.2 Cell Results
3.2.1 The Dose of PA Determined by CCK8
As shown in Figure 9A, GC-1 spg cell viability was detected at different concentrations of PA (0, 50, 100, 200, 400 µM). Cell viability decreased significantly at 200 and 400 µM (p < 0.05 and p < 0.01). The expression of Nrf2 was detected by Western blot at different concentrations of PA (0, 50, 100, 200 µM) (Figure 9B). As shown in, Figure 9C, compared to the 0 µM level, the expression of Nrf2 decreased at the 200 µM level (p < 0.05). Finally, 200 µM was selected as the cell experimental concentration.
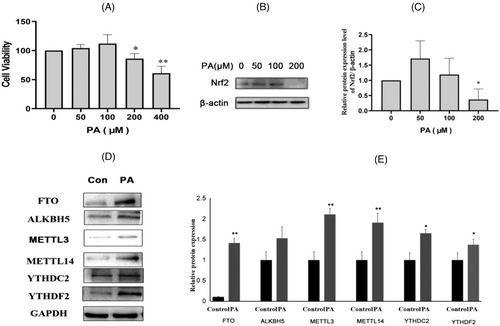
As shown in Figure 9D,E, the protein expression of FTO, METTL3, METTL14, YTHDC2, and YTHDF2 in the PA exposure group was significantly higher than that in the Control group (p < 0.05). The protein results in the cell experiments were consistent with those in the animal experiments; thus, the cell model was established successfully.
3.2.2 The Dose of STM2457, SAH Determined by CCK8 and the Silence Effects of si-YTHDC2 and si-YTHDF2 Determined by Western Blot
As shown in Figure 10A, cell viability was detected at different concentrations of STM2457 (0, 1, 3, 10, 30, 100 µM). Cell viability decreased significantly at 100 µM (p < 0.05). The expression of METTL3 was detected by Western blot at different concentrations of PA (0, 3, 10 µM), Figure 10B. As shown in, Figure 10C, compared to the 0 µM level, the expression of METTL3 decreased at the 10 µM level (p < 0.01). Finally, 10 µM was selected as the STM2457 intervention concentration.
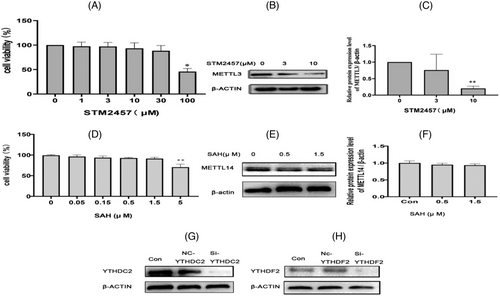
As shown in Figure 10D, cell viability was detected at different concentrations of SAH (0, 0.05, 0.15, 0.5, 1.5, 5 µM). Cell viability decreased significantly at 5 µM (p < 0.05). The expression of METTL14 was detected by Western blot at different concentrations of SAH (0, 0.5, 1.5 µM), Figure 10E. As shown in, Figure 10F, there was no significantly difference of METTL14 among the three groups (p > 0.05). Finally, 1.5 µM was selected as the SAH intervention concentration.
The silence effects of si-YTHDC2 and si-YTHDF2 determined by Western blot (Figure 10G,H). As shown in the Figure 10G,H, the protein expression of YTHDC2 and YTHDF2 in si-YTHDC2 and si-YTHDF2 cells decreased significantly compared to the control cells.
3.2.3 Effect of STM2457, SAH, and YTHDC2 and YTHDF2 Gene Silence on ROS Levels in GC-1 spg Cells
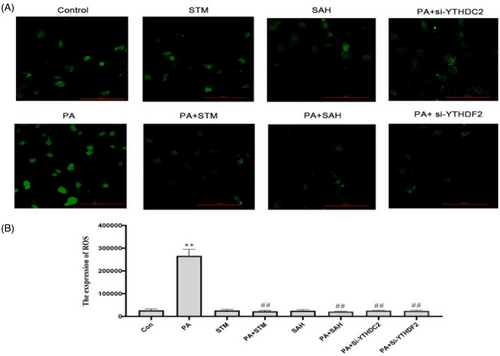
As shown in Figure 11, ROS levels were significantly increased after PA treatment compared to the control group, p < 0.01. It can be seen that PA treatment significantly increased the level of oxidative stress in GC-1 spg cells, and this increasing trend was reversed by STM2457 and SAH treatment (p < 0.01). And this increasing trend was also reversed by YTHDC2 and YTHDF2 gene silence (p < 0.01).
3.2.4 Effect of STM2457, SAH, and YTHDC2 and YTHDF2 Gene Silence on Nrf2 Levels in GC-1 spg Cells
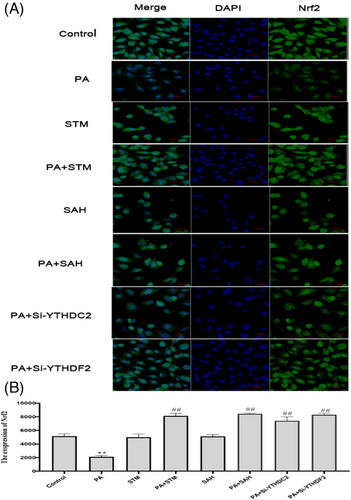
According to the immunofluorescence staining results, the level of Nrf2 was markedly reduced by PA treatment (p < 0.01). However, compared with the PA group, the level of Nrf2 increased in the PA +STM group, PA +SAH group, PA +Si-YTHDC2 group, PA +Si-YTHDF2 group (p < 0.01), Figure 12.
3.2.5 Effect of STM2457, SAH, and YTHDC2 and YTHDF2 Gene Silence on m6A Level in GC-1 spg Cells
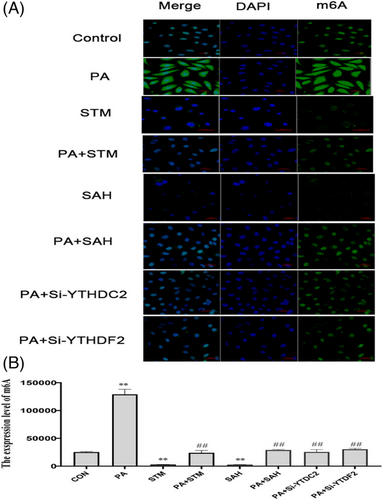
According to the immunofluorescence staining results, the levels of m6A was markedly reduced by STM2457 and SAH treatment (p < 0.01), while, the m6A levels increased following PA treatment (p < 0.01). Co-processing of STM and PA, SAH and PA, Si-YTHDC2 and PA, Si-YTHDF2 and PA effectively restored the level of m6A (p < 0.01), Figure 13.
4 Discussion
These experimental results showed that after a high fat diet for 10 weeks, weight gain in the DIO group was significantly higher than that in the DIO-R group and the Control group, and weight gain in DIO-R mice was significantly lower than that in the Control group. Compared to the Control group, the relative testis weight decreased in DIO mice. In addition, sperm motility and sperm count in the DIO group and DIO-R group were significantly lower than those in the Control group. Light microscopy showed morphological changes in the testis of DIO mice and DIO-R mice. Germ cells and Sertoli cells showed a loose arrangement, decreased cell number, and significant vacuolation was observed in the cytoplasm. Compared with the Control group, the levels of HAse and ACE, T and LH in DIO mice and DIO-R mice decreased. These results indicated that the high fat diet induced substantial damage in the reproductive system of DIO and DIO-R mice, and the high fat diet-induced male reproductive dysfunction model was successfully established.
When investigating the mechanism of male reproduction dysfunction caused by high fat diet, we mainly detected indicators related to oxidative stress. Our previous research showed that oxidative stress in testis tissue may provide evidence to clarify the mechanisms of male reproductive dysfunction caused by high fat diet.[10] In this study, MDA (reflecting oxidative damage) and T-AOC (reflecting antioxidant capacity) levels were also detected. Compared with the Control group, the levels of MDA increased, however, T-AOC level markedly decreased in DIO and DIO-R mice. The important role of oxidative stress in high fat diet on reproductive dysfunction was confirmed.
Nrf2 is an important transcription factor and plays an important role in regulating oxidative stress by inducing and regulating the expression of a series of antioxidant proteins.[18] In this study, we detected the level of Nrf2 and related pathway proteins, NQO1 and SOD1 levels. The results showed that, the expression of Nrf2 (total, nucleus, cytoplasmic), NQO1, SOD1 in the DIO and DIO-R groups significantly decreased compared with the Control group. These findings indicated that reduction of the Nrf2 pathway may play a key role in oxidative stress which has an important role on male reproductive dysfunction caused by high fat diet.
However, the mechanism underlying the reduction of Nrf2 protein level is still unclear. N6-methyladenosine is considered one of the most abundant and functionally relevant modifications of RNAs, and is widespread in the transcriptome with potentially important roles in biological processes.[12, 19] Recent research identified a relationship between m6A and Nrf2 mRNA.[19] The research by Zhao et al. showed that diethylhexyl phthalate (DEHP) exposure led to an increase in m6A modification, and enrichment of m6A-modified Nrf2 mRNA in testis also increased. However, this led to a decrease in Nrf2 protein expression and affected the antioxidant system mediated by Nrf2.[20] Similarly, Arumugam et al. also verified that an increase in m6A enrichment could induce oxidative stress by inhibiting the Nrf2-KEAP1 pathway.[14] Therefore, we speculate that the RNA methylation modification level of Nrf2 (m6A-modified Nrf2) may induce oxidative stress caused by high fat diet.
To verify this speculation, the m6A modification level in the testis of mice was determined by the m6A RNA methylation assay kit and immunofluorescence staining in this study. The results showed that the level of m6A methylation modification in testis was significantly increased in DIO and DIO-R mice compared with Control mice. To verify if the enrichment of m6A-modified Nrf2 mRNA increased, m6A-IP-qPCR was used to detect enrichment of m6A-modified Nrf2 mRNA in testis. The results demonstrated that the enrichment of m6A-modified Nrf2 mRNA in testis of the DIO and DIO-R groups increased markedly compared with the Control group. However, Nrf2 protein expression decreased, which may have been due to inhibition following the increase in enrichment of m6A-modified Nrf2 mRNA in testis. These results were similar to those of Arumugam et al. and Zhao et al.[14, 20].
We also measured the levels of six m6A regulatory proteins in testis tissue.[21] The results showed that compared to the Control group, the protein levels of METTL3 and METTL14 which are “Writers” were significantly increased in the DIO and DIO-R groups. The protein levels of “Readers” YTHDC2 and YTHDF2 also increased significantly. In addition, FTO protein levels were significantly increased in the DIO group. These results indicated that the changes in the modification level of m6A were regulated by m6A regulatory proteins. The increase in METTL3, METTL14, YTHDC2, and YTHDF2 may induce an increase in the level of m6A methylation modification. Higher expression of FTO protein may inhibit the level of m6A methylation modification. We think that there is a greater role for increased METTL3, METTL14, YTHDC2, and YTHDF2 than the inhibitory role of FTO. Thus, a high level of m6A methylation modification was found in this study.
The study by Wu demonstrated that oxidative stress could also regulate the level of m6A methylation modification.[22] Wu's study found that Aflatoxin could induce ROS accumulation in C57BL/6J mice, which resulted in increased m6A modification. Dietary supplementation with resveratrol, an antioxidant drug, can reduce the level of m6A modification.[22] Similarly, the study by Zhong also found that ROS could stimulate RNA m6A methylation modification.[23] There may be some interaction between oxidative stress and m6A modification. In this study, increased MDA level was found. We assume that oxidative damage in the testis may contribute to the increase in m6A modification, which may enhance the decreased expression of Nrf2.
In this study, we divided the high fat diet fed mice into DIO and DIO-R mice. The main difference between DIO and DIO-R was body weight. The weight of DIO mice was significantly higher than control mice, but the weight of DIO-R mice was similar and even lower than Control mice. From these results, damage to the male reproductive system and its mechanism in DIO and DIO-R mice was not different between these two groups of mice, which confirmed that the high fat diet and not increased body weight reduced male reproduction dysfunction.
We believe that the high fat diet induced an increase in m6A regulatory proteins (METTL3, METTL14, YTHDC2, and YTHDF2), which induced an increase in m6A modification level in mouse testicular tissue. The high fat diet particularly induced increased enrichment of m6A-modified Nrf2 mRNA, the Nrf2 pathway was then inhibited, which reduced the expression levels of antioxidant enzymes SOD1 and NQO1, and at the same time, increased oxidative damage was also found in vivo, which together damaged reproductive function, which may be the main reason for the decrease in male reproductive function caused by high fat diet.
To further confirm the mechanism of Nrf2 m6A methylation on reproductive injury affected by high fat diet, the GC-1 spg cell model was selected in the in vitro study. PA is a type of saturated free fatty acid in plasma, it can be selected as an intervention reagent in an in vitro study to simulate exposure to a high fat diet in an in vivo study.[24] In the cell experiments, we found that ROS level increased, Nrf2 expression decreased, m6A level increased, and the related protein expression of m6A (FTO, METTL3, METTL14, YTHDC2, YTHDF2) also increased in PA exposed cells. All cell results were consistent with the animal results, and the GC-1 spg cell model was successfully established. STM2457 (inhibitor of METTL3), SAH (inhibitor of METTL14) was used to treat the GC-1 spg cell model, and gene silence method was used to GC-1 spg cell for decreasing the expression of YTHDC2 and YTHDF2. STM2457, SAH, YTHDC2, and YTHDF2 gene silence was found to reverse the effect of PA on GC-1 spg cells. It was observed that ROS level decreased, Nrf2 expression increased, and the levels of m6A were markedly reduced in the all treatment cells. Thus, high fat diet may induce male reproductive dysfunction, and oxidative stress mediated by methylation of m6A may play an important role in this process.
Acknowledgements
This study was supported by National Natural Science Foundation of China (81671515, 81872640); Young and middle age backbone personnel training programme of Shenyang Pharmaceutical University (ZQN2019006) ; The Liaoning Provincial Natural Science Foundation (2021-MS-217).
Conflict of Interest
The authors declare no conflict of interest.
Open Research
Data Availability Statement
Data available on request from the authors.


