Identification and Validation of Biomarkers in Metabolic Dysfunction-Associated Steatohepatitis Using Machine Learning and Bioinformatics
Funding: This work was supported by the National Natural Science Foundation of China under Grant 82160162 and 81760150, Key Research, Development Program of Jiangxi Province (20243BBI91008), Project of the Second Affiliated Hospital of Nanchang University (2022efyA04) and Jiangxi Province Key Laboratory of Molecular Medicine (No.2024SSY06231).
ABSTRACT
Background
The incidence of metabolic dysfunction-associated steatohepatitis (MASH) is increasing annually. MASH can progress to cirrhosis and hepatocellular carcinoma. However, the early diagnosis of MASH is challenging.
Aim
To screen prospective biomarkers for MASH and verify their effectiveness through in vitro and in vivo experiments.
Methods
Microarray datasets (GSE89632, GSE48452, and GSE63067) from the Gene Expression Omnibus database were used to identify differentially expressed genes (DEGs) between patients with MASH and healthy controls. Machine learning methods such as support vector machine recursive feature elimination and least absolute shrinkage and selection operator were utilized to identify optimum feature genes (OFGs). OFGs were validated using the GSE66676 dataset. CIBERSORT was utilized to illustrate the variations in immune cell abundance between patients with MASH and healthy controls. The correlation between OFGs and immune cell populations was evaluated. The OFGs were validated at both transcriptional and protein levels.
Results
Initially, 37 DEGs were identified in patients with MASH compared with healthy controls. In the enrichment analysis, the DEGs were mainly related to inflammatory responses and immune signal-related pathways. Subsequently, using machine learning algorithms, five genes (FMO1, PEG10, TP53I3, ME1, and TRHDE) were identified as OFGs. The candidate biomarkers were validated in the testing dataset and through experiments with animal and cell models. The malic enzyme (ME1) gene (HGNC:6983) expression was significantly upregulated in MASH samples compared to controls (0.4353 ± 0.2262 vs. −0.06968 ± 0.3222, p = 0.00076). Immune infiltration analysis revealed a negative correlation between ME1 expression and plasma cells (R = −0.77, p = 0.0033).
Conclusion
This study found that ME1 plays a regulatory role in early MASH, which may affect disease progression by mediating plasma cells and T cells gamma delta to regulate immune microenvironment. This finding provides a new idea for the early diagnosis, monitoring and potential therapeutic intervention of MASH.
1 Introduction
Metabolic dysfunction-associated fatty liver disease (MAFLD), previously known as non-alcoholic fatty liver disease (NAFLD), is defined as a fatty liver disease (SLD) characterized by the presence of one or more cardiac metabolic risk factors and the absence of significant alcohol intake (European Association for the Study of the Liver et al. 2024). MASLD encompasses two main subtypes: simple fat infiltration, commonly known as metabolic dysfunction-associated steatotic liver (MASL), and metabolic dysfunction-associated steatohepatitis (MASH). The latter subtype, MASH, replaces the preceding term non-alcoholic steatohepatitis (NASH), representing an inflammatory variant of MASLD. Approximately 20%–25% of MASLD patients eventually progress to MASH (European Association for the Study of the Liver et al. 2024; Sheka et al. 2020; Younossi et al. 2019), which is distinguished by steatosis accompanied by hepatocyte ballooning, liver inflammation, and fibrosis (Koo, Park, and Lee 2020). Due to its asymptomatic and insidious progression, coupled with the variability of early symptoms, MASH is difficult to identify promptly and treatment is often delayed. This delay can exacerbate the condition, potentially leading to cirrhosis, end-stage liver disease, and even hepatocellular carcinoma (HCC), posing a serious threat to people's health and life (Powell, Wong, and Rinella 2021; Bugianesi and Petta 2022). Globally, the prevalence of MASH is 5%, contributing to significant mortality rates worldwide (Parthasarathy, Revelo, and Malhi 2020). Currently, there is no treatment for MASH that has been approved by the U.S. Food and Drug Administration. Therefore, there is an urgent need to effectively identify biomarkers of early MASH, by understanding its pathogenesis, in order to predict prognosis and guide therapeutic interventions.
The activation of the immune system is one of the primary driving factors in MASH (Burtis et al. 2024). The interaction between immune cells infiltrating the liver and hepatocytes promotes the production of proinflammatory cytokines and chemokines, driving the progression from MAFLD to MASH (Meyer et al. 2024). However, the specific immune cell populations infiltrating the immune microenvironment of early-stage MASH and their underlying mechanisms of action are not fully understood at present. Therefore, systematic research on the infiltration of immune cells during early MASH will contribute to the development of novel therapeutic approaches for MASH.
With the advancement of microarray technology and high-throughput sequencing, machine learning has been able to self-train through data mining, statistical learning, and other methods, enabling predictions for new samples (Haug and Drazen 2023; Lin, Lin, and Lane 2020). Currently, machine learning has been widely applied in the clinical domain, particularly in disease prognosis, diagnosis, prediction, and drug discovery, providing significant assistance to clinical medical research. For instance, recent studies leveraging machine learning and bioinformatics have identified biomarkers associated with early MAFLD and key genes related to NASH fibrosis (Chen et al. 2022; Wang et al. 2022).
This study aimed to explore potential biomarkers for early MASH (solely inflammatory stage) and identify the primary immune cell types driving inflammation at this stage. Initially, we analyzed transcriptome data from liver biopsies of patients with early MASH to determine key genes using machine learning methods, assessed their potential biological functions, and conducted transcriptome and protein validations through cellular and animal models. Subsequently, we identified the types of immune cells infiltrating the liver tissue of patients with early MASH and investigated whether the key genes of early MASH are associated with the infiltrating immune cells. By studying the molecular signaling pathways involved in the biomarkers of early MASH, the composition of immune cells, and the interaction between immune cells and the pathogenesis of early MASH, this study provides a deeper understanding of the underlying mechanisms driving early MASH.
2 Materials and Methods
2.1 Data Preparation
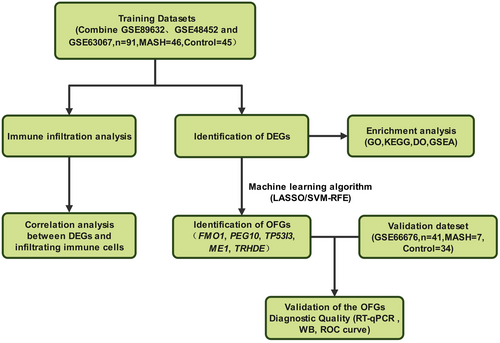
The workflow of this study is shown in Figure 1. The GSE89632, GSE48452, GSE63067, and GSE66676 datasets of NASH in humans were downloaded from the National Center for Biotechnology Information Gene Expression Omnibus (GEO) public database (https://www.ncbi.nlm.nih.gov/geo/) (Barrett et al. 2013). The GSE89632 dataset (19 NASH samples and 24 normal samples) was derived from the GPL14951 platform of the Illumina HumanHT-12 WG-DASL V4.0 R2 expression BeadChip (Arendt et al. 2015). The GSE48452 dataset, comprising 32 samples, was obtained from the GPL11532 platform of [HuGene-1_1-st] Affymetrix Human Gene 1.1 ST Array (Ahrens et al. 2013). The GSE63067 dataset, based on GPL 570, included 16 samples, consisting of 9 NASH samples and 7 controls (Frades et al. 2015). After combining these three datasets, we performed batch normalization using two R packages: “limma” and “sva” (v4.2.2) (Leek et al. 2012). Additionally, we used the GSE66676 dataset, which contains 7 NASH samples and 34 normal samples, as an external validation dataset.
2.2 Identification of DEGs
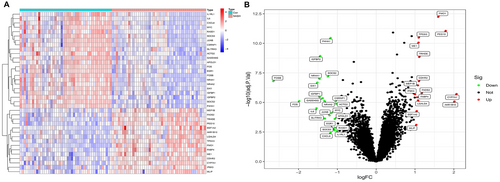
Differential expression analyses of genes within liver tissues from NASH and normal samples in the merged dataset was performed using the “limma” R package (version 3.54.2). Differentially expressed genes (DEGs) were identified with criteria set at |log2FC| > 1.0 and adjusted p-values < 0.05. Subsequently, the “pheatmap” (version 1.0.12) and “ggplot2” (version 3.5.1) R packages were used to create heat maps and volcano plots, respectively, to visualize the up and downregulated DEGs.
2.3 Functional Enrichment Analyses
Gene ontology (GO) and Kyoto Encyclopedia of Genes and Genomes (KEGG) pathway enrichment analysis was performed using the “clusterProfiler” (version 4.6.2) package in R to study biological processes, cellular components, and molecular functions (Yu et al. 2012). The analysis of disease ontology (DO) enrichment in DEGs was performed using the R package “DOSE” (version 3.24.2) (Yu et al. 2015). Gene Set Enrichment Analysis (GSEA) (version 4.1.0) was used for the additional assessment of functional enrichment in DEGs. Enrichment results with adjusted P values of less than 0.05 were deemed significant. For enhanced visualization, the “enrichplot”(version 1.18.4) and “ggplot2” (version 3.5.1) packages were utilized.
2.4 Machine Learning Methods
The LASSO regression analysis was applied for biomarker selection, utilizing the R package “glmnet” (version 4.7-2). Additionally, we implemented support vector machine recursive feature elimination (SVM-RFE), a method merging linear support vector machines with feature selection and backward elimination, utilizing the “e1071” (version 1.3-17), “kernlab” (version 0.9-32), and “caret” (version 6.0-94) R packages. The GSE66676 dataset was used as an external validation cohort to validate the identified biomarkers. We constructed receiver operating characteristic (ROC) curves to comprehensively evaluate the diagnostic potential of specific biomarkers. Subsequently, we employed the “pROC”(version 1.18.5) R package to determine key metrics, including the area under the curve (AUC), accuracy, sensitivity, and specificity. Statistical significance was set at a threshold of p < 0.05 (Robin et al. 2011).
2.5 Construction of MASH Animal Model and Experimental Design
Four-week-old male C57BL/6J mice were purchased from Sleek Jinda Experimental Animals Co. Ltd. (Hunan, China). The animals were acclimatized to laboratory conditions (23°C, 12 h/12 h light/dark, 50% humidity, ad libitum access to food and water) for 2 weeks prior to experimentation. The mice were acclimated for 2 weeks and then randomly assigned to two groups: the control group (n = 6) and the MASH group (n = 6). Throughout the experiment, the control group received a standard maintenance diet (XTCON50J, 3530 kcal/kg, fat 10% kcal, XIETONGSHENGWU, China), whereas the MASH group was fed a diet (XTHF60, 5243 kcal/kg, fat 60% kcal, XIETONGSHENGWU, China) containing 60% fat for 16 weeks. All the mice were euthanized by barbiturate overdose (intravenous injection, 150 mg/kg pentobarbital sodium) for tissue collection.
2.6 Cell Models of MASH
Human Hepatocellular Carcinoma Cells (HepG2; HB-8065) was purchased from the American Type Culture Collection (Manassas, VA, USA). HepG2 cells were cultured in DMEM (Gibco, USA), containing 10% fetal bovine serum (FBS; Gibco, USA), at 37°C with 50 mL/L CO2. Different concentrations of free fatty acids were prepared using oleic acid (OA, APExBIO Technology, USA) and palmitic acid (PA, APExBIO Technology, USA) at a ratio of 2:1. The lipid toxicity cell model was treated with free fatty acids for 24 h.
2.7 Real-Time PCR
Total RNA was extracted from the mouse liver tissue using TRIzol (ThermoFisher, USA). cDNA was synthesized from total RNA using Hifair V one-step RT-gDNA digestion SuperMix (Yeasen, Shanghai, China). RT-qPCR was performed using the Bio-Rad real-time fluorescence quantitative PCR system. GAPDH served as the internal reference, and gene expression analysis was performed using 2−ΔΔCT method by Profiler PCR Array Analysis Software (Qiagen; version 3.5). The primer sequences used for RT-qPCR are listed in Table 1.
| Primer | Forward primer (5′-3′) | Reverse primer (5′-3′) |
|---|---|---|
| GAPDH (Human) | GGAGCGAGATCCCTCCAAAAT | GGCTGTTGTCATACTTCTCATGG |
| GAPDH (Mouse) | TGACCTCAACTACATGGTCTACAT | CTTCCCATTCTCGGCCTTG |
| ME1 (Human) | CTGCTGACACGGAACCCTC | GATCTCCTGACTGTTGAAGGAAG |
| ME1 (Mouse) | GTCGTGCATCTCTCACAGAAG | TGAGGGCAGTTGGTTTTATCTTT |
2.8 Western Blot
The mouse liver tissue was added to the protein lysate buffer (containing RIPA and PMSF with a ratio of 100:1) for liver tissue protein extraction, and then centrifuged to collect the supernatant. The protein concentration was quantitatively measured by BCA, and then an appropriate amount of protein sample was taken for electrophoresis on a 10% SDS-polyacrylamide gel, and then transferred to a PVDF membrane (Millipore) and incubated with ME1 antibody (1:50, Santa Cruz, USA) at 4°C overnight. The next day, the secondary antibody was added for 1 h, followed by washing, exposure, and imaging.
2.9 Immune Infiltration Analyses
We used a computational algorithm from CIBERSORT (https://cibersort.stanford.edu/) to predict variations in immune cell infiltration between individuals with MASH and healthy controls. The correlation between DEGs associated with the diagnosis and immune cells exhibiting differential infiltration was computed and visually represented using the R package “ggplot2” (Newman et al. 2015).
2.10 Oil Red O Staining
Fresh mouse liver tissues were fixed with 4% paraformaldehyde formaldehyde solution, followed by paraffin embedding and sectioning. Paraffin sections were stained with Oil Red O staining kit (Solarbio, Beijing, China), followed by isopropanol washing and hematoxylin staining.
2.11 Immunohistochemical Staining
Paraffin liver tissue sections dewaxing, hydration, antigen retrieval, and blocking. Subsequently, rabbit anti-ME1 (1:1000, proteintech, Cat No. 16619-1-AP) was incubated overnight at 4°C, and then incubated with secondary antibody. In addition, the slices were imaged under a microscope with magnification of ×200. The average optical density (AOD) value of the slices was quantitatively determined by ImageJ software.
2.12 Statistical Analyses
Statistical analyses was conducted using R software (version 4.2.3) employing two-tailed statistical tests. Statistical significance was set at p value < 0.05.
3 Results
3.1 Identification of DEGs
The merged datasets from GSE89632, GSE48452, and GSE63067, comprising 64 patients with NASH and 63 healthy controls, were included in the analyses. A total of 37 DEGs were identified, of which 15 were significantly upregulated and 22 significantly downregulated. Subsequently, heat maps and volcano plots were generated to visually represent these DEGs (Figure 2).
3.2 Functional Enrichment Analyses of DEGs
To explore the biological mechanisms and pathways involved in NASH progression, we conducted GO and KEGG enrichment analyses of DEGs. The screening identified the top 10 biological processes, cellular components, and molecular functions with p-value < 0.05. GO category analysis revealed that the DEGs primarily participate in various biological processes such as “response to lipopolysaccharide,” “monocyte differentiation,” and “regulation of inflammatory response.” Additionally, they represent cellular components such as the “phosphatidylinositol 3-kinase complex,” “endoplasmic reticulum lumen,” and “RNA polymerase II transcription regulator complex.” Furthermore, the DEGs exhibit molecular functions, such as “DNA-binding transcription activator activity,” “DNA-binding transcription factor binding,” and “oxidoreductase activity” (Figure 3A).
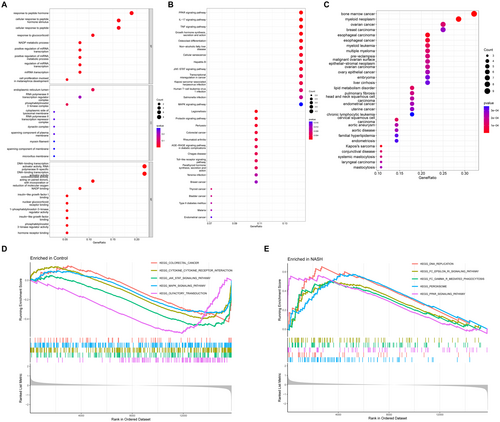
KEGG analysis revealed several immune system-related enrichment pathways, including the interleukin-17 (IL-17), tumor necrosis factor (TNF), and toll-like receptor (TLR) signaling pathways (Figure 3B). Diseases associated with DEGs were identified through DO enrichment analysis, with a Q-value threshold less than 0.05 (Figure 3C). GSEA of all DEG showed that the enriched genome in the control group was significantly associated with olfactory transduction, MAPK signaling pathway, JAK–STAT signaling pathway, and cytokine–receptor interactions (Figure 3D). Furthermore, GSEA of all DEGs revealed that the enriched gene set in the NASH group exhibits significant associations with peroxisome function, DNA replication, Fc gamma R-mediated phagocytosis, and Fc epsilon RI signaling pathway (Figure 3E).
3.3 Screening of Candidate Biomarkers Using Machine Learning Strategies
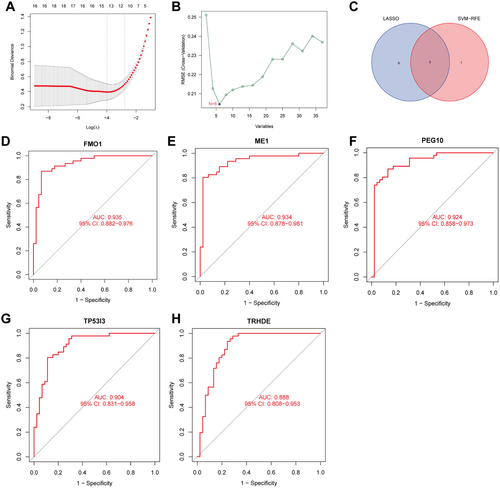
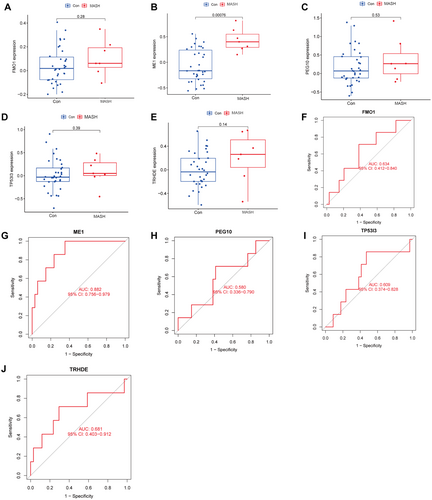
The LASSO logistic regression algorithm was used to screen 14 key genes in the NASH DEGs (Figure 4A), and the SVM-RFE algorithm was used to screen six feature genes (Figure 4B). Finally, the hub biomarkers obtained by the two algorithms were intersected to obtain five overlapping meaningful genes (FMO1, PEG10, TP53I3, ME1, and TRHDE), as shown in the Venn diagram (Figure 4C). To further distinguish hub biomarkers from the five potential biomarkers, ROC analyses were conducted on the merged dataset (Figure 4D–H). The results revealed that these five biomarkers exhibited an AUC of > 0.8 for predicting MASH. After further analyses of the validation set (GSE 66676), we found that only ME 1 (one of the five candidate biomarkers) was significantly increased in the expression levels of MASH samples compared to the control group (0.4353 ± 0.2262 vs. −0.06968 ± 0.3222, p = 0.00076) (Figure 5B), while the expression levels of FMO1, PEG10, TP53I3, and TRHDE were not significantly different (Figure 5A,C–F). This suggests that ME1 may be a reliable biomarker for the diagnosis of MASH. In order to further test the diagnostic efficacy of ME1, we conducted ROC analysis on the testing dataset (GSE66676). The AUC of ME1 in the testing dataset was 0.882 (Figure 5G), while the AUC of the other four genes in the testing dataset was less than 0.8 (Figure 5F,H–J). This indicates that ME1 is a biomarker of MASH-specific expression and has a clear diagnostic value for MASH.
3.4 Validation of OFGs in the In Vivo and In Vitro Hepatic Lipid Toxicity Models
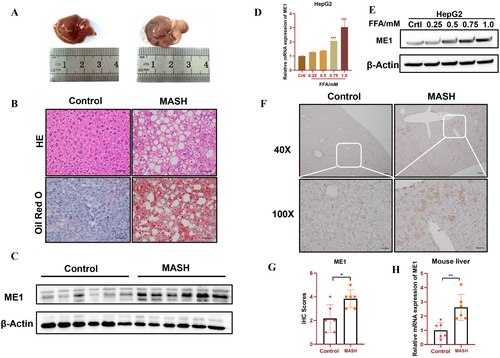
Next, we used qRT-PCR, IHC and WB to verify the expression levels of ME1 in vivo and in vitro. After 24 weeks of high-fat feeding, the liver tissues of the model mice appeared fuller and darker yellow (Figure 6A). Oil Red O and H&E staining revealed a significant increase in lipid droplets in the liver tissues of mice in the high-fat model group, which was accompanied by vacuoles (Figure 6B). Transcriptomic and protein analyses revealed a significant increase in ME1 expression (Figure 6C–E,H). Immunohistochemistry also revealed a noticeable expression of ME1 protein in the cytoplasm after high-fat intervention (Figure 6F,G).
3.5 Analyses of Immune Infiltration and Correlation
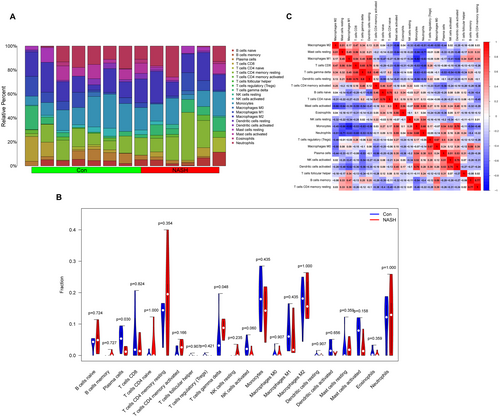
The CIBERSORT algorithm was used as a predictive tool to assess the extent of immune cell infiltration in hepatocytes. Analysis of the results revealed a notably heightened presence of T cells gamma delta in MASH samples compared to their healthy counterparts (p = 0.048) (Figure 7A). Conversely, healthy control samples exhibited a higher prevalence of plasma cell infiltration (p = 0.030) (Figure 7B). Additionally, we conducted comprehensive analyses to evaluate the interrelationships among the 22 immune cell types that had infiltrated the area (Figure 7C). The findings revealed a significant positive correlation (R = 0.8) between T cells gamma delta and resting dendritic cells (Figure 7C). Moreover, monocytes exhibited the most robust negative correlation with macrophages M1 (R = −0.82) (Figure 7C). These insights suggest the potential involvement of T cells gamma delta and resting dendritic cells in the pathology of NASH, alongside a plausible interplay between monocytes and macrophages M1 in the progression of the disease.
3.6 Correlation Analysis of Biomarkers With Infiltrating Immune Cells
Spearman's correlation analysis was conducted to examine the relationship between NASH biomarkers and immune cell infiltration. Notably, the central biomarker ME1 showed a substantial negative correlation with plasma cells (R = −0.77, p = 0.0033; Figure 8A,B). These findings underscore the intricate interplay between NASH biomarkers and specific immune cell subtypes and shed light on potential associations that warrant further investigation.

4 Discussion
MASH represents an inflammatory subtype of MAFLD, which is associated with the progression of liver fibrosis and HCC. Its asymptomatic nature, latent progression, overlap with NAFLD, and variability in early NASH pose challenges in identification and may lead to delayed treatment, potentially progressing to cirrhosis, end-stage liver disease, or even HCC. Therefore, early detection and precise treatment are crucial for managing this condition. Meaningful biomarkers can serve as diagnostic or predictive indicators and therapeutic targets for NAFLD. Currently, the diagnosis of MASH typically involves a combination of medical history taking, physical examination, blood tests, and imaging studies, with “liver biopsy” remaining the gold standard for diagnosis. However, liver biopsy, as an invasive procedure, limits its widespread application (Cotter and Rinella 2020).
In this study, we propose a method for diagnosing early MASH based on transcriptome sequencing of liver tissue and immune cell infiltration analysis in liver biopsy samples. We applied LASSO and SVM-RFE algorithms to screen for prospective biomarkers of early NASH and further validated their efficacy through validation sets and in vitro and in vivo experiments. Additionally, we conducted a correlation analysis between the key gene ME1 and infiltrating immune cells. Our results demonstrate that ME1 is highly expressed in the livers of patients with early MASH and has potential predictive ability for early MASH. The findings of this study are not entirely consistent with previous research. For instance, Shibo Sun and colleagues found that CAMK1D, CENPV, and TRHDE play regulatory roles in NAFLD. In particular, CENPV and TRHDE may affect disease progression by modulating the immune microenvironment through the mediation of resting memory CD4 T cells and naive B cells, respectively (Zhang et al. 2022). In the study by Jianpeng Gao and colleagues, machine learning algorithms were employed to identify key genes, including ME1, AMDHD1, FMO1, LPL, and P4HA1, in patients with nonalcoholic steatohepatitis (NASH) and healthy control groups (Jiang et al. 2023). Additional research identified seven hub genes (SPP1, PROM1, SOX9, EPCAM, THY1, CD34, and MCAM) associated with fibrosis progression (Wang et al. 2022). The discrepancies between the aforementioned studies and the present study may be attributed to differences in patient selection and methods used to evaluate biomarkers. The focus of this study lies in the early stages of MASH, characterized by the presence of fatty changes and inflammation without fibrosis, whereas other studies have encompassed the entire spectrum of MAFLD or specifically targeted the identification of key genes in MASH patients at the fibrotic stage. Furthermore, previous studies and the current study employed distinct bioinformatics and machine learning approaches for screening key genes. Consequently, some variations exist between this study and others.
ME1, as a cytoplasmic NADP (+)-dependent enzyme, actively participates in various metabolic pathways within the cellular system (Ratledge 2014; Allmann et al. 2013; Jiang et al. 2013). Its enzymatic activity promotes the conversion of malic acid to pyruvate, generating NADPH, a crucial component in antioxidant defense, as well as in the synthesis of fatty acids and cholesterol. ME1 acts as a metabolic regulator by modulating lipid/cholesterol biosynthesis, rendering it an insulin-regulated gene found in the liver and in adipose tissues (Al-Dwairi et al. 2012). Upregulation of ME1 gene expression has been observed in adipose, intestinal, and hepatic tissues in a mouse model of obesity induced by a high-fat Western diet (Desmarchelier et al. 2012; López et al. 2003). Simmen et al. (2023) suggested that ME1 serves as a crucial physiological regulator, facilitating crosstalk among various signaling pathways independent of sex. This indicates its potential significance as a targeted therapy for conditions such as obesity, diabetes, fatty liver disease, and cancer in humans (Simmen et al. 2023). These results are consistent with our predicted outcomes. ME1 is involved in lipid biosynthesis-related pathways and is positively correlated with fatty acid and cholesterol levels. Additionally, ME1 expression is related to the microenvironment and oxidative phosphorylation of M2-rich macrophages. For example, ME1 expression can be used as a biomarker of the poor response of AML to hematopoietic stem cell transplantation (Ortiz Rojas et al. 2022). These results indicate that ME1 is involved in immune cell responses, which is consistent with our results. A recent review of the significant metabolic roles of ME1 in fat synthesis, cholesterol production, and cellular redox potential has elevated its potential as a pro-cancer gene by contributing to the cellular cytoplasmic NADPH/NADP pool (Simmen, Alhallak, and Simmen 2020). In epithelial cancers, ME1 promotes carcinogenesis, and its reduction or inhibition leads to a decrease in proliferation, transformation, and migration while simultaneously promoting oxidative stress, apoptosis, and senescence (López et al. 2003). Furthermore, ME1 overexpression is correlated with an adverse prognosis in patients with HCC (Wen et al. 2015). Therefore, focusing on ME1 indicators may have significant implications for the progression, treatment, and prognosis of fatty liver disease.
Inflammatory and immune responses play crucial roles in the progression of MASH. During the inflammatory process, activation of immune cells within affected areas can lead to impaired immune function (Huby and Gautier 2022). The enrichment analyses conducted in the present study indicated a correlation between DEGs and immune reactions as well as inflammatory responses. Specifically, GSEA enrichment analysis revealed associations with FcγR-mediated phagocytosis and FcεRI-mediated mast cell signaling pathways, while KEGG enrichment analysis identified connections with the IL-17 and TLR signaling pathways. The liver is an important immune organ that houses a large number of immune cells. The interaction between innate and adaptive immune cells is crucial for the development and progression of NAFLD (Sutti and Albano 2020). Our study results indicate that liver tissue from patients with early MASH is predominantly infiltrated by γδ T cells, with a decrease in plasma cell infiltration compared to healthy individuals, and a reciprocal relationship exists between plasma cells and γδ T cells. These findings are consistent with those reported by Remmerie A and colleagues. However, further research is needed to fully understand the potential roles of these cells in the pathogenesis of MASH.
This study demonstrates unique innovation in the field of exploring biomarkers for metabolic-MAFLD and its related liver disease spectrum. Unlike previous studies that have largely focused on the late-stage manifestations of NAFLD, such as broad biomarker screening for MAFLD or the more complex metabolic-associated steatohepatitis with cirrhosis, liver failure, and hepatocellular carcinoma (MASH), this study specifically aims at the precise identification and screening of early MASH biomarkers. It not only fills the current research gap in early disease warning but also makes significant contributions to advancing precision prevention and treatment strategies in the field of MAFLD and related diseases.
This study has several limitations that are worth discussing. Firstly, it does not address the urgent need for non-invasive diagnosis of MASH, thus necessitating further clinical trials with blood samples. Secondly, although the candidate biomarkers were validated in animal and cellular models in this study, the experimental conditions may differ from the real environment in humans. Such differences may lead to deviations in the experimental results when applied in practical settings. Additionally, although this study analyzed immune cell infiltration using the CIBERSORT algorithm and found a negative correlation between ME1 expression and plasma cells, this analysis is primarily based on gene expression data, which may not fully reflect the actual functions and interactions of immune cells.
Based on the findings of this study, future research can delve deeper into the following aspects: Firstly, to address the urgent need for non-invasive diagnosis of MASH, biomarker detection in blood samples from patients with early-stage MASH is required. Secondly, diagnostic tools based on the biomarker ME1 can be developed. Thirdly, to gain insights into the regulatory mechanisms of ME1, future studies can utilize experimental approaches such as gene knockout and overexpression to further investigate how ME1 influences the progression of MASH and functions through modulation of the immune microenvironment. Lastly, exploring potential therapeutic targets: future research can explore treatment methods targeting these biomarkers through drug screening or gene therapy, aiming to bring new therapeutic hope to patients with MASH.
5 Conclusion
In this study, ME1 demonstrated good ability to distinguish between patients with MASH and healthy individuals. This will aid in the identification of new targets for the diagnosis and treatment of MASH. Additionally, we found that the unique patterns of immune cell infiltration, including those of plasma cells and gamma delta T cells, may be associated with the development of MASH. These efforts aim to further explore the factors associated with MASH progression in future studies.
Author Contributions
Jian-Ping Liu, Peng Yu, Yu-Ying Zhang, and Jin-E Li conceived and designed the study. Hai-Xia Zeng and Shuang Liu performed the analysis procedures. Shuang Liu and Yun-Fei Luo conducted animal experiments and cellular experiments. Yu-Ying Zhang and Jin-E Li contributed to the writing of the manuscript and the revision of this article. All authors read and approved the final manuscript.
Acknowledgments
I would like to express my sincere appreciation to my supervisor, Ms. Liu, for her academic guidance and personal support through every phase of this dissertation, and also for her encouraging my accomplishment of the whole research. Without her great patience and helpful suggestions, the completion of this dissertation would not have been possible.
Ethics Statement
The animal care and use protocol was the Experimental Animal Welfare Ethics Committee of Nanchang University, China (accession ID number: NCULAE-20221031042).
Conflicts of Interest
The authors declare no conflicts of interest.
Open Research
Data Availability Statement
The datasets utilized and/or examined in the present study can be obtained from the corresponding author upon a reasonable request.


