Sound-Insulation Performance of Polylactic Acid Parts 3D Printed by Fused Filament Fabrication with Functionally Graded Porous Structure for Effective Noise Reduction
Abstract
The emergence of 3D printing technology has enabled the fabrication of absorbers with functionally graded (FG) porous structure and controlled porosity that can absorb sound waves across a broader frequency range. In this study, sound absorption properties of fused filament fabrication (FFF) 3D printed parts with FG porous structure and controlled pore sizes are investigated. For this purpose, samples with single porosity with infill densities of 40% to 90% are first printed to compare with the absorption coefficient of FG porous samples. FG porous samples are also printed as unified structures in two groups of FG porosity 40/50/60% and 70/80/90%. Sound absorption coefficient is tested using the transfer function method and impedance tube sound absorption test system. The experimental results of single porosity samples show that at higher frequencies, samples with lower infill density (higher porosity) have higher sound absorption coefficients, while at lower frequencies, samples with higher infill density (lower porosity) have more effective sound absorption. Unlike uniform porous structures at lower frequencies, FG porous structure provides higher sound absorption without increasing thickness and weight. In addition, it is found that the orientation of samples with the FG porous structure has a different behavior of the sound absorption coefficient.
1 Introduction
Noise pollution is an unwanted sound with psychosocial and physiological impacts on living organisms, especially humans.[1] This type of pollution may cause heart ailments, increased blood pressure, tension, sleep disturbance, and hearing loss, and it may even stimulate the central nervous system to cause hormonal imbalance.[2] The significant sources of noise pollution include construction activities, industrial machinery, and land and air transportation.[3] According to a study, human hearing generally spans between 20 Hz and 20 kHz, and the most critical frequencies for speech intelligibility are those between 500 and 2048 Hz.[4] Therefore, controlling excess noise is necessary to ensure indoor comfort. Efficient sound-absorbing structures are increasingly needed to reduce noise pollution's effects on human health and manage sound waves in various industries.[5] Polymeric foams are widely used to produce sound absorbers. In polymeric foams, sound absorption happens owing to the dissipation of energy of sound waves that travel through a network of small pores. The two dominant mechanisms accomplish this: viscous dissipation, whereby the friction between the air molecules and pore walls drains the energy from the wave, and thermal conduction, which further reduces the energy by converting part of it into heat. Combining these effects makes polymeric foams suitable sound-absorbing materials.[6] However, due to the limitations of this method, it cannot achieve precise control over pore dimensions, resulting in sound absorption that is restricted to a specific frequency range.
To address this issue and produce absorbers with more controlled pore size and capable of absorbing sound over a broader range of frequencies, 3D printing technology, particularly the fused filament fabrication (FFF) method, is well justified. The process is attractive due to several advantages: high precision and speed, low waste, simplicity, and costs relatively lower than other methods.[7-9] In the FFF process, the raw material is in the form of filament. The filament is heated in the nozzle and can flow. Afterward, the melted filament exits continuously from the nozzle. The melted thermoplastic filament is deposed on a bed according to the defined pattern.[10] Nowadays, 3D printing technologies are closely related to innovations in structural acoustic properties. They help produce complex structures with high accuracy, as they hold great potential in developing highly efficient sound absorbers against noise pollution.[11]
In recent years, extensive studies have evaluated the sound absorption capability of different porous materials. For example, Jiang et al.[12] conducted a study to assess the influence of porosity, thickness, and pore diameter on the sound absorption property of samples printed by the FFF method. The results indicate that the peak absorption coefficient's frequency varies with porosity. They propose a criterion for selecting the geometric parameters of 3D-printed porous materials to achieve optimal sound absorption at specific target frequencies. Shafeer et al.[13] demonstrated that 3D-printed polymeric porous structures have good sound absorption at frequencies higher than 2000 Hz. They also considered other parameters, such as porosity and microperforated structures, and concluded that optimizing the pore design significantly increases sound absorption efficiency. Johnston et al.[14] investigated the link between printing parameters and the acoustical behavior of absorbers fabricated by FFF 3D printing. Their test result showed that the acoustic property could be tuned by appropriately adjusting printing parameters. Vašina et al.[15] investigated the sound absorption of porous parts made of acrylonitrile butadiene styrene printed by the FFF method. It was found that the sound absorption characteristics of the tested samples are significantly affected by the type of structure of the porous material (printing pattern of the samples by the 3D printer) inside the impedance tube. Hamid et al.[16] investigated an additive manufacturing (AM) printed lattice structure to enhance the material's acoustic performance. It was validated that such lattice structures allow sound absorption above 1 kHz. Akiwate et al.[17] investigated the acoustic performance of micro-perforated panels integrated with periodic honeycomb structures, fabricated using the FFF technique. Their study revealed that the sound absorption properties of these structures could be tuned by adjusting the perforation size and cell length, enabling control over peak frequency and absorption amplitude. Among the tested perforation shapes, triangular geometries demonstrated superior sound absorption and lower peak frequencies compared to circular and square configurations.
Considering the vast number of research on the acoustic properties of various materials and the potential above, FFF technology (acknowledged as the most economical and widespread technique in AM processes) can considerably enhance the manufacturing of effective acoustic structures.[18] Most plastics used in different industries, for example, polyethylene terephthalate (PET), polyvinyl chloride (PVC), and polyethylene (PE) are derived from non-renewable fossil resources and are difficult to degrade in the environment; they pose a significant threat to human health and the ecosystem.[19-21] Therefore, scientists have been developing new plastics from renewable and environmentally friendly resources, of which polylactic acid (PLA) is one of the most prominent. PLA is obtained by fermenting sugars from renewable sources such as wheat, grains, corn, and sugarcane. Besides being biodegradable, it has other attractive features such as high mechanical strength, ease of manufacturing, non-toxicity or carcinogenicity, low printing temperature, and relatively low cost.[22-24]
Porous materials, such as foams and wools, generally show broadband high sound absorption at higher frequencies but always fare poorly at low frequencies. The reason lies in the characteristics of low-frequency sound waves that require thick sound absorbers for effective sound absorption. Increasing the material thickness to fulfill this condition is economically and environmentally onerous.[25, 26]
Recent research in porous polymer sound absorbers indicates that integrated absorbers, designed with controlled pore size and variable porosity, can achieve much enhanced sound absorption over a more comprehensive frequency range without wasteful materials. In this study, a porous sound-absorbing polymer component was fabricated using FFF with PLA, which is a biopolymer material. PLA was selected as the material for this study due to its ease of processing, excellent printability, mechanical properties, and widespread availability as a filament for FFF 3D printing. PLA's consistent and predictable behavior during printing allows for precise control over complex porous structures with controlled geometries, making it a suitable choice for exploring the sound absorption properties of functionally graded (FG) porous structures. We designed the FG porous structure to maximize sound absorption within a wide frequency range while minimizing the component thickness. The graded porosity design has realized the effective absorption of multiple frequency bands using a single structure with low thickness. In order to know the acoustic performance of the samples, the sound absorption coefficient was measured using an impedance tube. The results show that FG porous materials have promising potential in broader-frequency sound absorption and can be used as a foundation for developing efficient acoustic structures for various audio applications. This study showed FG porous structure polymer structures to be an effective and sustainable solution for noise reduction in all kinds of environments.
2 Experimental Section
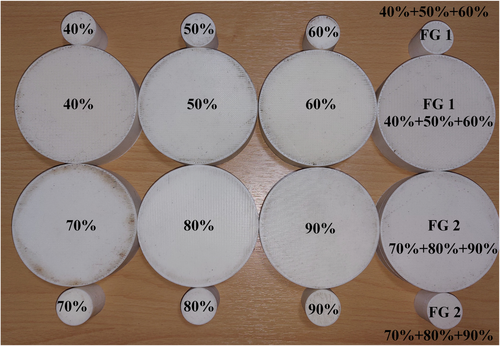
In this study, PLA filament produced by YOUSU, China, with a diameter of 1.75 mm and a temperature range of 190 to 225 °C, was used for printing the sound test samples. Before printing, the filament was dried for 4 h at 50 °C. The samples were modeled using CATIA software. The samples were printed using the Creality (Ender 3-v2 model) 3D printer made in China and based on the 3D printer process parameters listed in Table 1, which are considered constant for all samples. One of the effective parameters in improving the structural properties of 3D printer parts is the infill density of the parts. It represents the material density within the internal structure of printed components and is expressed as a percentage, controlled by the spacing between print lines or rasters. The amount of material density in 3D printing is a very important issue in the characteristics of a part such as mechanical strength, acoustic performance, thermal properties, production time, weight, and overall durability. Adjusting the infill density allows for tailored optimization of these characteristics, making it a crucial consideration in the 3D printing process. Based on this infill density, two series of samples were printed. In the first series, single-porosity samples were printed at six different infill densities (40%, 50%, 60%, 70%, 80%, and 90%) with 30 mm and 100 mm diameters. 3D integrated samples with FG porous structure were printed in the second series. For this purpose, the G-codes generated by the Simplify3D software were changed, and the FG samples were printed in two different modes: 40/50/60% and 70/80/90%. Figure 1 shows the printed samples.
| Parameters | Constant Values | Units |
|---|---|---|
| Printing temperature | 210 | °C |
| Heat bed temperature | 60 | °C |
| Printing speed | 30 | mm −1s |
| Printing infill pattern | Rectilinear | - |
| Layer thickness | 0.2 | mm |
| Raster angle | 0/90 | ° |
| Extrusion width | 0.45 | mm |
| Nozzle diameter | 0.4 | mm |
The sound absorption coefficient of the 3D-printed samples was tested using the transfer function method and the impedance tube sound absorption test system. For this purpose, the BSWA impedance tube device made in China was used. This device consists of two tubes: a large tube with a diameter of 100 mm, which is used for low-frequency measurements, and a small tube with a diameter of 30 mm, used for high-frequency measurements. The experiments were conducted in controlled environmental conditions at the atmospheric condition of 34 °C and 14% relative humidity. All tests were performed in the frequency range of 63–6300 Hz.
In this study, the impact direction of sound waves on the surface of FG porous structure samples was also investigated. FG porous structure samples of 40/50/60% were tested with conditions where the 40% infill density faced the direction of the sound source, herein referred to as FG1, while FG porous structure samples of 70/80/90% were tested with conditions where the 70% infill density faced the sound source, herein referred to as FG2. The reverse setups, denoted as FG R, were performed by placing the samples so that the layer with the highest infill density was facing the sound source. For the FG1 R setup, FG porous structure samples of 40/50/60% were placed with the 60% infill density layer facing the sound source, whereas for the FG2 R setup, the FG porous structure samples of 70/80/90% samples were tested with the 90% infill density layer facing toward the sound source. Figure 2 provides a schematic illustrating the naming conventions and placement configurations of the FG porous structure samples within the impedance tube for clarity on the orientation and testing approach.

3 Results and Discussion
3.1 Sound Absorption of Samples with Single Porosity (Infill Density)
Figure 3a shows the samples' sound absorption coefficient diagram with single infill densities of 40%, 50%, 60%, 70%, 80%, and 90% in the frequency range of 63 to 6300 Hz. The results show that the highest sound absorption coefficient for the sample with 40% infill density was ≈ 0.9 at 2300 Hz. According to the diagram, samples with higher infill density (less porosity) at low frequencies and samples with lower infill density (more porosity) at higher frequencies have a higher sound absorption coefficient. These results are consistent with Lu et al.[27] and Jiang et al.[12] When a sound wave strikes a porous material, it causes the air molecules on the material's surface and within its pores to vibrate. As this occurs, some of the sound energy is dissipated. This dissipation results from energy being transformed from acoustic to thermal due to viscous and thermal losses of the air molecules within the walls and cavities of the material.
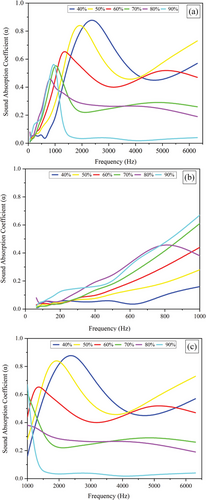
Additionally, the energy loss is influenced by the vibrations of the porous material's elastic structure. In Figure 3b, the sound absorption coefficient of single-porosity samples in the frequency range between 63 and 1000 Hz is displayed with more resolution. Decreasing the infill density by increasing the pore size allows more sound waves to penetrate the absorber. Since the acoustic wave creates pressure fluctuations in the air, the movement of air inside the pores can increase viscous friction, resulting in further reduction of the energy of the acoustic wave. A sample with a lower infill density has a greater volume of interconnected voids, which allows high-frequency sound waves to more easily enter the pores and travel through a labyrinthine path.[28, 29] By moving through this complex network, sound waves lose their energy due to friction and viscous effects with porous walls, and as a result, they absorb sound better at higher frequencies. Higher porosity increases the probability of multiple reflections in pores and contributes to further attenuation through energy dissipation.
On the other hand, based on Figure 3c, which presents the sound absorption coefficient of samples with an infill density of 40% to 90% in the frequency range of 1000–6300 Hz in more detail, at lower frequencies, the wavelength of the sound wave is significantly larger than the pore size. In this scenario, the sound wave can penetrate the material profoundly and increase viscosity and thermal losses. These losses occur when the air molecules inside the pores experience friction against the pore walls and transfer energy to the material.[30, 31]
One of the exciting points of the results is the low peak sound absorption coefficient of 80% single-porosity samples compared to 90% samples, which is different according to the trend of the results. The ability to absorb the sound of porous absorbers is influenced by geometrical and structural parameters, especially the shape and size of the pores. Specific pore sizes or configurations can cause wave interference or resonance, and it may reach a critical point where more reflection or transmission occurs than absorption of sound waves. This may lead to a decrease in the absorption coefficient in a specific frequency range.
3.2 Sound Absorption of Samples with FG Porosity (Infill Density)
The results from the previous section revealed that the FFF 3D-printed porous absorbers with single porosity did not perform optimally at low frequencies. Porous materials with greater thickness are required at these frequencies for more effective absorption.[32, 33] Additionally, it was observed that higher-frequency waves lose more energy due to their shorter wavelength and more remarkable ability to penetrate pores, which increases the sound absorption coefficient in samples with lower infill density. However, excessively low density can reduce the material's stiffness, compromising its sound absorption coefficient efficiency. Therefore, there is an optimal density that maximizes sound absorption performance. FG porous structures were introduced to improve the sound absorption capabilities of the FFF 3D-printed porous samples. The performance of these samples was analyzed and compared to those with single porosity, as shown in Figures 4 and 5. Figure 4a presents the sound absorption coefficients of the 40/50/60% FG porous structures samples, compared with single porous samples printed at infill densities of 30%, 40%, and 50%. Among the tested samples, FG1 R displayed the highest sound absorption coefficient; its value is over 0.95. Meanwhile, the sample with a 40% infill density, which has the highest sound absorption coefficient among the single porosity, has a sound absorption coefficient of less than 0.9. pores of varying sizes (variable porosity) offer a more complex propagation pathway and a greater penetration depth. Additionally, FG1 R exhibits a broader absorption coefficient across the 500 to 6300 Hz frequency range, highlighting its favorable acoustic properties in this study. It can be seen in more detail in Figure 4c.
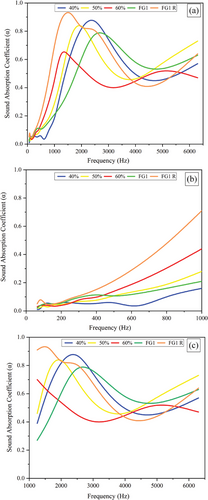
Another key advantage of the FG1 R sample is its high sound absorption at low frequencies. Figure 4b shows that FG1 R samples exhibit higher absorption coefficients in the 63–1000 Hz range than single porous samples with 40%, 50%, and 60% infill densities. Typically, porous structures perform well at higher frequencies but face challenges when addressing low-frequency sound waves. Therefore, to compensate for the poor sound absorption performance of uniformly porous structures at lower frequencies, the graded porosity structure (FG1 R) can offer higher acoustic capability without increasing thickness and weight.[34]
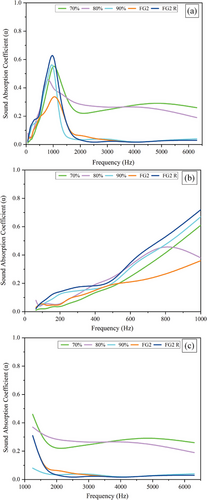
Figure 5a presents the sound absorption coefficients of the 70/80/90% FG porous structures, compared with single porous samples printed at infill densities of 70%, 80%, and 90%. The results show that FG2 R samples exhibit a higher sound absorption coefficient than single porous samples. Specifically, at a frequency of 1000 Hz, the sound absorption coefficient for FG2 R samples is ≈6.3, whereas, for single porous samples with 90% infill density, this coefficient is below 0.6. In order to understand the importance of the sound absorption of the porous structure at low frequencies for the FG2 and FG2 R samples, the value of the sound absorption coefficient in the frequency range of 63 to 1000 Hz was investigated. Based on Figure 5b, it is clear that the FG2 R samples in this frequency range show more sound absorption than the samples with infill densities of 70, 80, and 90%, which have the same pore size in their thickness. The increased internal surface area in FG porous structures promotes viscous and thermal losses as sound waves interact with the pore walls. Smaller pores in the FG porous structure can create narrow pathways that generate more friction and thermal exchange as sound waves are attenuated. This effect is particularly beneficial in low-frequency ranges, where single-porosity samples struggle due to limited energy dissipation within larger, uniform pores.
Additionally, FG2 and FG2 R samples exhibit similar behavior to the 90% infill density sample at frequencies above 1500 Hz (Figure 5c), indicating the influence of smaller pore sizes in this frequency range. At higher frequencies, sound waves have shorter wavelengths, which makes them responsive to smaller pore sizes and finer structural details. Therefore, sound waves can penetrate these smaller pores less easily, causing more sound waves to be reflected instead of effectively absorbed. They become smaller pores in the composite structure due to the presence of 90% porosity may cause acoustic impedance mismatch at high frequencies, leading to increased reflection instead of effective loss.
3.3 The Effect of Sound Wave Direction on Sound Absorption Coefficient of FG Samples
According to Figure 6a, it is clear that the orientation of the samples with FG porous structure relative to the sound source in the transfer function method has a different behavior of sound absorption coefficient. The results show that FG1 R and FG2 R samples have higher peak sound absorption coefficients than FG1 and FG2 samples. In other words, when the denser side of the FG samples is placed on the side of the sound source, these samples show better sound absorption properties. These findings align with the results of Chua et al.[34] When the denser side faces the sound source, the sound waves encounter more material first, leading to higher resistance and energy loss from the start. This primary interaction increases sound absorption as the waves lose energy due to friction and damping in the denser structure. Resonance effects generally enhance sound absorption performance at lower frequencies, such as when the foam layer with the smallest pore size is closest to the sound source.[35, 36] In Figure 6b, which depicts in more detail the performance of the samples at low frequencies, it is clear that the FG1 R and FG2 R samples have a higher sound absorption coefficient than the FG1 and FG2 samples.
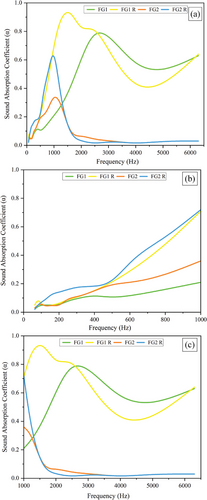
According to the results, the frequency range for sound absorption in the FG1 and FG1 R samples is ≈500–6300 Hz, significantly broader than the frequency range for FG2 and FG2 R samples, ≈ 100–1500 Hz. This means the FG1 and FG1 R samples can cover a more comprehensive frequency range with a higher absorption coefficient. As indicated in Figure 6c, it is evident that the FG1 and FG1 R samples perform better at higher frequencies compared to FG2 and FG2 R samples. This is attributed to the larger pore sizes in FG1 and FG1 R, which lead to more excellent viscous damping and an increased sound absorption coefficient. In contrast, the smaller pore sizes in FG2 and FG2 R result in reduced viscous damping and decreased sound absorption coefficient. According to the study by Cai et al., the optimal pore size for maximum sound absorption coefficient is twice the thickness of the viscous boundary layer.[37] Therefore, if the pore size is very small in graded structures, achieving a good sound absorption coefficient even at higher frequencies becomes challenging. This highlights that the appropriate design of the pores can play a crucial role in enhancing the performance of sound absorbers.
3.4 Noise Reduction Coefficient (NRC) Evaluation
The NRC is a single-number metric for the measure of a material's sound absorption ability. It indicates the mean fraction of the sound energy absorbed at four different frequencies: 250 Hz, 500 Hz, 1000 Hz, and 2000 Hz. A value of 0 suggests a complete reflection of sounds, while that with a 1 implies that all sounds that hit it are perfectly absorbed.[38, 39] Figure 7 describes NRC outputs obtained for samples containing single-porosity and FG structures. The NRC results for the single infill density samples show a clear reduction trend with increasing infill density. For example, the 40% infill density sample has an NRC of 0.37, indicating moderate sound absorption ability due to its relatively open structure and lower material mass. Increasing the infill density to 50% slightly decreases the NRC, meaning that sound absorption is reduced with the material becoming denser and less porous. This trend continues with the 60% infill density sample, which shows further decline in NRC as the reduced porosity limits the ability of the material to dissipate sound energy effectively. Samples having 70%, 80%, and 90% infill densities exhibit lower NRC values. With increasing densities, the material becomes gradually more solid with less porosity. This property allows sound waves to pass through with little loss of energy, so sound absorption becomes significantly less.
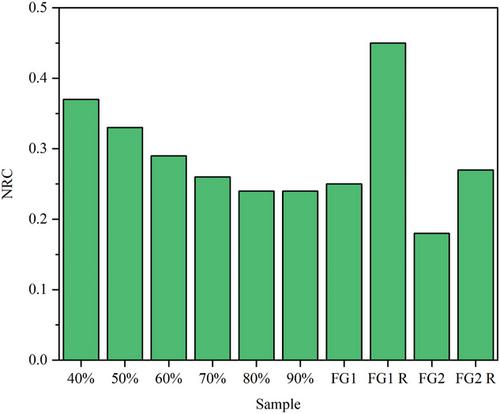
Analyzing the NRC results of the FG porous structures reveals some intriguing insights. The FG1 samples (40/50/60%) exhibited an NRC of 0.25, lower than the NRC values of the samples with single infill densities of 40%, 50%, and 60%. Similarly, the FG2 samples (70/80/90%) demonstrated an even lower NRC of 0.18, significantly below the NRC values of the corresponding single infill densities samples with 70%, 80%, and 90%. However, the reversed configurations (FG1 R and FG2 R) significantly improved sound absorption. FG1 R achieved an NRC of 0.45, significantly higher than the FG1 configuration. Similarly, FG2 R had an NRC of 0.27, outperforming the FG2 configuration. This suggests that the orientation of the FG structure plays an important role in sound absorption, possibly due to the impedance mismatch created by the different densities, which increases the reflection and loss of sound waves.
The results also show that the NRC value for all FG1 R porous structure samples (0.45) is considerably higher than that of all the single infill density samples. This enhanced performance is remarkable even when compared with findings in other studies. For example, in a study by Subramanian et al.[40] on the acoustic properties of 3D printed PLA honeycomb structures filled with nanofillers, the maximum obtained NRC was 0.37. In contrast, the FG1 R samples in this study achieved a higher NRC of 0.45, indicating a better sound absorption capability of the FG design with optimized layer orientation. This comparison well indicates the potential of FG structures to outperform traditional uniform or nanofiller-enhanced designs in acoustic applications. The enhanced NRC of the FG1 R porous structure samples, when compared to the NRC values obtained from the 3D printed ABS samples as documented by Vasina et al.,[41] is evident. The FG1 R samples recorded an NRC of 0.45, which notably exceeds the highest NRC of 0.406 observed for the ABS samples, even in optimal scenarios featuring a thickness of 30 mm and an air gap of 100 mm. This would mean that the FG1 R has better sound absorption characteristics than the regular lattice structures of the ABS samples. The results illustrate the limitations of the regular lattice configurations in achieving high sound absorption and also highlight the benefits of FG designs like FG1 R using optimized layer orientation and density variations for enhanced acoustic performance.
4 Conclusion
-
The sound absorption of the 3D-printed samples was found to be noticeably different according to infill density: the lower the density (higher porosity) of the sample, the better it could absorb sound at higher frequencies, while higher-density samples (lower porosity) perform better at lower frequencies. The sample with an infill density of 40%, for example, showed the highest absorption coefficient value (≈ 0.9) at 2300 Hz.
-
FG porous structures were designed to improve sound absorption in FFF 3D-printed materials, especially at low frequencies where single-porosity samples exhibit poor performance. The FG1 R sample showed the highest absorption coefficient, above 0.95, and presented a strong absorption within a wide frequency range (500–6300 Hz) outperforming the single-porosity samples with similar densities. Its FG porous structures introduces a complex sound propagation path that enhances energy dissipation. Similarly, FG2 R samples exhibited much higher absorption at 1000 Hz than the single-porosity samples. At low frequencies (63–1000 Hz), the internal surface area of the FG structures and narrower pathways increased the viscous and thermal losses, which enhanced the absorption where the single-porosity samples were weak.
-
The study reveals that the orientation of FG porous structures relative to the sound source affects their sound absorption performance. FG1 R and FG2 R samples show higher peak sound absorption coefficients when the denser side faces the sound source, as this initial interaction with the sound waves increases energy dissipation through friction and damping.
-
FG1 and FG1 R samples, with larger pore sizes, exhibit better absorption across a broader frequency range (500–6300 Hz) compared to FG2 and FG2 R samples (100–1500 Hz), which have smaller pores. The larger pores in FG1 and FG1 R facilitate greater viscous damping, improving absorption at higher frequencies. In contrast, smaller pores in FG2 and FG2 R reduce viscous damping, limiting absorption.
-
The NRC results show that single infill density samples exhibit decreasing NRC as infill density increases, with 40% infill achieving the highest NRC (0.37) due to greater porosity. FG porous structures (FG1 and FG2) initially underperform compared to single infill densities. However, reversed configurations (FG1 R) significantly improve NRC (0.45), highlighting the importance of structural orientation in enhancing sound absorption through impedance mismatch and increased wave reflection.
This study highlights that FG porous biodegradable polymer structures offer an effective and sustainable solution for noise reduction in various environments. These structures not only minimize costs and material consumption but also provide a wide-frequency range of sound absorption, making them an ideal foundation for developing efficient acoustic solutions across a variety of audio applications.
Conflict of Interest
The authors declare no conflict of interest.
Open Research
Data Availability Statement
The data that support the findings of this study are available on reasoning request from the corresponding author.


