Using machine learning techniques predicts prognosis of patients with Ewing sarcoma
Type of study: Prognostic study.
Level of evidence: Level III.
Wenhao Chen and Chaoming Zhou contributed equally to this article.
Abstract
Ewing sarcoma is one of the most common types of malignant bone tumor in children and adolescents. However, to our limited knowledge, no study exists that uses machine learning to create algorithms for the prediction of survivorship for Ewing sarcoma. About 2332 patients with Ewing sarcoma between 1975 and 2016 in the United States were identified from Surveillance, Epidemiology, and End Results (SEER) program. All patients in the data set were randomly assigned into the training set and the testing set, at a 2:8 ratio. In the training set, boosted decision tree, support vector machine, nonparametric random forest method, and neural network models were developed to predict the 5-year survivorship. The overall survival rate in 5-year follow-up of this patient cohort is 60.72%. With respect to the algorithms for both cancer specific survival and overall survival, there was slight superiority in our performance metrics favoring the random forest method over the other models for survival prediction, with 77/83% sensitivity and 91/94% specificity, respectively. The random forest method was incorporated into a freely available web-based application. This application can be accessed through https://zryan.shinyapps.io/EwingSarcoma/. Clinical Significance: To the best of our knowledge, this is the first available predictive model for predicting survival in Ewing sarcoma based on machine-learning algorithms. This study may provide orthopedic surgeons with an easily accessible prediction tool when dealing with patients suffering from Ewing sarcoma.
1 INTRODUCTION
Ewing sarcoma is one of the most common types of malignant bone tumor in children and adolescents.1 Ewing sarcoma consists of malignant small round blue cells, derived from primitive neuroectodermal components.2 Approximately 85%–90% of these cells have the classic t(11; 22) EWS/FLI1 translocation.2 The treatment of Ewing sarcoma relies on a multidisciplinary approach, which includes chemotherapy and local therapy (surgery, radiation therapy, or both).3 Owing to the advances in therapeutic strategies, the 5-year overall survival rate of localized Ewing sarcoma has been improved to around 70%.2, 4 However, the 5-year survival rate of patients with Ewing sarcoma metastasis decreases remarkably, which was reported as 20%–45% depending on the sites of metastasis.4 Additional prognostic factors include age, tumor size, tumor site, the use of surgery, radiotherapy, and chemotherapy.5-8
There have been several articles developing nomograms to predict the survivorship of Ewing sarcoma.2, 9, 10 Despite many advantages, the sensitivity and specificity of these nomograms are at about 70%, which can still be improved. Besides, there is a paucity of accessible program in predicting the 5-year survivorship of Ewing sarcoma. Machine leaning is a powerful approach to recognize complex combinations of predictors based on huge amounts of data, by using modern computer and mathematic algorithms. According to musculoskeletal oncology, machine learning has been used for outcome prediction in some studies.11-13 However, to our limited knowledge, no study exists that uses machine learning to create algorithms for primary Ewing sarcoma.
Our study aims to develop machine-learning algorithms with a relatively high accuracy for the prediction of 5-year survivorship in patients with Ewing sarcoma, and to deploy an algorithm as an accessible program which can be widely used in clinical practice.
2 PATIENTS AND METHODS
2.1 Data source
This retrospective cohort study was based on the Surveillance, Epidemiology, and End Results (SEER, https://seer.cancer.gov) database. The SEER program is supported by the US National Cancer Institute, consists of cases from 18 cancer registries, covers approximately 30% of the US population, and reports patient demographics, tumor characteristics, treatment modalities.14 We acquired acceptance of the data access agreement from the SEER administration. No additional Institutional Review Board approval was required for this study because no personal-identifying information is included in this database. Patients diagnosed with Ewing sarcoma were identified using the SEER 18 registries custom database with additional treatment fields, Nov 2018 Sub (1975–2016), under the case-listing session protocol.
2.2 Inclusion and exclusion criteria
The inclusion criteria were listed as follows: (1) patients were diagnosed with Ewing sarcoma (ICD-O-3 codes: 9260) between 1975 and 2016; (2) Ewing sarcoma is the only and the first malignancy for the patient; (3) patients should be actively followed-up; and (4) site and morphology diagnosis were microscopically confirmed. We excluded the patients whose reporting sources were “Autopsy only” or “Death certification only.”
2.3 Data elements
The patient demographic variables of interest included age at diagnosis, sex, race, and marital status (categorized into married, single/divorced/separated/widowed, or unknown). The year of diagnosis was categorized by every 8 years (five categories in total). The primary site of Ewing sarcoma was classified into extremity and axial skeleton. Tumor extension stage was categorized into confined, local invasion, metastasis, and unknown. Tumor size and lymph node invasion were classified according to the 6th edition American Joint Committee on Cancer (AJCC) Staging Manual.15 Tumor grades were grouped into “well differentiated,” “moderately differentiated,” “poorly differentiated,” “undifferentiated,” and “unknown.” Whether the patients were followed by additional tumor was also taken into consideration. Treatment related prognosis factors included surgery (not recommended, recommended but not performed, performed, and unknown), chemotherapy (performed/not performed), and radiotherapy (performed/not performed). Our primary outcomes were defined as 5-year survival rate from diagnosis to cancer specific death (cancer specific survival, CSS) and 5-year survival rate from diagnosis to death from overall causes (overall survival [OS]).
2.4 Statistical analyses
The clinical and demographical characteristics were calculated as frequencies and percentages for categorical variables, whereas mean and SD were used for continuous variables. Variables used for the development of machine learning models included age at diagnosis, year of diagnosis, gender, marital status at diagnosis, primary site, grade, tumor stage, derived AJCC T/N, chemotherapy, radiation, surgery, and if followed by additional tumor. Missing data were imputed by using the nonparametric missForest method.11 Before the process of modeling, all patients in the data set were randomly assigned to the training set and the testing set, at a 2:8 ratio. In the training set, boosted decision tree, support vector machine, nonparametric random forest method, and neural network models were developed to predict the survivorship for patients with Ewing sarcoma, based on previous studies corresponding to machine learning.16, 17 The performance of these models was evaluated by five-fold cross validation.
Boosted decision trees create multiple simple decision tree models and sequentially improve performance by increasing the weight of misclassified examples. Random forest can learn from a series of decision trees and integrate the learning results, so as to obtain better learning effect than single learner. Support vector machines are kernel-based algorithms which can transform the feature space into high-order dimensions, for the definition of a hyperplane for separation. The multilayer perceptron neural networks are models mapping input features into outputs through input, hidden, and output nodes with connections and weights, which are modified by backpropagation of error to optimize the linkages between input features and desired outputs.
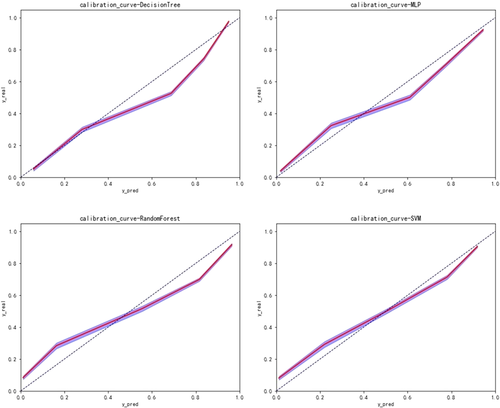
The performance of our prediction model was evaluated with the receiver operating characteristic (ROC) curves and areas under the curves (AUCs), which is a score ranging from 0.50 to 1.0 with 1.0 indicating the highest discriminating score and 0.50 indicating the lowest discriminating score. We also developed calibration curves to compare the discrepancy between the predicted outcome and the real outcome. The closer the calibration curve is to the diagonal, the more accurate the prediction is.
RStudio (Version 1.0.153), Python Version 3.6 (Python Software Foundation) were used for data analysis and model creation.
3 RESULTS
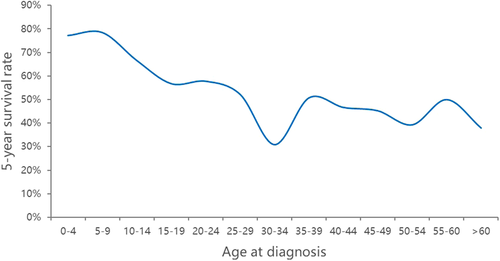
From 1975 to 2016, 2332 patients with a microscopically confirmed diagnosis of Ewing sarcoma were consecutively included in this study. The baseline characteristics of these patients are shown in Table 1. Of these patients, the mean age of diagnosis was 18.73 (SD 12.23). About 1466 of 2332 patients (62.9%) were men. Approximately 308 of 2332 patients (13.2%) were married at diagnosis, with 34 patients having marital status missing. About 1237 of 2332 patients (53.0%) had Ewing sarcoma located in their axial skeleton. A total of 72 patients had missing primary site. About 100 of 2332 patients (4.3%) had tumor grade missing. The 262 of 2332 patients (11.2%) had missing tumor stage. Sixty-nine patients were missing exact size of Ewing sarcoma, which was represented by derived AJCC T, 6th edition. With regard to treatment, 68 patients had unknown status of surgery performed. The mean survival months of these patients were 85.47 (SD 99.77). No patients had missing survival months. The distribution of survivorship based on age at diagnosis is presented in Figure 1. The overall survival rate of this patient cohort is 60.72%.
| Characteristic | Features | Number/mean | Percentage/SD |
|---|---|---|---|
| Age at diagnosis | Men (Std) | 18.73 | 12.23 |
| Sex (female = 1, male = 2) | 1 | 866 | 37.1% |
| 2 | 1466 | 62.9% | |
| Marital status at diagnosis (yes = 1; no = 2; unknown = 0) | 0 | 34 | 1.5% |
| 1 | 308 | 13.2% | |
| 2 | 1990 | 85.3% | |
| Primary site (limbs-1, axial-2, unknown-0) | 0 | 72 | 3.1% |
| 1 | 1023 | 43.9% | |
| 2 | 1237 | 53.0% | |
| Grade(1 = Grade I, 2 = Grade II, 3 = Grade III, 4 = Grade IV, 0 = Unknown) | 0 | 100 | 4.3% |
| 1 | 532 | 22.8% | |
| 2 | 546 | 23.4% | |
| 3 | 499 | 21.4% | |
| 4 | 655 | 28.1% | |
| Tumor stage | 1 | 578 | 24.8% |
| 2 | 804 | 34.5% | |
| 3 | 688 | 29.5% | |
| 4 | 262 | 11.2% | |
| Derived AJCC T, 6th ed (T0 = 0; T1 = 1; T2 = 2; T3 = 3; Tx = 4) | 0 | 8 | 0.3% |
| 1 | 956 | 41.0% | |
| 2 | 600 | 25.7% | |
| 3 | 699 | 30.0% | |
| 4 | 69 | 3.0% | |
| Derived AJCC N, 6th ed (N0 = 0; N1 = 1) | 0 | 1663 | 71.3% |
| 1 | 669 | 28.7% | |
| Radiation (yes = 1, no = 0) | 0 | 1780 | 76.3% |
| 1 | 552 | 23.7% | |
| Year of diagnosis(1975–1983 = 1, 1984–1992 = 2, 1993–2001 = 3, 2002–2010 = 4, 2011–2016 = 5) | 1 | 264 | 11.3% |
| 2 | 310 | 13.3% | |
| 3 | 606 | 26.0% | |
| 4 | 952 | 40.8% | |
| 5 | 200 | 8.6% | |
| Chemotherapy (yes = 1, no = 0) | 0 | 163 | 7.0% |
| 1 | 2169 | 93.0% | |
| Surgery (1 = not recommended, 2 = recommeded but not performed, 3 = performed, 0 = unknown) | 0 | 68 | 2.9% |
| 1 | 715 | 30.7% | |
| 2 | 284 | 12.2% | |
| 3 | 1265 | 54.2% | |
| Followed by additional tumor (1 = no, 0 = yes) | 0 | 12 | 0.5% |
| 1 | 2320 | 99.5% | |
| Cancer-specific death classification (1 = alive, 0 = dead) | 0 | 983 | 42.2% |
| 1 | 1349 | 57.8% |
- Abbreviation: AJCC, American Joint Committee on Cancer.
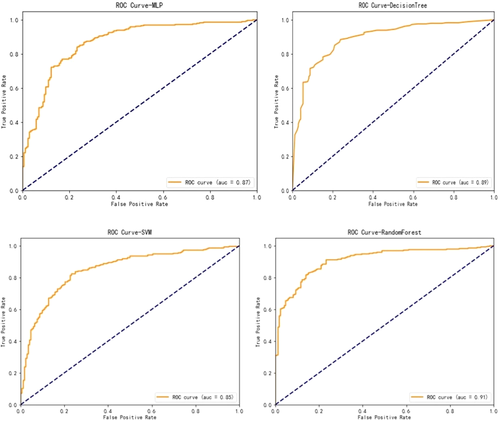
With respect to the algorithms for CSS, boosted decision tree, random forest, support vector machine, and neural network were developed to predict the survivorship of patients with Ewing sarcoma. The performance of these models were evaluated by five-fold cross validation. As shown in Table 2 and Figure 2, there was slight superiority in our performance metrics favoring the random forest method over the other models for survival prediction, with 77% sensitivity and 91% specificity. Model performance was assessed by calibration curves as well (Figure 3). Through multiple validations, the activation function in the multilayer perceptron was relu, the solver was Adam, and the maximum number of iterations was 100. For decision trees, the criterion was entropy, the splitter was random, the maximum number of features was 7, and the minimum number of leaf nodes was 9. For support vector machine, the penalty parameter was set to 10 and gamma was 0.1. For random forest, the number of decision trees was set to 30, the maximum number of features was 3, and the minimum number of samples that leaf nodes can be divided was 14.
| Algorithms | Predictions | Score | AUC | Sensitivity | Specificity | ||
|---|---|---|---|---|---|---|---|
| Dead | Alive | ||||||
| Neural network | Dead | 119 | 53 | 0.82 | 0.87 | 0.69 | 0.89 |
| Alive | 32 | 263 | |||||
| Boosted decision tree | Dead | 132 | 40 | 0.83 | 0.89 | 0.77 | 0.87 |
| Alive | 39 | 256 | |||||
| Support vector machine | Dead | 123 | 49 | 0.80 | 0.85 | 0.72 | 0.84 |
| Alive | 46 | 249 | |||||
| Random Forest | Dead | 132 | 40 | 0.86 | 0.91 | 0.77 | 0.91 |
| Alive | 26 | 269 | |||||
- Abbreviation: AUC, areas under the curve.

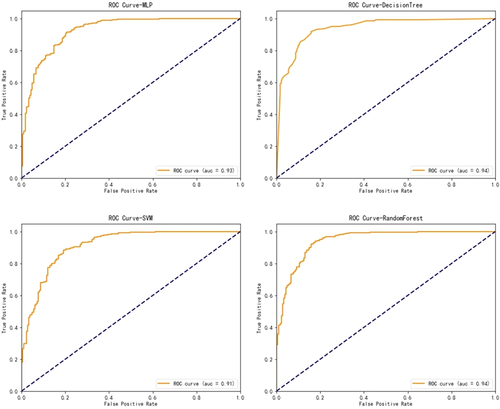
With regard to the algorithms for OS, boosted decision tree, random forest, support vector machine, and neural network were developed to predict the survivorship of patients with Ewing sarcoma. The performance of these models was evaluated by five-fold cross validation. As shown in Table 3 and Figure 4, a slight superiority in our performance metrics was found favoring the random forest method again (83% sensitivity and 94% specificity), over the other models for survival prediction. Model performance was assessed by calibration curves (Figure 5). Through multiple validations, the activation function in the multilayer perceptron was relu, the solver was Adam, and the maximum number of iterations was 200. For decision trees, the criterion was entropy, the splitter was random, the maximum number of features was 11, and the minimum number of leaf nodes was 9. For support vector machine, the penalty parameter was set to 10 and gamma was 0.1. For random forest, the number of decision trees was set to 20, the maximum number of features was 2, and the minimum number of samples that leaf nodes can be divided was 15.
| Algorithms | Predictions | Score | AUC | Sensitivity | Specificity | ||
|---|---|---|---|---|---|---|---|
| dead | alive | ||||||
| Neural network | Dead | 146 | 37 | 0.86 | 0.93 | 0.80 | 0.90 |
| Alive | 27 | 257 | |||||
| Boosted decision tree | Dead | 159 | 24 | 0.87 | 0.94 | 0.87 | 0.87 |
| Alive | 36 | 248 | |||||
| Support vector machine | Dead | 144 | 39 | 0.85 | 0.91 | 0.79 | 0.89 |
| Alive | 31 | 253 | |||||
| Random Forest | Dead | 151 | 32 | 0.90 | 0.94 | 0.83 | 0.94 |
| Alive | 17 | 267 | |||||
- Abbreviation: AUC, areas under the curve.
Although the performance metrics of all models were comparable, the random forest method showed slightly better performance than the other models and was therefore incorporated into a web-based application. It was deployed as a freely available tool for clinicians. The web application can be found on our webpage: https://zryan.shinyapps.io/EwingSarcoma/. It is accessible on desktops, tablets and smartphones.
4 DISCUSSION
Ewing sarcoma is a highly malignant tumor of bone and soft tissues with a peak incidence in adolescence. The survival time of patients with Ewing sarcoma varies greatly, depending on recognized prognostic factors such as age, tumor size, tumor site, metastasis, the use of surgery, radiotherapy, and chemotherapy.18 It has been difficult to predict the prognosis of Ewing sarcoma with a high degree of accuracy. An excellent prediction of survival months of patients with Ewing sarcoma can provide better decision making for orthopedic surgeons. In this study, we developed several models for prognosis prediction of patients with Ewing sarcoma, and the random forest models showed the best performance in predicting the cancer-specific survival rate and the overall survival rate.
About 2332 patients with a microscopically confirmed diagnosis of Ewing sarcoma in the SEER database were retrospectively included in this study. Boosted decision tree, support vector machine, nonparametric random forest method and neural network models were developed to predict the 5-year survivorship for these patients. The results showed that the performance of random forest method exceeded that of all the other models in prediction of cancer-specific death, all-cause death and survival months. For prediction of CSS, the random forest method provided 77% sensitivity and 91% specificity. For prediction of OS, the sensitivity and specificity were 83% and 94%, respectively. There is a paucity in machine-learning algorithms predicting the prognosis of primary Ewing sarcoma. With respect to nomograms, Zhou et al.9 developed a nomogram predicting the prognosis in Ewing sarcoma of bone, based on the SEER database. In this study, the internal validation cohort showed C-indices values (OS: 0.754, 95% CI, 0.705–0.802; CSS: 0.759, 95% CI, 0.700–0.820) and external validation (OS:0.715, 95% CI, 0.634–0.795; CSS: 0.731, 95% CI, 0.650–0.812). Zhang et al.2 established another nomogram predicting disease-specific survival in Ewing sarcoma by using the SEER database as well. The nomogram provided C-index for the 5-year survivals at 0.713. The corresponding value for the external validation cohort was at 0.718. A nomogram was developed by Chen et al.10 and the C-index was 0.728. In addition, a nomogram was developed by Shi et al.19 and C indices were both 0.724 for OS and CSS. According to the results of our study, the machine-learning algorithms we created represented significantly better performance than the nomogram models in the studies mentioned above, after assessed by discrimination, calibration, and overall performance. This program may provide better decision making for orthopedic surgeons when treating patients with Ewing sarcoma.
We acknowledge that our study has several limitations. First, the machine-learning algorithm developed in this study has yet to be externally validated. On the basis of the internal validation (the testing set), the random forest model seems to be the most favorable one. However, the external validation may prove another model to be better. We are willing to make the model accessible to encourage other institutions to validate it externally. Second, because the data used for this study were collected from the SEER database, this study has inherent constraints such as certain variables that have previous been described are missing. For instance, surgical margin is not able to be taken into consideration in our algorithms, which has been described as an important prognostic factor in several studies,1, 20 although others refuted this perspective.21, 22 Unfortunately, the variable “surgery” has been dichotomized into (yes and no) and we have no further information on the type of surgery performed. Third, a considerable amount of data missing is missing in the SEER database. For this study, 3.1% patients had missing primary site, 4.3% had tumor grade missing, 11.2% had missing tumor stage, 3.0% patients were missing exact size of Ewing sarcoma, and 2.9% patients had unknown status of surgery performed. To minimize the negative effect of missing data, all missing variables were imputed by using the nonparametric missForest method in this study.
To the best of our knowledge, this is the first available predictive model for predicting survival in Ewing sarcoma based on machine-learning algorithms. This algorithm may provide orthopedic surgeons with an easily accessible prediction tool when dealing with patients suffering from Ewing sarcoma. While we are actively working on the validation of the algorithm, we are willing to release it, encourage others to validate this model externally with their single- or multi-institutional data, and improve it eventually.
ACKNOWLEDGMENTS
No funding received for this study. All of the authors’ professional and financial affiliations have not biased the presentation.
CONFLICT OF INTERESTS
The authors declare that there are no conflict of interests.
AUTHOR CONTRIBUTIONS
Conceptualization: Wenhao Chen and Chaoming Zhou. Methodology: Wenhao Chen, Hui Chen, and Kainan Lin. Software: Wenhao Chen, Chaoming Zhou, Zibing Zheng and Wenchen Xu. Data Analysis: Wenhao Chen, Zhiyu Yan, Hui Chen, and Kainan Lin. Online application: Wenhao Chen and Zhiyu Yan. Writing: Wenhao Chen and Chaoming Zhou. Supervision: Wenhao Chen and Chaoming Zhou. All authors have read and approved the final submitted manuscript.


