Automatic hip abductor muscle fat fraction estimation and association with early OA cartilage degeneration biomarkers
Abstract
The aim of this study was to develop an automatic segmentation method for hip abductor muscles and find their fat fraction associations with early stage hip osteoarthritis (OA) cartilage degeneration biomarkers. This Institutional Review Board approved, Health Insurance Portability and Accountability Act compliant prospective study recruited 61 patients with evidence of hip OA or Femoroacetabular Impingement (FAI). Magnetic resonance (MR) images were acquired for cartilage segmentation, T1ρ and T2 relaxation times computation and grading of cartilage lesion scores. A 3D V-Net (Dice loss, Adam optimizer, learning rate = 1e−4, batch size = 3) was trained to segment the three muscles (gluteus medius, gluteus minimus, and tensor fascia latae). The V-Net performance was measured using Dice, distance maps between manual and automatic masks, and Bland-Altman plots of the fat fractions and volumes. Associations between muscle fat fraction and T1ρ, T2 relaxation times values were found using voxel based relaxometry (VBR). A p < 0.05 was considered significant. The V-Net had a Dice of 0.90, 0.88, and 0.91 (GMed, GMin, and TFL). The VBR results found associations of fat fraction of all three muscles in early stage OA and FAI patients with T1ρ, T2 relaxation times. Using an automatic, validated segmentation model, the associations derived between OA biomarkers and muscle fat fractions provide insight into early changes that occur in OA, and show that hip abductor muscle fat is associated with markers of cartilage degeneration.
1 INTRODUCTION
Osteoarthritis (OA) affects over 30 million American adults, primarily affecting the weight-bearing joints such as the knee and hip.1 While the main sign of OA is cartilage degeneration, it has been recognized as a whole joint disease, and includes pathological changes like progressive proteoglycan loss and collagen disruption, thickening of the subchondral bone, osteophyte formation, bone deformation, and muscle degeneration.2, 3 Femoroacetabular impingement (FAI) is the symptomatic abutment between the proximal femur and the acetabular rim, and there is evidence that supports the link between FAI and hip OA.4, 5 To support this, abnormal hip morphology (such as cam impingement due to a nonspherical head or excessive coverage of the femur head by the acetabulum) has been identified as an important factor in the development of hip OA.6, 7 Studies have reported that 90% of patients with primary hip OA had an abnormal bony morphology.8 FAI is a pathomechanical process that may lead to early OA in young and active adults, making FAI patients a good cohort to model early development of hip OA.
While it is known that changes in bone morphology can lead to OA, the relationship between bone and muscle is important to understand and develop noninvasive interventions that can target muscle growth, leading to bone growth, slowing down OA progression. It has been proposed that blood flow to limbs is proportional to muscle mass, leading to bone growth.9 Similar genetic factors influence bone and muscle, and a close relationship between bone and muscle is observed via the Indian hedgehog pathway and fibroblast growth factor-2.9 It has also been shown that muscle cells may play an important role in regulating cartilage gene expression.10
Thus, in an effort to recognize the effect of OA on muscles, muscle atrophy, and weakness around the hip have been studied and identified in hip OA.11 For the hip, three abductor muscles act as joint stabilizers in weight-bearing conditions: the gluteus medius (GMed), gluteus minimus (GMin), and tensor fasciae latae (TFL).12 A study has shown that fatty inclusions in muscle reduce muscle force and quality.13 Fatty infiltration in muscle has been compared with the effects of neurological changes, hormonal changes, and inflammatory cytoknines as a potential contributor to loss of muscle force production.14 Intramuscular fat has shown to potentially have effects on insulin resistance, inflammation, and fracture risk among others.15 Type I and II muscle fiber atrophy have been correlated to the length of disease duration in OA.16 A previous study has found higher intramuscular fat fractions in the quadriceps in people with knee OA.17 Increased intramuscular fat content has been identified as a risk factor for OA due to its effect on metabolic pathways.11 Additionally, muscle power has been found to be an independent determinant of pain and quality of life in knee OA.18, 19 A previous study showed that in addition to hip OA, patients with FAI also experience a functional disability during dynamic weight-bearing activities, and have been found to have muscle weakness in their hip, especially a reduced ability to activate the TFL during flexion.20 A previous study, using a small sample size, found that patients with late-stage OA with cartilage degeneration have reduced volumes of the GMed and GMin and increased fatty infiltration of the GMin.21 Given the evidence of quadriceps muscle weakness in knee OA, quadriceps strengthening has been suggested for the management of knee OA.11 However, it remains unclear whether muscle weakness, as seen in knee OA, is observed in hip OA, and therefore, a target for muscle strengthening for hip OA needs to be identified.22
OA progression is often measured using joint space narrowing as quantified by radiograph-based Kellgren-Lawrence (KL) scores, minimal joint space width, Croft scores.23-25 However, compositional change in articular cartilage such as proteoglycan depletion and water loss may occur before joint space narrowing is seen on radiographs. T1ρ, T2 relaxation times provide a measure related to proteoglycan content and collagen orientation, respectively, reflecting the cartilage biochemistry and composition.26, 27 In a previous longitudinal study, patients with hip OA, who demonstrated elongated T1ρ, T2 relaxation times, developed morphological cartilage degeneration, indicating that T1ρ, T2 relaxation times may be biomarkers for early OA.28 Due to the abnormal hip joint contact, elevated T1ρ and T2 relaxation times, similar to as seen in OA patients have also been observed in FAI patients.29, 30
OA is a whole joint disease that affects bone, cartilage, and muscle, with no consensus on which changes occur first. There are no clear links between the fat content in muscle and early hip OA characteristics like cartilage lesions and are furthermore hampered by the fact that manual muscle segmentation and processing make it difficult to accurately extract metrics characterizing muscle. Thus, there is a need to determine if muscle degeneration (reduction in volume and/or increase in fat content) occurs in early OA and if it is associated with cartilage degeneration, to diagnose OA early and potentially slow down disease progression by finding targets for intervention.
To fill these gaps, and address the hypothesis that hip abductor muscle fat is different between patients who have early OA, advance OA and FAI, the goal of this study is twofold: (i) to develop an automatic segmentation and quantification pipeline to estimate the fat fraction and volume in the GMed, GMin, and TFL muscles (ii) to study associations of hip abductor muscle fat fractions with patient age, patient gender, T1ρ and T2 relaxation times.
2 METHOD
2.1 Patient population
The study was approved by the local institutional review board (IRB) and a written informed consent was obtained from all participants before the study. All personnel involved with recruitment, scanning, and analysis of this study were HIPAA (Health Insurance Portability and Accountability Act) compliant. 61 patients were considered as a part of this study, of which 38 were recruited in a hip OA study and 23 in a FAI study. Weight-bearing anterior-posterior radiographs were obtained before the study and scored by an experienced musculoskeletal radiologist with more than 20 years of experience (T.M.L) to assign KL scores. Of the 38 OA patients, 24 patients had KL <2, and 14 had KL = 2,3. The inclusion and exclusion criteria for the OA and FAI studies are in Appendix A (I).
All subjects completed the Hip disability and Osteoarthritis Outcome Score (HOOS) survey before imaging.31 The HOOS survey consists of five different categories: Pain, Symptoms, Quality of Life, Sports and Recreation, Function and Daily Living that are scored on a scale of 0–100, with a higher score representing a better outcome.
Summaries of patient demographics and clinical characteristics (HOOS) can be seen in Appendix A (II).
2.2 MR image acquisition
Images were acquired using a 3 T Discovery 750 MR scanner (GE Healthcare). Subjects were positioned supine feet first, with a 32-channel flexible coil wrapped around the hip of interest. The MR sequences acquired (for both OA and FAI studies) included: (i) Iterative Decomposition of water and fat with Echo Asymmetry and Least-squares estimation spoiled gradient (IDEAL SPGR),32 (ii) Oblique Axial T1-weighted, (iii) 3D sagittal combined T1ρ/T2 Magnetization-Prepared Angle-Modulated Partitioned k-Space Spoiled Gradient Echo Snapshots (MAPSS),33 (iv) Sagittal T2-weighted fat-suppressed and (v) Coronal T2-weighted fat-suppressed (FS) (Table 1).
| MR imaging sequence | Acquisition parameters | Measurements |
|---|---|---|
| 3 plane gradient echo | Localizer-for choosing coverage | |
| 3D combined T1ρ/T2 MAPSSa | TE = 0/10.4/20.8/41.6 ms, TSL = 0/15/30/45 ms, spin lock frequency = 300 Hz, FOV = 14 × 14 cm, matrix size = 256 × 128, slice thickness = 4 mm | Cartilage T1ρ/T2 measurements |
| IDEAL SPGR | TR = 9.3 ms, ETL = 2, number of echoes = 6, FA = 3, FOV = 16 × 16 cm, matrix size = 192 × 192, slice thickness = 4 mm | Compute muscle segmentations, fat fractions and volumes |
| Oblique Axial T1w | TR/TE = 534/7.8 ms, ETL = 3, FOV = 16 × 16 cm, matrix size = 288 × 256, slice thickness = 4 mm | Compute muscle segmentations, fat fractions and volumes |
| Coronal T2 FS | TR/TE = 3000/57.98 ms, ETL = 18, matrix size = 512 × 512, FOV = 20 × 20 cm, slice thickness = 4 mm | Cartilage lesion detection |
| Sagittal T2 FS | TR/TE = 3530/57.28 ms, ETL = 16, matrix size = 512 × 512, FOV = 18 × 18 cm, slice thickness = 3 mm | Cartilage lesion detection |
- Abbreviations: 3D, three-dimensional; ETL, echo train length; FOV, field of view; FS, fat-suppressed; IDEAL, Iterative Decomposition of water and fat with Echo Asymmetry and Least-squares estimation; MAPSS, Magnetization-Prepared Angle-Modulated Partitioned k-Space Spoiled Gradient Echo Snapshots; SPGR, spoiled gradient; TE, echo time; TR, repetition time; TSL, time of spinlock.
- a Li et al.33
2.3 Automatic segmentation pipeline
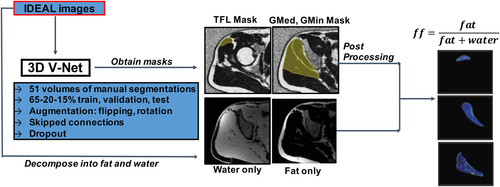
A 3D V-Net, convolutional neural network (CNN) was used for the automatic segmentation of the GMed, GMin, and TFL muscles. This architecture was chosen as it has shown promising results in previous biomedical image segmentations.34 An additional 3D ensemble V-Net was also used for the same segmentations, to see if the ensemble would improve the segmentation performance due to the extra information it was provided. Details on the V-Net architecture, training, and post-processing along with details about the ensemble V-Net are provided in Appendix B.
2.4 Model performance evaluation and muscle fat and volume quantification
Performance of the automatic segmentation was evaluated using Dice coefficient which was computed using the manually segmented masks and those predicted by the V-Net model. Details on the Dice coefficient are provided in Appendix B. While commonly used, Dice has a shortcoming where it does not consider the positions of voxels that are not in the overlap region, which means that they provide the same value independent of the distance of the voxels.35 Additionally, Dice does not give information on the accuracy of the edges of the segmentation, and is automatically greater in larger areas. Thus, to use another efficiency metric besides Dice similarity coefficient, and to visualize where the differences between the manually and automatically computed masks are located, a distance map for each patient was modeled by using the displacement of the vertices in each mask.36, 37 The mean distance (in mm) was computed for each patient using the resolution and the number of pixels seen in the maps.
 (1)
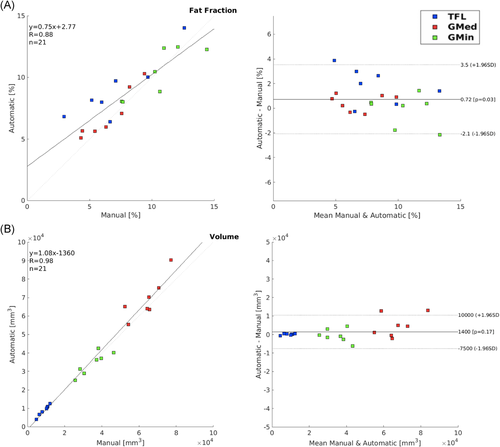
(1)The fat fractions and volumes of each muscle using the predicted and manually segmented masks were calculated and compared to check for interchangeability between manual and automatic segmentation, by plotting a correlation and Bland-Altman plot to compare the two methods of segmentation, and extracting the Pearson correlation coefficient values between the manual and automatic segmentation. Additionally, a Student's t test was used to test if there were any significant differences in the extraction of fat fraction between the two V-Net models. The significance level was set at 0.05.
Figure 1 shows the automatic segmentation and quantification pipeline built and used in this study.
2.5 Statistical analysis
Pearson correlation analysis was performed to identify the relationships between age, gender, fat content, and volumes of the three muscles.
2.6 VBR
VBR was performed to generate maps to locate any associations between muscle fat content and T1ρ and T2 relaxation time values, and to investigate whether these changes were located in weight-bearing areas of the hip cartilage.39 VBR has been previously used for MRI analysis for the hip cartilage and was proved to be accurate and robust to detect local variations in T1ρ and T2 values, and find associations between relaxation times and other biomarkers.28 Pearson partial correlations were used to evaluate the associations between mean fat fraction in the three hip abductor muscles and cartilage relaxation times. VBR was performed on the whole patient cohort, and then stratified into patients with early OA (KL = 0,1), advance OA (KL = 2,3), and FAI. Percentage of voxels showing significant correlation (PSV), average correlation coefficient (R) of voxels showing significant correlation, and average p values (p) of voxels showing significant correlation were reported by SPMs. Age, sex, and BMI were considered as adjusting factors in statistical analyses. Random Field Theory correction was used to take into account possible false positives due to multiple comparisons.40 The significance level was set at 0.05.
3 RESULTS
3.1 Performance of the automatic segmentation pipeline
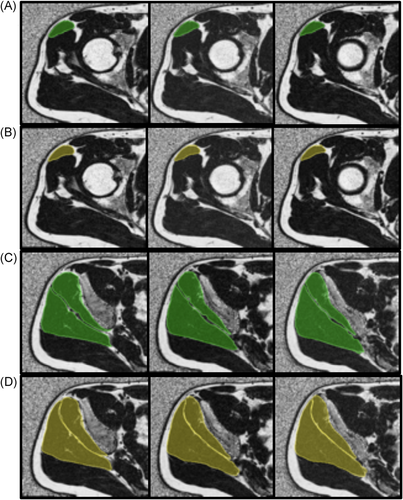
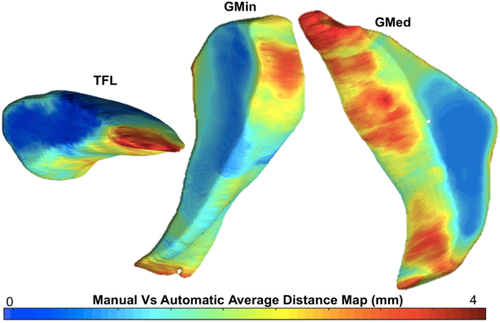
For the manually segmented masks used for training the V-Net, the ICC was computed as 0.94, which ensured that there was minimal variability in the segmentations between the two observers. An example of the manual and automatic segmentation in three slices of each muscle for each V-Net can be seen in Figure 2. The first V-Net provided a mean Dice coefficient of 0.90, 0.88, and 0.91 for the GMed, GMin, and TFL, respectively, on the test set. The Bland–Altman plots showing the difference in fat fractions and volumes in each of the muscles on the test set using the manual masks and the V-Net generated masks are shown in Figure 3. The mean distances computed with the distance mapping were 1.15, 1.19, and 0.74 mm on the GMed, GMin, and TFL, respectively, on the same test set. A mean distance map for each of the muscles is seen in Figure 4. Performance metrics of the ensemble V-Net can be seen in Appendix B. For each patient volume, the algorithm took ~2 s to predict all three muscle segmentations. Going forward, the first V-Net was used to derive the associations, since it had better performance in terms of Dice scores and muscle fat and volume estimation. Additionally, the lack of significant difference between the performance of the two models, tested by the difference in fat fractions computed by each model (p > 0.1), justified the use of a less complex model for the segmentation.
3.2 Associations of muscle fat fractions and volumes with demographics
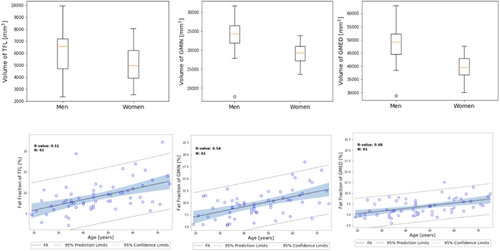
In the whole patient cohort, age was found to be moderately positively associated with the fat fractions in the GMed (R = 0.47, p < 0.001), GMin (R = 0.54, p < 0.0001), and TFL (R = 0.51, p < 0.0001). Gender did not show an association with fat fraction but was associated with the volumes in the GMed (R = −0.60, p < 0.0001), GMin (R = −0.50, p < 0.0001), and TFL (R = −0.26, p < 0.1) (see Appendix B VIII for plots showing these associations).
3.3 VBR results
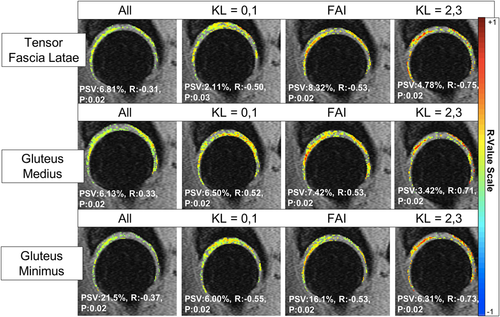
The results for the voxel-based derived associations between muscle fat fractions with T1ρ relaxation times in the whole patient and stratified (KL = 0,1, KL = 2,3, FAI) cohorts can be seen in Figure 5. The results for the voxel-based derived associations between muscle fat fractions with T2 relaxation times in the whole patient and stratified cohorts can be seen in Table 2.
| All | KL = 0, 1 | FAI | KL = 2, 3 | ||
|---|---|---|---|---|---|
| Tensor fascia latae | PSV | 19.50% | 2.05% | 27.47% | 5.35% |
| R | −0.32 | 0.54 | −0.55 | −0.71 | |
| P | 0.02 | 0.02 | 0.02 | 0.02 | |
| Gluteus medius | PSV | 18.94% | 5.55% | 10.21% | 5.40% |
| R | −0.33 | −0.52 | −0.55 | −0.72 | |
| P | 0.02 | 0.02 | 0.02 | 0.02 | |
| Gluteus minimus | PSV | 29.42% | 8.07% | 30.26% | 7.59% |
| R | −0.33 | 0.52 | −0.55 | −0.71 | |
| P | 0.02 | 0.02 | 0.02 | 0.02 |
- Abbreviations: PSV, percentage of significant voxels; R, mean partial Pearson correlation value; P, mean p value.
| OA cohort | FAI cohort | |
|---|---|---|
| Male | 23 (60%) | 14 (60%) |
| Female | 15 (40%) | 9 (40%) |
| Age | 53.39 ± 12.62 | 33.95 ± 9.81 |
| BMI | 23.65 ± 2.55 | 24.00 ± 3.44 |
| Pain | 91.77 ± 14.03 | 62.27 ± 18.45 |
| Symptom | 90.39 ± 12.86 | 60.90 ± 15.70 |
| Quality of life | 87.17 ± 17.34 | 29.26 ± 14.22 |
| Sports/recreation | 92.26 ± 14.34 | 39.48 ± 19.42 |
| Function in daily living | 94.69 ± 12.34 | 67.31 ± 20.79 |
- Abbreviations: BMI, body mass index; HOOS, Hip Disability and Osteoarthritis Outcome Score.
As seen in the Figure 5, for the TFL, in the whole patient cohort, 6.81% of voxels have a weak negative correlation (R = −0.31, p = 0.02) with the fat content. However, in the stratified results, it can be seen that 8.32% of the voxels have a moderate negative correlation (R = −0.53, p = 0.02) with the fat content in the FAI cohort. It can be seen that in the approximate same voxel locations in the cartilage, the advanced OA patients exhibit a strong negative correlation (R = −0.75, p = 0.02) in 4.78% of the voxels.
Similarly, as seen in Figure 5, for the GMed, in the whole patient cohort, 6.13% of voxels have a weak positive correlation (R = 0.33, p = 0.02) with the fat content. However, in the stratified results, it can be seen that 7.42% of the voxels have a moderate positive correlation (R = 0.53, p = 0.02) with the fat content in the FAI cohort. It can be seen that in the approximate same voxel locations in the posterior cartilage, the advanced OA patients exhibit a strong positive correlation (R = 0.71, p = 0.02) in 3.42% of the voxels. The OA and FAI patients also have the similar location of moderate positive correlations in the anterior femoral cartilage.
For the GMin, as seen in Figure 5, in the whole patient cohort, 21.5% of voxels have a weak negative correlation (R = −0.37, p = 0.02) with the fat content. In the stratified results, it can be seen that 16.1% of the voxels have a moderate negative correlation (R = −0.53, p = 0.02) with the fat content in the FAI cohort. It can be seen that in the approximate same voxel locations in the posterior cartilage, the advanced OA patients exhibit a strong negative correlation (R = −0.73, p = 0.02) in 6.31% of the voxels. The OA and FAI patients also have similar location of moderate positive correlations in the weight-bearing region of the acetabular cartilage.
Similar results for T2 relaxation times associations with fat content are seen in Table 2. For TFL, the FAI cohort shows a moderately negative correlation (R = −0.55, p = 0.02) in 27.47% of voxels with fat content, whereas in the whole patient cohort 19.50% of voxels show a weak negative correlation (R = −0.32, p = 0.02). Similarly, in the GMed, the correlation is stronger in the FAI cohort (R = −0.55, p = 0.02, PSV = 10.21%) than in the whole cohort (R = −0.33, p = 0.02, PSV = 18.94) and the late stage OA has strong negative correlations (R = −0.72, p = 0.02) in 5.40 of the voxels. The most voxels with correlations are seen in the GMin, where again, the correlation is stronger in the FAI cohort (R = −0.55, p = 0.02, PSV = 30.26%) than in the whole cohort (R = −0.33, p = 0.02, PSV = 29.42) and the late stage OA has strong negative correlations (R = −0.71, p = 0.02) in 7.59 of the voxels.
4 DISCUSSION
In this study, we showed a feasible, efficient, and fully automatic pipeline to segment the hip abductor muscles and compute their fat fraction and volumes. We observed associations between the fat fractions of the hip abductor muscles and early markers of cartilage degeneration, T1ρ and T2 relaxation times, in patients with hip OA and FAI.
Muscle volume and fat fraction quantification have previously been carried out by semi-manual to fully manual boundary tracing techniques that can be feasible, but are often time consuming and prone to human error. Additionally, manually retrieving the inter-muscular fat fraction can be more challenging due to the blurry boundaries between muscles when fat is present between different muscles.41 Therefore, automated muscle segmentation has been an area of active investigation. Other techniques proposed toward this goal include fuzzy clustering, manual seeding, intensity scaling, and registration-based segmentation.41, 42 While all of these have produced acceptable results, they mostly were applied to 2D images with a limited number of slices that may not cover the entire muscle. The fully automated segmentation and fat fraction and volume quantification pipeline developed by this study was applied to 3D datasets so that it can maximize the coverage of the entire muscle. Additionally, this was the first fully automatic, 3D MR image muscle segmentation pipeline developed for the hip muscles, allowing a greater coverage than a single slice segmentation, thus providing a more complete estimation of fat fraction and volume estimates as compared to those obtained in single slices. Applications of this pipeline could be extended to evaluate muscles around the knee and other joints, for OA, measuring muscle strength, degeneration, evaluation of effects of exercise, and other musculoskeletal studies.
We expected the ensemble V-Net to perform better since it was given more contrast types as inputs and was narrowed down to one muscle only, however, in our case the simpler V-Net showed a slightly better performance. While we expected the additional information to boost the V-Net performance,43 in this case, it was possible that since only 51 patients were used to train the V-Net, there was no utility of the additional information. A larger number of patients would be useful to use the ensemble V-Net where it would have shown a better performance by being invariant to more variability in the data set.
We observed difference in mean muscle volumes between men and women, with women having smaller GMed and GMin volumes as compared to men, which has been previously observed in overall muscle differences between men and women.44 This effect could be due to overall size (women are smaller than men in general), and muscles of the lower limb have been shown to scale with height and body mass.45 Our study found that, in general, the TFL muscle had negative associations between fat content and T1ρ and T2 relaxation times. Casartelli et al have previously shown that patients with FAI have a reduced ability to activate the TFL muscle, as measured by electromyographic activity, during hip flexion.20 This reduction of ability to activate the TFL could explain the changes in load caused to the anterior portion of the cartilage in patients with FAI, which could also lead to OA. Our study indicated that the GMed muscle had negative associations between fat content and T2 relaxation times, but positive associations between fat content and T1ρ relaxation times. These results are important to highlight the different information brought to the table by T1ρ and T2 relaxation times, indicating that the GMed fat content has a different association with the proteoglycan content and collagen orientation. A previous study has found that patients with hip OA demonstrated increased muscle activation in the GMed during stepping tasks, most likely a compensatory mechanism to muscle weakness,46 which could also explain the positive association seen between the fat content and T2 relaxation times. The opposing results seen between GMed and GMin could also indicate a complicated compensatory mechanism, as often seen in patients that have pain and reduced ability to symmetrically use their muscles. Using an automatic segmentation pipeline as developed in this study, could further investigate this asymmetric mechanism in a larger patient cohort.
The most interesting results are seen with the GMin muscle, which contains the highest number of voxels in both T1ρ and T2 relaxation times associations with the fat content. A previous study has shown increased fatty infiltration in GMin with increasing OA severity, however, our results indicate that the increase in fat in GMin was associated with a reduction T1ρ and T2 relaxation times.21 There is preliminary evidence that suggest muscle atrophy starts to occur in more advanced stages of OA.47 In our advanced OA cohort, we still observed that the muscle fat was associated with a reduction in T1ρ and T2 relaxation times. However, it was interesting to see that the location of associations were in the same, anterior regions of the cartilage, indicating that that is the part of the cartilage that may be affected by the GMin fat content. The function of the GMin muscle has also previously been identified as stabilizing the head of the femur in the acetabulum by tightening the capsule.48 Since FAI affects the anatomy of the proximal femur head relative to the acetabulum, we expected to see changes in the GMin fat fraction for FAI patients. We observed this effect, where the FAI patients had stronger correlations with cartilage degeneration markers as compared with the whole cohort. A previous study has found a more pronounced burst of muscle activity in patients with increasing severity of OA in the GMin muscle but nothing significant in the GMed.49 Putting these results together with those from our study, increased GMin activity, lower fat content of GMin and higher fat content of GMed are associated with OA biomarkers, could maybe indicate a compensatory mechanism that may be occurring early in OA or in FAI patients. However, more data would be needed to support this mechanism and confirm any causal effect.
There are some limitations in this study that need to be addressed. First, the manual segmentations had masks for the main coverage of each muscle, which was about six slices each, as a result of which the V-Net also segmented about six slices of each muscle. While this covers most of the entire muscle, there are some edge slices that are not segmented. Second, our associations were observed on a cohort of 61 patients. A larger cohort would be needed for stronger, more robust correlations and generalizability. While using the FAI cohort to model early OA did give insights into the fat fraction changes in the hip abductor muscles before OA onset, a longitudinal study following the same patient cohort would be useful in determining the progression of events in leading to OA. Within our test patient cohort, the maximum fat fraction calculated was 15%, and in a future study, we will evaluate the robustness of the segmentation model on patients with higher fat fractions upon recruitment. Additionally, the effect of patient activity level (which could have significant effect on muscle size) was beyond the scope of this study, and will be considered in future studies. In this study, we used T1ρ relaxation times as a biomarker for OA. While there is evidence that shows a strong link between T1ρ relaxation times and OA linking the biochemical composition of cartilage with T1ρ, its relationship with proteoglycan is not fully understood.50 However, there is research that suggests that T1ρ has a relationship with OA status,51 is a predictor of future morphological progression of OA52 and has a relationship with patient reported outcomes at a voxel based level,28 which justifies its use in this study.
Nevertheless, using state-of-the-art 3D encoder-decoder convolutional neural networks, we were able to produce fast, accurate, and precise automatic segmentations of the hip abductor muscles that are invariant across patients with OA. Additionally, our model demonstrated efficacy in extracting muscle volumes and fat fractions that can be used in the prediction and monitoring of pathology in OA and other studies. This demonstrates our model's interchangeability with manual segmentation, representing an important step toward the clinical translation of quantitative MR imaging techniques. The associations derived between OA biomarkers and fat fractions in the hip abductor muscles provide insight into the early changes that occur before OA is fully developed, indicating that the GMed and GMin could be targeted for early intervention for OA patients.
ACKNOWLEDGMENTS
We would like to thank Alejandro Morales Martinez for helping with the muscle segmentation algorithm. This project was supported by National Institutes of Health P50AR060752 (SM), R01AR069006 (SM/RS), from the National Institute of Arthritis and Musculoskeletal and Skin Diseases, National Institutes of Health, (NIH-NIAMS).
CONFLICT OF INTERESTS
The authors declare that there are no conflict of interests.
AUTHOR CONTRIBUTIONS
Study design: Radhika Tibrewala, Valentina Pedoia, Richard B. Souza, and Sharmila Majumdar. Data processing: Radhika Tibrewala. Clinical expertize: Alan L. Zhang and Thomas M. Link. Manuscript draft: Radhika Tibrewala. Statistical expertize: Jinhee Lee. Obtaining funding: Richard B. Souza and Sharmila Majumdar. All authors have approved the final manuscript.
APPENDIX A
I: Study inclusion/exclusion criteria
OA study inclusion criteria: No history of hip surgery, no symptomatic knee OA, hip joint KL score = 0, 1, 2, 3.
FAI study inclusion criteria: clinical diagnosis of either cam impingement, pincer impingement or a combination of both.
Exclusion criteria for OA and FAI studies: history of hip surgery, history of inflammatory arthritis, history of hemochromatosis, history of sickle cell disease, history of hemoglobinopathy, history of symptomatic knee OA, KL score >3, presence of any condition other than OA that may limit lower extremity function and mobility, MRI contraindications, a positive result from urine pregnancy test for women.
II: Patient demographics and hip disability and Osteoarthritis Outcome Score (HOOS)
APPENDIX B
I: Reason for using V-Net architecture
V-Net segmentation is an end-to-end approach that outputs pixel-wise segmentation mask predictions.34 The V-Net architecture features a symmetrical network that learns an encoding by downsampling the input 3D image with convolutions and then learns to decode the image into a segmentation mask by upsampling with deconvolutions. The network utilized skipped connections to recover full spatial resolution that is lost while downsampling, and added short skip connections which enabled the build of a deep network, while resolving the issue of vanishing gradients. Even though more computationally expensive, the 3D V-Net allowed us to preserve the spatial features of the 3D input image, while giving the network the information about the location of the muscles in regard to each other.
II: Preparation of data for V-Net
For the training of the V-Net, manually segmented 3D volumes of the GMed, GMin and TFL muscles were prepared. Two skilled technicians (C.K. and T.P.) performed manual segmentations on the GMed, GMin and TFL muscles using an in-house MATLAB-based program (Mathworks), on 51 patients from the study population (40 OA, 11 FAI). To assess interpersonal variability between the two technicians performing the segmentations, the intra class correlation (ICC) was computed using a mixed-model reliability testing in SPSS (Version 22.0).
The subjects from the total cohort (OA + FAI) were shuffled and randomly divided into training, validation, and testing sets with a 65–20–15% split. With this technique, the model gets optimized on a fixed split of training and validation and the final performance is assessed on a testing set that has never been used for model optimization. No significant differences in cartilage lesion scores, age, gender or BMI were observed in the training, validation, and testing groups. For all three muscles, we performed augmentation on the training set to increase the data set by three times, to “teach” the model to be invariant to small geometric deformities, and help in preventing overfitting from small datasets.53 Specifically, the data set was augmented by flipping along the medial-lateral axis, to be invariant to the side of the hip, and a rotation of various angles between −5° and 5° was applied to augment the data set without major anatomical deformation. This 3D V-Net network required input of all 20 slices of the IDEAL sequence of each patient and generated a corresponding 3-class segmented mask for each muscle in the input slices.
III: Details on dice coefficient
Dice is an overlap index that is the most commonly used metric in validating medical volume segmentations. It is calculated using equation 2∣∣T ∩ P∣∣/|T| + |P|, where T is the true manual segmentation map and P is the predicted segmentation map.54
IV: Ensemble V-Net experiment
Using the same train, validation, and test split (as described in Appendix B II), another ensemble 3D V-Net was developed, which combined the output of two separate V-Nets. In one V-Net, 1 channel of the IDEAL sequence was given and in the other V-Net, 3 channels consisting of the IDEAL, in-phase, and fat images were provided. For both of them, only relevant slices of each muscle were used as input (superior slices for TFL, posterior slices for GMed and GMin). The prediction of the two was combined by averaging the class probabilities to yield a segmentation mask per muscle. The goal of developing this ensemble V-Net was twofold: (i) to see if narrowing down the segmentation to each muscle rather than the entire volume would improve the results for each muscle (ii) to see if giving more contrast information in the different channels would improve the results.
V: Model training
Both the V-Nets were implemented in TensorFlow, version 1.4 (Google) and used Dice loss, an Adam optimizer, a learning rate = 1e−4, and a batch size = 3 and trained for 100 epochs for 6 h on a Nvidia Titan X GPU. The best model was chosen based on the lowest loss seen in the validation data set and then tested on unseen hold-out test set. All the performance results reported in this study are computed on the hold-out test set.
VI: Postprocessing
The masks automatically generated by V-Net were undergoing simple post-processing using MATLAB 2015b (Mathworks). Any extra pixels were removed by keeping only the largest connected component, and any holes within the mask were filled. The perimeter of the mask was extracted and dilated by a structuring element (disk, radius = 1). The same fully automatic postprocessing procedure was applied to all the subjects in the validation and hold-out test set.
VII: Results on ensemble V-Net
The second ensemble V-Net showed a mean Dice of 0.90, 0.86, and 0.86 on the GMed, GMin, and TFL respectively, on the test set. The mean distances computed with the distance mapping were 1.27, 1.53, and 1.07 mm on the GMed, GMin, and TFL, respectively, on the test set. The correlation coefficient between the manual and automatically obtained fat fractions was 0.87, and 0.98 for the volume.


