T2-weighted magnetic resonance imaging texture as predictor of low back pain: A texture analysis-based classification pipeline to symptomatic and asymptomatic cases
Abstract
Low back pain is a very common symptom and the leading cause of disability throughout the world. Several degenerative imaging findings seen on magnetic resonance imaging are associated with low back pain but none of them is specific for the presence of low back pain as abnormal findings are prevalent among asymptomatic subjects as well. The purpose of this population-based study was to investigate if more specific magnetic resonance imaging predictors of low back pain could be found via texture analysis and machine learning. We used this methodology to classify T2-weighted magnetic resonance images from the Northern Finland Birth Cohort 1966 data to symptomatic and asymptomatic groups. Lumbar spine magnetic resonance imaging was performed using a fast spin-echo sequence at 1.5 T. Texture analysis pipeline consisting of textural feature extraction, principal component analysis, and logistic regression classifier was applied to the data to classify them into symptomatic (clinically relevant pain with frequency ≥30 days and intensity ≥6/10) and asymptomatic (frequency ≤7 days, intensity ≤3/10, and no previous pain episodes in the follow-up period) groups. Best classification results were observed applying texture analysis to the two lowest intervertebral discs (L4-L5 and L5-S1), with accuracy of 83%, specificity of 83%, sensitivity of 82%, negative predictive value of 94%, precision of 56%, and receiver operating characteristic area-under-curve of 0.91. To conclude, textural features from T2-weighted magnetic resonance images can be applied in low back pain classification.
1 INTRODUCTION
Low back pain (LBP) is a complex condition in which biological, psychological, and social factors impact on both the experience of back pain and associated disability.1 LBP is a very common symptom and the leading cause of disability throughout the world.1 Consequently, LBP amounts to a considerable amount of annual costs worldwide when healthcare costs and indirect costs from sick leaves are considered.2
LBP may result from an injury or degenerative process of the lumbar innervated tissues such as facet joints, intervertebral discs (IVDs), ligaments, or muscles. Several studies have shown that LBP is related to annular tears,3, 4 disc height narrowing,3 facet (or apophyseal) joint degeneration,5 and endplate lesions such as Schmorl's nodes, fractures, erosion, and calcifications.6
Magnetic resonance imaging (MRI) is the preferred imaging modality for most spinal diseases, as it allows illustration of vertebrae, IVDs, musculature, nerve roots, foramina, and facet joints with good contrast.7 MRI studies are often used to confirm IVD herniation, nerve root entrapment, spinal canal stenosis, and more serious pathologies such as trauma or tumor metastases.8 MRI can also show IVD degeneration and vertebral endplate changes that have been associated with clinically relevant LBP.9-11 However, these abnormalities are also common among asymptomatic subjects as imaging studies have revealed that up to 87% of asymptomatic people have lumbar IVD abnormalities seen in MRI.12-14 Thus, lesions or degenerative changes revealed in MRI studies may not be representative of clinical symptoms.15, 16 LBP that cannot be attributed to any known pathology is called nonspecific LBP.
Despite these diagnostic challenges of LBP, substantial effort has been made to find a connection between LBP and MRI findings. Disc degeneration is categorized into five grades, also known as Pfirrmann grades, correlating loss of IVD signal intensity and height in T2-weighted MRI to progressive degenerative changes.17 Associations between LBP and degenerative changes seen in T2-weighted MRI have been observed.18-22 Disc herniation revealed on MRI has been related to LBP in sciatica patients.23 Multifidus fat infiltrations visible in T2-weighted MRI have been strongly associated with ever having LBP and leg pain.24, 25 The so-called Modic changes categorize degenerative changes in vertebral endplate and bone marrow into three types,26 and a significant association has been found between them and pain as well.27, 28 Furthermore, correlation between Modic changes and Pfirrman grades of disc degeneration has been observed.29
Radiomics stands for the extraction of quantitative features from radiographic medical images. This process consists of image acquisition, reconstruction, segmentation, extraction of features, and building a data analysis pipeline for the given task. Radiomics studies are often conducted by means of texture analysis (TA), which refers to the characterization of images by their texture content. TA encodes images into feature vectors that characterize image properties such as roughness or smoothness by analyzing spatial variation in pixel intensities. Usually, a large amount of features is collected, and afterward, the most important ones are selected by statistical methods, or alternatively, data are transformed into a fewer-dimensional space by dimensionality reduction techniques such as principal component analysis, to avoid the so-called “curse of dimensionality.” Statistical measures or machine learning methods can then be applied to classify these feature data. Recent scientific contributions to using this methodology in spinal MRI include, but are not limited to, assessment of fatty infiltrations in paraspinal musculature,30, 31 classification of spinal metastases of different origins,32-34 automatic categorization of Modic changes,35 quantitative analysis of neural foramina,36 quantification of vertebral bone marrow alterations due to aging,37 and distinguishing bone metastases from spinal hyperplastic hematopoietic bone marrow.38
Automation or semiautomation of image processing steps, such as reconstruction, noise and artifact removal, or segmentation makes the imaging pipeline more fluent and time-efficient, and artificial intelligence (AI)–enhanced analysis of imaging findings can greatly relieve the workload of often-overburdened medical professionals.39-41 If AI could be used to perform routine tasks or process clear negative findings, more human resources could be used for cases that are more challenging to diagnose.
To our best knowledge, the association between TA of lumbar MRI and the level of LBP individuals are experiencing has not been previously studied. Therefore, the aim of this study is to investigate whether TA could yield more specific MRI predictors of LBP that could classify lumbar MRI data to symptomatic and asymptomatic cases. Furthermore, our aim is to compare predictive ability between (1) discs and vertebral bodies and (2) upper and lower lumbar levels. Finally, we aim to project our results to a subset of data exhibiting nonspecific LBP symptoms. Such AI-enhanced analysis could be beneficial in the ever-increasing flow of radiological images in terms of time and resource savings.
2 METHODS
2.1 Level of evidence
The level of evidence of this prospective cohort study is 2.
2.2 Data
The Northern Finland Birth Cohort 1966 (NFBC1966, http://www.oulu.fi/nfbc/) data were used in this study. The NFBC1966 is a prospective population-based birth cohort. The collection of NFBC1966 data started in 1965 in Northern Finland. Pregnant women living in Oulu and Lapland were asked during their maternity clinic appointment to take part in the NFBC1966. The inclusion criterion was that the child's expected date of birth was between January 1st and December 31st, 1966. Health and lifestyle data on the mothers (N = 12 068) and children (N = 12 231) have been collected ever since, via postal questionnaires and clinical examinations.42
Postal questionnaires on health status and lifestyle were sent to the cohort members whose addresses were known (N = 10 321) at the age of 46–48 (2012–2014). Out of the 66% of the recipients (N = 6 825) who responded with the filled questionnaires, those who currently lived in Finland were invited to clinical examinations, which 57% of the recipients (N = 5 861) attended. Among other examinations, height, and weight (i.e. total body mass) were measured by a trained study nurse, and body mass index (BMI, kg/m2) was calculated from these measurements.
Prevalence of LBP over a period of 12 months was elicited by a questionnaire. The first question was “Have you had any aches or pains in your low back?” Drawings were used to elucidate the correct anatomical area. The alternatives to respond to this question were (1) no and (2) yes. In the case of a positive answer, the second question was “How often have you had aches or pains during the last 12 months?” to which the alternatives were (1) 1‒7 days, (2) 8‒30 days, (3) more than 30 days, and (4) daily. In addition, the individuals reporting pain during the past 12 months were asked about the intensity of the pain they were experiencing, using a numerical rating scale from 0 (no pain) to 10 (extremely severe or bothersome pain).
An invitation to undergo lumbar MRI examinations was sent to cohort members that participated in the clinical examinations living no more than 100 km from the city of Oulu (N = 1 988). A total of 1 540 cohort members underwent MRI of the spine.
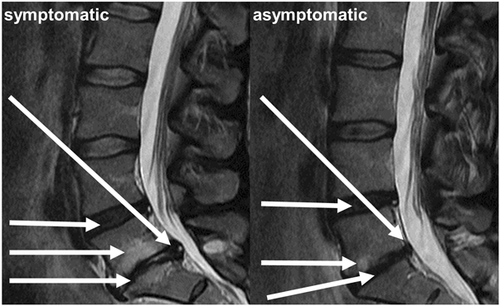
T2-weighting was chosen as the studied MRI contrast because it allows for clear visualization of both the vertebrae and IVDs. For texture analysis, mid-sagittal slice images were selected from the imaged volumes. Imaging was performed on a Signa HDxt 1.5 T MRI system (GE Healthcare) using a fast spin-echo sequence (TE = 112.7 ms, TR = 3,500 ms, ETL = 27, slice thickness = 4 mm, matrix size = 512 × 512, and FOV = 280 × 280 mm). Based on the pain characteristics in the questionnaire at the time of imaging, two groups were formed for classification: subjects with clinically relevant pain (frequency ≥30 days and intensity ≥6/10), and no pain (frequency ≤7 days, intensity ≤3/10, and no previous pain episodes in the follow-up period). These cut-offs were motivated by the data: pain intensity of greater than or equal to 6 was perceived as clearly symptomatic and, on the other hand, very mild and infrequent pain symptoms are common and likely not a sign of prolonged LBP. These criteria were met by 518 subjects, comprising 110 and 408 subjects in the symptomatic and asymptomatic groups, respectively. Descriptive statistics about demographic variables, as well as Modic changes and Pfirrmann grades that were read by two independent physicians, are shown in Table 1. Statistical methods used on the data in Table 1 were the independent t test for continuous variables (distribution normality was tested with the Kolmogorov–Smirnov test) and the χ2 test (with contingency tables) for binary variables. Figure 1 shows example images of symptomatic and asymptomatic patients with typical spinal degeneration phenotypes seen in MRI.
| Symptomatic (N = 110, 21%) | Asymptomatic (N = 408, 79%) | |
|---|---|---|
| N (%) | ||
| Male* | 43 (39%) | 210 (51%) |
| Female* | 67 (61%) | 198 (49%) |
| Modic type 1* | 24 (22%) | 50 (12%) |
| Modic type 2* | 41 (37%) | 99 (24%) |
| Modic type 3* | 19 (17%) | 31 (7.6%) |
| Pfirrman 1 | 1 (0.9%) | 1 (0.2%) |
| Pfirrman 2 | 103 (94%) | 393 (96%) |
| Pfirrman 3 | 80 (73%) | 289 (71%) |
| Pfirrman 4* | 60 (55%) | 164 (40%) |
| Pfirrman 5* | 30 (27%) | 54 (13%) |
| mean ± STD | ||
|---|---|---|
| Weight | 80.2 ± 16.1 | 77.6 ± 15.1 |
| Height | 170.2 ± 9.2 | 171.9 ± 9.2 |
| BMI † | 27.6 ± 4.6 | 26.2 ± 4.4 |
- Note: Modic changes and Pfirrman grades are listed by incidence of each grade across all lumbar levels.
- Abbreviations: BMI, body mass index; STD, standard deviation.
- * Variable significantly different between the symptomatic and asymptomatic groups (p < .05), χ2 test with contingency tables.
- † Variable significantly different between the two groups (p < .05), independent t-test.
2.3 Image segmentation with U-net
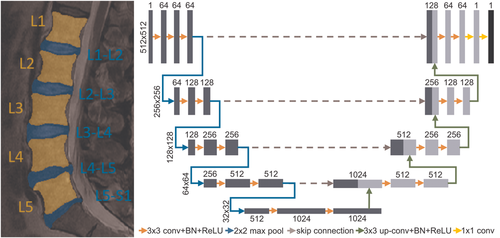
Before texture analysis, lumbar vertebrae L1…L5 and IVDs L1-L2…L5-S1 were segmented from the MR images (Figure 2). 200 samples were segmented by hand and used to train a U-net43 deep learning convolutional neural network that is known to perform well in segmentation tasks. A subset of 15% of the training data was used for model validation. The U-net comprised of five encoding and four decoding layers and was trained for 300 epochs using the combination of binary cross-entropy and Jaccard index (with equal weights) as the loss metric (Figure 2). Separate models were trained to segment the vertebrae and IVDs. The trained networks were then used to segment the vertebrae and IVDs from the rest of the MR images.
2.4 Feature extraction
The obtained segmentation masks were split to four regions-of-interest (ROI): vertebrae L1, L2, and L3; vertebrae L4 and L5; IVDs L1-L2, L2-L3, and L3-L4; and IVDs L4-L5 and L5-S1. A custom-made MATLAB (v.9.7, The MathWorks Inc., Natick, MA, 2019) program was used to extract textural features (N = 603) from the ROIs. These features consisted of histogram features, gradient features, Haralick features from the grayscale co-occurrence matrix, run-length encoding features, wavelet features, and local binary patterns.44-46 Images were standardized (to zero mean and unit variance) before feature extraction. In addition to the textural features described above, Modic grading was added to the vertebral features and Pfirrman grading was added to the IVD features. A more detailed description of the features can be found in Table 2.
| Texture type | Feature names | Notes |
|---|---|---|
| Grayscale histogram | Maximum value, minimum value, mean, variance, skewness, kurtosis, percentiles (1, 10, 25, 50, 90, and 99) | N = 12 |
| Gray-level co-occurrence matrix | Angular second moment, contrast, correlation, sum of squares variance, inverse difference moment, sum average, sum entropy, sum variance, entropy, difference variance, difference entropy, information measures of correlation, maximal correlation coefficient | Directions: 0°, 45°, 90°, and 135°; radii: 1–5 pixels; discretization: 8-bit; N = 280 |
| Run-length matrix | Long and short run emphasis, run-length and grayscale nonuniformity, run percentage | Directions: 0°, 45°, 90°, and 135°; max run-length: 8; discretization: 8-bit; N = 20 |
| Absolute gradient | Non-zero values, mean, variance, skewness, kurtosis | N = 5 |
| Gradient angle | Mean, variance, skewness, kurtosis | N = 4 |
| Autoregressive model | phi1-4, sigma | N = 5 |
| Wavelet transform | Energy in low-frequency and high-frequency (horizontal, vertical, and diagonal) sub-bands | 5 decomposition levels; N = 20 |
| Local binary patterns | Local binary patterns histogram, mean | Radius: 1 pixel; N = 257 |
| Other | ||
| Imaging phenotypes | Modic changes for individual vertebrae, Pfirrman grading for individual intervertebral discs, mean and maximum Modic and Pfirrmann grades in the ROI | Graded by two independent physicians. N = 4-5 |
| Demographic variables | Gender, weight, height, BMI | N = 4 |
- Note: The N in the right-hand column refers to the number of individual extracted features from each feature type.
- Abbreviations: BMI, body mass index; ROI, region-of-interest.
2.5 Classification
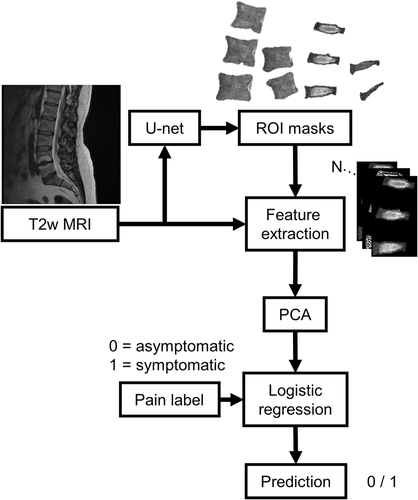
Sklearn (v. 0.21.2) machine learning library was used in Python (v. 3.7.3) to build a machine learning pipeline to analyze the feature data (Figure 3). Data were split into training (80%) and test (20%) sets with equal class distributions (Table 1). Data were standardized and shuffled before analyses. Principal component analysis (PCA) was used for dimensionality reduction using 80% as the variance threshold. A logistic regression classifier was then implemented to predict the presence of LBP in the subjects. A five-fold cross-validation scheme was used in conjunction with a grid search to tune the amount of L2 regularization in the classifier. The best-performing parameters on the training set were then used in the final classification task. The analysis was done separately for different ROIs. All fitting procedures were done on the training data.
For the quantification of classification results, specificity, sensitivity, negative predictive value (NPV), precision, and accuracy scores were computed. In addition, receiver operating characteristic (ROC) curves were visualized and the areas-under-curve (ROC-AUC) were determined. Furthermore, to compare our results with basic grading-based classification, we performed similar logistic regression analysis to Modic and Pfirrmann grade data.
2.6 Sensitivity analysis for nonspecific LBP
To investigate sensitivity for nonspecific LBP, the classification pipeline was run in two different scenarios as follows: (1) discarding cases with sciatica symptoms from the symptomatic group. This was done by asking “Have you had aches in your lower back that are associated with radiating pain or numbness below the knee”. In addition, protrusions and extrusions were evaluated from the MRI data of the symptomatic group. If a subject had both radiating pain below the knee and a protrusion or extrusion, they were removed from this analysis (referred to as NS1). This group of nonspecific symptomatic subjects included 69 cases (14.5%). (2) Additionally, cases exhibiting Modic 1 or 2 changes (MC) exceeding 25% of the height of the adjacent vertebrae were discarded as the larger MC were more strongly related to clinically relevant LBP in our previous study.47 This other group of nonspecific symptomatic subjects (referred to as NS2) included 54 cases (11.7%).
3 RESULTS
3.1 Data preprocessing
An example output from the segmentation network is shown in Figure 2. PCA yielded 44 and 55 principal components for the upper and lower vertebral ROIs, and 53 and 56 principal components for the upper and lower IVD ROIs, respectively. Several gray-level co-occurrence matrix and run-length encoding matrix features were frequently ranked high in the first principal components (Table 3).
| Vertebrae | Explained variance | Feature names of top five features contributing to PC | |
|---|---|---|---|
| Upper | PC1 | 28.2% | Difference entropy [(−3, −3); (-3, 3)]; difference variance [(−3, −3); (−4, −4)]; difference entropy (−2, −2) |
| PC2 | 12.3% | Information measure of correlation [(−3, −3); (−4, −4); (−3, 3); (−4, 4); (0, 5)] | |
| PC3 | 11.2% | Grayscale nonuniformity (90°, 0°, 135°, 45°); LBP histogram bin 255 | |
| Lower | PC1 | 29.0% | Sum entropy [(−1, 0); (0, 1); (−1, 1); (−1, −1); (0, 2)] |
| PC2 | 12.4% | Information measure of correlation [(−2, 0); (−2, −2); (−3, 0); (−2, 2); (−1, −1)] | |
| PC3 | 8.5% | LBP histogram bin 255; grayscale nonuniformity (90°, 0°); non-zero gradient values; run-length nonuniformity (135°) |
| IVDs | |||
|---|---|---|---|
| Upper | PC1 | 29.8% | Sum entropy [(−2, −2); (−3, −3); (−2, 2); (−2, 0); (−3,0)] |
| PC2 | 12.4% | Non-zero gradient values; LBP histogram bin 112; information measure of correlation (−1, 0); LBP histogram bin 143; wavelet energy (decomposition level 4) | |
| PC3 | 9.8% | Run-length nonuniformity (0°); run percentage (0°), information measure of correlation [(0, 1); (0, 2)]; inverse difference moment (0, 1) | |
| Lower | PC1 | 32.1% | Sum entropy [(0, 5); (−2, 2); (−3, 3); (−3, 0); (−4, 4)] |
| PC2 | 13.7% | Information measure of correlation [(−1, 0); (−2, 0); (−1, 1); (−2, −2); (−3, 0)] | |
| PC3 | 6.3% | Grayscale nonuniformity (0°, 45°, 90°, 135°); LBP histogram bin 255 |
3.2 Classification
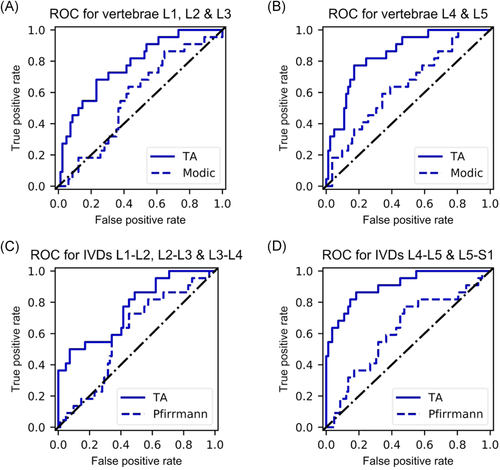
Using demographic variables with Modic and Pfirrmann grades in the logistic regression analysis resulted in poor classifier performance, and when textural features were added to the analysis, classification results improved greatly (Table 4, Figure 4). When comparing the classification performance between different ROIs, the best results in the test set were obtained with the ROI with the two lowest IVDs with 83% accuracy, 83% specificity, 82% sensitivity, 94% NPV, and 56% precision (Table 4). Classification with the three uppermost vertebrae yielded a ROC-AUC of 0.78 (Figure 4A), and the two lowest yielded a ROC-AUC of 0.84 (Figure 4B). The ROC-AUC scores for upper (Figure 4C) and lower (Figure 4D) IVDs were 0.76 and 0.91, respectively.
| Grading based classification | ||||
|---|---|---|---|---|
| Modic changes | Pfirrmann grading | |||
| ROI | L1-L2, L2-L3, and L3-L4 | L4-L5 and L5-S1 | L1-L2, L2-L3, and L3-L4 | L4-L5 and L5-S1 |
| Specificity | 0.62 | 0.61 | 0.56 | 0.55 |
| Sensitivity | 0.54 | 0.59 | 0.64 | 0.64 |
| NPV | 0.84 | 0.85 | 0.85 | 0.85 |
| Precision | 0.28 | 0.29 | 0.28 | 0.27 |
| Accuracy | 0.60 | 0.61 | 0.58 | 0.57 |
| ROC-AUC | 0.57 | 0.64 | 0.60 | 0.62 |
| Texture analysis based classification | ||||
|---|---|---|---|---|
| Lumbar vertebrae | Lumbar intervertebral discs | |||
| ROI | L1, L2, and L3 | L4 and L5 | L1-L2, L2-L3, and L3-L4 | L4-L5 and L5-S1 |
| Specificity | 0.84 | 0.77 | 0.79 | 0.83 |
| Sensitivity | 0.55 | 0.77 | 0.55 | 0.82 |
| NPV | 0.87 | 0.93 | 0.87 | 0.94 |
| Precision | 0.48 | 0.47 | 0.41 | 0.56 |
| Accuracy | 0.78 | 0.77 | 0.74 | 0.83 |
| ROC-AUC | 0.78 | 0.84 | 0.76 | 0.91 |
- Note: Scoring metrics for classification quality for the different anatomical ROI with test data are reported. Bolded values highlight the best values across the ROIs. All fitting operations were done on training data.
- Abbreviations: NPV, negative predictive value; ROC-AUC, receiver operating characteristics area-under-curve; ROI, region-of-interest.
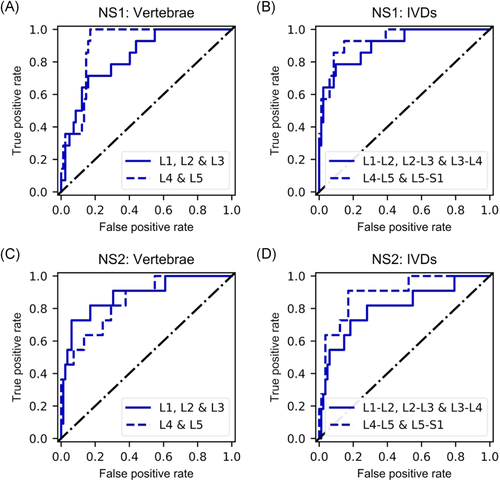
In the sensitivity analysis for nonspecific LBP, in the NS1 group (subjects with sciatica symptoms discarded) all the classification metrics for the lowest two discs improved slightly (0.94 ROC-AUC, 93% specificity, 95% NPV, and 63% precision) apart from sensitivity (71%; Table 5, Figure 5B). The other ROIs exhibited similar improvements (Table 5, Figure 5A-B). In the NS2 group, classification accuracy and ROC-AUC were slightly lower for the lowest discs and slightly higher for the other ROIs (Table 5, Figure 5C, D).
| Discarding sciatica symptoms (NS1) | ||||
|---|---|---|---|---|
| Lumbar vertebrae | Lumbar intervertebral discs | |||
| ROI | L1, L2, and L3 | L1, L2, and L3 | L1-L2, L2-L3, and L3-L4 | L4-L5 and L5-S1 |
| Specificity | 0.88 | 0.87 | 0.77 | 0.93 |
| Sensitivity | 0.64 | 0.50 | 0.79 | 0.71 |
| NPV | 0.94 | 0.91 | 0.95 | 0.95 |
| Precision | 0.47 | 0.39 | 0.37 | 0.63 |
| Accuracy | 0.84 | 0.81 | 0.77 | 0.90 |
| ROC-AUC | 0.83 | 0.90 | 0.91 | 0.94 |
| Additionally discarding large MC1/2 (NS2) | ||||
|---|---|---|---|---|
| Lumbar vertebrae | Lumbar intervertebral discs | |||
| ROI | L1, L2, and L3 | L4 and L5 | L1-L2, L2-L3, and L3-L4 | L4-L5 and L5-S1 |
| Specificity | 0.85 | 0.93 | 0.93 | 0.83 |
| Sensitivity | 0.73 | 0.45 | 0.55 | 0.82 |
| NPV | 0.96 | 0.93 | 0.94 | 0.97 |
| Precision | 0.40 | 0.45 | 0.50 | 0.40 |
| Accuracy | 0.84 | 0.87 | 0.88 | 0.83 |
| ROC-AUC | 0.88 | 0.85 | 0.80 | 0.90 |
- Note: NS1 refers to the case where cases with notable protrusions/extrusions and sciatica symptoms were discarded, and NS2 refers to the case where additionally Modic 1/2 changes (MC1/2) exceeding 25% of adjacent vertebrae height were discarded. Scoring metrics for classification quality for the different anatomical regions-of-interest (ROI) are reported. Bolded values highlight the best values across the ROIs. All fitting operations were done on training data.
- Abbreviations: NPV, negative predictive value; ROC-AUC, receiver operating characteristics area-under-curve.
4 DISCUSSION
In this study, the texture of T2-weighted MR images was analyzed and machine learning methodology (logistic regression) was used to classify textural features by a binarized pain variable based on a questionnaire. A subsample of N = 518 subjects from the NFBC1966 data was used in this population-based study. Various classification metrics were computed along with ROC analysis to assess the quality of the classifier.
Best classification accuracy (83%) and ROC-AUC (0.91) in the test set were achieved using the two lowest IVDs (Table 4, Figure 4). The specificity score of 83% suggests that true negatives were relatively well-identified. The sensitivity score of 82% in turn suggests that also true positives were identified by the classification algorithm. NPV refers to the proportion of true negatives in all negative results, and a score of 94% means there were only a few false negatives. Out of all the classification scores, precision was the lowest (56%), suggesting that the classification was not very robust to false positives. False positives were likely represented because up to 87% of asymptomatic subjects are known to display signs of IVD degeneration.12 However, because asymptomatic subjects account for the majority of the population (79% in our study), classification based on degenerative tissue changes instead of texture analysis would be expected to result in worse precision score than what our model exhibited. Indeed, the comparative grading-based classification using only Modic and Pfirrman grades yielded inaccurate classification (Table 4, Figure 4) when compared to TA-based classification. Furthermore, LBP is a very complex phenomenon and cannot be attributed to one factor, such as imaging findings, solely.1 Pain is a highly subjective variable and although the used classification division had strict rules (frequency ≥ 30 days and intensity ≥6/10 in the symptomatic group, and frequency ≤7 days and intensity ≤3/10 in the asymptomatic group), it is possible that subjects with mild symptoms were present in both groups, thus affecting the results with regard to precision. Results do, however, suggest a proportionally lower number of false negatives, which is desirable in medical studies.
Rest of the ROIs exhibited similar phenomenon albeit the scores were lower. Interestingly, the texture features of IVDs in the upper lumbar levels could not classify as well as the texture features obtained from the two lowest IVDs or the vertebral ROIs. Classification results between the two vertebral ROIs were similar, with the lower vertebrae showing higher scores in terms of sensitivity, NPV, and ROC-AUC and the upper vertebrae outperforming in terms of specificity, precision, and accuracy.
Our results suggest that texture in IVDs L4-L5 and L5-S1 in T2-weighted MRI play a role in the manifestation of LBP in the data we used. This is also supported by a recent genetic study that showed a strong significant genetic correlation between IVD problems and back pain.48 Furthermore, two phenotypes of disc degeneration in the upper and lower lumbar levels have been identified, originating from different injuries to the annulus and endplate.49, 50 While our study does not address the origin of these phenotypes, it shows that T2-weighted MRI texture in the lower lumbar levels is more predictive of LBP. Texture features contributing to classification success were more prevalent in the lower discs, which could be indicative of such a distinction of two different IVD phenotypes existing.
Interestingly, our results improved slightly in the NS1 group of sensitivity analysis for nonspecific LBP. In this analysis, subjects with sciatica symptoms were removed from the symptomatic group. The observed improvement could be because protrusions and extrusions are not always causing pain symptoms, and thus they exist in the asymptomatic group as well. In the NS2 group, large Modic 1 and 2 changes were discarded as well. Compared to the original division, this resulted in slightly worse performance for the IVDs, especially in terms of precision, but improved the results for vertebrae. Modic changes are closely related to vertebral signal intensity and discarding the extreme cases seems to result in improvement of texture-based classification of the vertebrae. It should be noted that in both of these cases the initially small group of symptomatic patients became roughly halved. Therefore, the proportion of positives in the group is considerably smaller. However, we believe this analysis gives more insight into how the presented methodology would work on nonspecific cases, and will certainly delve into this further in future studies.
Principal component analysis performs a change of basis on feature data, computing linear combinations of the original features as new features along which the variance is maximized. As most of the variance in the data is explained by the first principal components, we studied the three first principal components in the different classification studies we performed (Table 3). Entropy features from the gray-scale co-occurrence matrix and nonuniformity features from the run-length matrix were present in these principal components in all studies, and information measures of correlation were present in these principal components in all but one study. As similar features were among the highest-contributing features to principal components, those features may have higher predictive power than others. A more thorough investigation comparing classification outcomes using different feature types would be welcome in the future as it could reveal fundamental connections between MRI texture and symptoms.
Our study includes several limitations. We defined a binary pain outcome and a conservative definition of asymptomatic subjects, excluding those with mild symptoms. All subjects were of similar age (46–48 years old) due to the nature of the study population (birth cohort). Because of these statistical concerns, the data we analyzed represents a subset of a population and thus should not be considered as representative of the population at large. Our study concerns only vertebral bodies and IVDs seen from two-dimensional images of the mid-sagittal plane of imaging. In this plane, for example, posterolateral fissures in the disc annulus or pathologies in the facet joints cannot be seen. Including more slices, imaging planes, or data from an isotropic three-dimensional imaging sequence, although computationally far more challenging, would allow for larger regions and more anatomy and tissues to be analyzed. Furthermore, we analyzed IVDs as whole, while further segmentation to the high-intensity nucleus pulposus and low-intensity annulus fibrosus would allow for comparison within the IVD.
While our results show promise in using texture analysis and machine learning in predicting pain from T2-weighted images, further investigations are required. In future, we aim to apply deep learning approaches for pain classification from MRI. Deep convolutional neural networks would allow for, for example, localization of “hot-spots” or attention maps pinpointing the regions contributing to the classification outcome.51, 52 By doing this, each lumbar level could be analyzed without specific ROI delineation for each tissue type, and textures within the IVD or at the vertebral endplate could be analyzed. In addition, using more MRI contrasts, such as T1 or short-TI inversion recovery (fat suppression), and incorporating 3D data containing more anatomy, is planned. Additional clinical imaging features and specific lesions (such as annulus fissures, high-intensity zones, and endplate defects) will be analyzed in the future as well. Furthermore, while this study suggests that MRI can reveal quantitative image features indicative of the presence of LBP, it does not address which biological processes are behind the alterations to these features. This warrants further investigation in the future, at least for different phenotypes of Modic 1 changes, as it seems that size47 and location53 of Modic 1 changes may be related to LBP. Regardless, to our best knowledge, this is the first work applying texture analysis and machine learning in an attempt to predict the presence of LBP from MRI.
To conclude, texture analysis of lumbar MRI data shows promise as a diagnostic tool in the assessment of LBP. This methodology could be used, for example, to identify which tissues and anatomical regions account for the presence of LBP, or to process clearly negative cases to lighten the diagnostic workflow of medical professionals in routine imaging tasks.
ACKNOWLEDGEMENTS
We gratefully acknowledge support from the Technology Industries of Finland Centennial Foundation and Jane & Aatos Erkko Foundation funds (the Future Makers –program), as well as personal grants from the Tauno Tönning Foundation. We thank Dr. Juhani Määttä for assistance in processing the clinical MRI data.
CONFLICT OF INTERESTS
The authors declare that there are no conflict of interests.
AUTHOR CONTRIBUTIONS
J.H.J.K. performed programming, analyzed the data, interpreted the results, wrote the manuscript. S.I.I. designed the study, analyzed the data, interpreted the results, and edited the manuscript. J.K. acquired the data, designed the study, interpreted the results, supervised and edited the manuscript. J.N. and O.T. acquired the data and edited the manuscript. M.T.N. designed the study and supervised and edited the manuscript. All authors have read and approved the final submitted manuscript.


