Measuring 3D growth plate shape: Methodology and application to cam morphology
Abstract
Physeal changes corresponding to cam morphology are currently measured using two-dimensional (2D) methods. These methods are limited by definitions of the femoral neck axis and head center that are dependent on the radiographic plane of view. To address these limitations, we developed three-dimensional (3D) methods for analyzing continuous growth plate shape using magnetic resonance imaging scans. These new methods rely on a single definition of the femoral neck axis and head center that are both nondependent on the radiographic plane of view and allow for analysis of growth plate shape across the growth plate surface (performed using statistical parametric mapping). Using our 3D method, we analyzed the position of the growth plate in the femoral head (relative to a plane tangent to the femoral head) and the curvature of the growth plate (relative to a plane through the center of the growth plate) in 9–16-year-old males at risk for cam morphology and their recreationally active peers (n = 17/cohort). These two measurements provide an avenue to separately analyze the effects of these variables in the overall growth plate shape. We detected differences in growth plate shape with age in recreationally active adolescents but did not detect differences between at risk and recreationally adolescents.
1 INTRODUCTION
Cam morphology is characterized by additional bony formation on the anterosuperior portion of the femoral head and femoral head-neck junction. Radiographic evidence of cam is determined with various bony measures including the α-angle (quantification of femoral head asphericity1) and head-neck offset (quantification of the difference between the femoral head and femoral neck radii1, 2). These bony indicators are measured using a variety of imaging perspectives including single planar radiographs, such as anterior-posterior, frog-leg, and cross-table, and volumetric techniques, such as magnetic resonance (MR) and computed tomography (CT) imaging.
Complications of cam morphology include premature damage to the acetabular labrum and articular cartilage within the hip joint,3 labral tears,4 and early-onset osteoarthritis.5 Before skeletal maturity, longitudinal growth continues after the initial onset of cam development.6 After skeletal maturity, there is no correlation between increasing chronological age and increasing severity of cam.7 Additionally, the morphology does not return postoperatively in adults who undergo surgical removal of the cam.8 Combined, these findings suggest that the period for cam development is limited to skeletal development. However, the mechanism responsible for cam formation remains unknown.
Mechanical factors influence bone development9 and it has been suggested that longitudinal growth happens in the same direction as the largest applied force,10 in the average direction of deformation,11, 12 and in the principle stress direction.13 Computational models have suggested that mechano-regulated physeal growth influences whole bone femoral geometry such as the bicondylar angle of the distal femur,14 anteversion,11-13 and neck-shaft angle.11-13 Because of its increased prevalence in elite-level soccer,15-20 ice hockey,7, 21, 22 and basketball8, 23 players, cam development is likely linked to the mechanical stimuli associated with participation in these “at risk” sports during adolescence.8, 15-17, 19, 23-26 A mechanoadaptive response during growth could cause changes in physeal shape and orientation that precede the onset of bony indicators.
To date, proximal femoral physeal morphology has only been quantified in two-dimensions (2D). Current measures depend on the definition of a 2D neck axis that is defined by the line connecting the center of the femoral head and the center of the narrowest portion of the femoral neck in a selected plane.1 Physeal morphology is most commonly quantified by epiphyseal extension,24 the ratio of epiphyseal extension on opposing sides of the femoral head,15 epiphyseal angle,27 and/or epiphyseal tilt27 (Figure 1). Epiphyseal extension is defined by the distal extension of the growth plate measured parallel to the femoral neck axis and normalized to the femoral head diameter. Epiphyseal tilt is defined by the angle between a line connecting opposing sides of the growth plate and a line perpendicular to the neck axis/tangent to the femoral head. Epiphyseal angle is the angle between the femoral neck axis and a line connecting the lateral most extension of the epiphyses with the femoral head center. These measures are often reported at distinct “clockface positions” which are defined from the medial side of the femoral head, where 3 o'clock is directed anteriorly and 9 o'clock is directed posteriorly for both the right and left femur. In studies focusing on cam, these measures are typically reported in radial planes containing the anterosuperior quadrant (12–3 o'clock positions) and the posterosuperior quadrant (10–11 o'clock positions) of the femoral head.8, 15 Increased epiphyseal extension has been observed before the development of cam and is recognized as a contributor to osseous changes at the head-neck junction.8, 23, 24

While simple to implement, 2D measures of physeal morphology may not inform a complete understanding of growth plate shape. The current method is repeated in various planes, requiring a redefinition of the femoral neck axis and head center in each plane. Forcing the neck axis to pass through the center of the femoral head can lead to inaccurate measures in 2D due to an ill-defined neck axis.28 If the outermost proximal surface of the femoral head does not coincide with the femoral neck axis, the location along the neck axis of the tangent reference line used to measure epiphyseal extension down the neck will also be inconsistent in the various planes. Therefore, current epiphyseal measures are not found relative to a “true” three-dimensional (3D) femoral neck axis and a single plane tangent to the outer surface of the femoral head, but rather to a repeatedly redefined 2D neck axis and tangent line reference (Figure S1 demonstrates the significance of these assumptions).
Because longitudinal bone growth occurs perpendicular to the growth plate surface, quantifying 3D growth plate shape can provide crucial insight into the direction of future longitudinal growth and the postpubertal morphology after growth plate closure. Assessing 3D growth plate shape changes in the proximal femur that occur prior to bony ones can help us better understand why and where cam morphology develops. Therefore, the objectives of this study were to develop a method for measuring 3D growth plate shape and to use the developed method to analyze growth plate shape of adolescent elite-level soccer players at risk for cam morphology and their recreationally active peers.
2 METHODS
2.1 Data set
The Nuffield Department of Orthopaedics, Rheumatology and Musculoskeletal Sciences at Oxford University recruited 9–18 year old soccer players from the Southampton Football Club Academy and age-matched controls from local schools. Previous hip surgery was the only exclusion criteria for this study. MRI scans of participants were acquired with a 3-Tesla Philips Achieva platform and torso coil (Philips Healthcare). The protocol used a 3D water selective fluid (WATsf; images the joint cartilage and bone) and a 3D proton density fat saturation (PDFS; images the physeal scar) (refer to Palmer et al.15 for full details). Palmer et al.14 used this MRI data set of 210 participants to assess the impact of physical activity level during adolescence on hip growth. The study received ethics approval from the Oxford University Medical Sciences Interdivisional Research Ethics Committee and participant consent was obtained before study procedures.
A data-sharing agreement was setup between Oxford and Northeastern Universities for a retrospective analysis of a random subset of 34 male prepubescent participants (9–16 years old). With the exception of one 16-year-old participant with a partially closed growth plate, all participants in the random subset had open growth plates at the time of image acquisition. The 34 participants were divided into four distinct cohorts based on age (9–11 years old vs. 12–16 years old) and activity level (at risk athletic vs. recreationally active) (Table 1).
| Cohort | # of Hips | Age (yrs) | Height (m) | Weight (kg) | BMI |
|---|---|---|---|---|---|
| At risk athletic 9–11 y.o. | 11 | 10.36 ± 0.81 | 1.45 ± 0.075 | 36.34 ± 6.82 | 17.18 ± 2.02 |
| At risk athletic 12–16 y.o. | 6 | 13.17 ± 1.47 | 1.60 ± 0.090 | 49.27 ± 10.86 | 19.97 ± 2.15 |
| Recreationally active 9–11 y.o. | 6 | 9.50 ± 0.55 | 1.42 ± 0.041 | 37.65 ± 7.40 | 18.56 ± 3.23 |
| Recreationally active 12–16 y.o. | 11 | 13.36 ± 1.36 | 1.63 ± 0.11 | 52.45 ± 15.36 | 19.33 ± 3.44 |
- Abbreviations: BMI, body mass index; SD, standard deviation.
2.2 Image segmentation
Each participant's right femur and growth plate were segmented using MIMICS Research Software (v21.0; Materialise NV). 3D masks of the femur and growth plate were smoothed (MIMICS Software smoothing parameters: 10 iterations, 0.4 factor) and exported to smoother surface models (STL files). STL files were imported into MATLAB (R2019b; Mathworks Inc.) and all subsequent analyses were completed using custom-written code.
2.3 3D neck axis
The proximal region of the femoral head was isolated from the distal portion of the femoral head and femur using a plane defined by three visually informed user-selected points chosen to not include any evident cam morphology (Figure 2A). A sphere was fit to the isolated proximal femoral head region. While our methods for defining the femoral head center do not require isolation of the entire femoral head, other studies have successfully isolated the entire femoral head from the femur by using principle curvature measures to define the plane of the head-neck junction.29-31

To reduce the dependence on the user-selected points, the femoral head sphere fit (including the fovea) was defined by the average of three trials. The femoral head center and radius were defined by the center and radius of the averaged sphere, respectively (Figure 2B). We assessed the effect of including versus excluding the fovea in these methods in all 34 participants. To exclude the fovea, we excluded points that were distanced by <97.5% of the original femoral head radius from the original center of the femoral head. We found that the mean absolute difference between radii measured including versus excluding the fovea was 0.15 ± 0.09 mm. A two-tailed paired t test revealed that these differences were insignificant (p < 0.05). Three researchers tested interrater reliability of femoral head radii measures (two-way random, single measures, absolute agreement). Analysis on 12 adolescents (n = 3/cohort) demonstrated a high agreement (ICC = 0.9697).
The femoral neck region was isolated by defining two planes: one at the proximal end of the femoral neck (defined by three user-selected points) and a second parallel to the first plane and containing a user-selected point on the superior surface of the distal femoral neck (Figure 2C). Spheres were fit inside the isolated portion of the femoral neck (Figure 2D). The 3D neck axis was defined by the line of best fit through the sphere centers and was not forced to pass through the center of the femoral head (Figure 2E). Three researchers tested the reliability of the femoral neck axis. The angular difference between the femoral neck axes was found for 12 adolescents. The mean angular differences were <3° (mean ± SD: users 1&2: 2.64° ± 2.28°; users 2&3: 1.83° ± 1.50°, users 1&3: 2.91° ± 2.60°), suggesting that the semi-automated method is not sensitive to the choice of informed user-selected points.
2.4 Femur registration
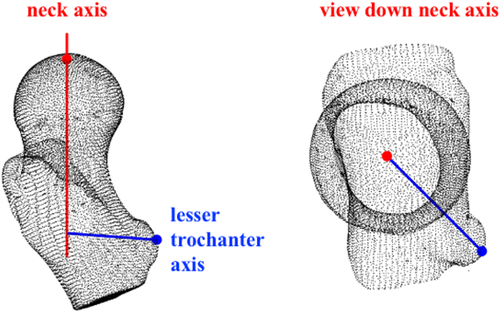
A lesser trochanter axis was defined as normal to the femoral neck axis and containing the mathematically determined point of the lesser trochanter at the greatest distance from the neck axis (Figure 3). All femurs and growth plates were aligned to the same orientation using the same order of rotation: alignment of the neck axes followed by a rotation about the neck axis to align the lesser trochanter axes.
2.5 3D growth plate shape
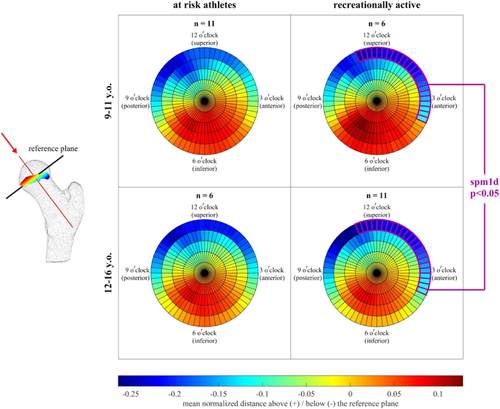
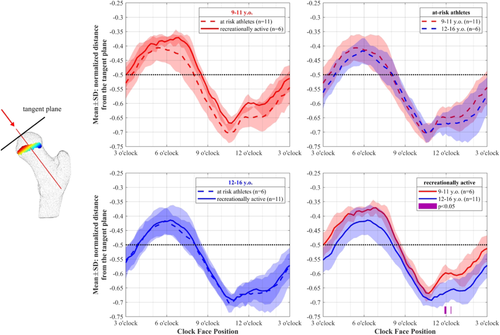
A tangent plane was defined perpendicular to the 3D neck axis and tangent to the outer surface of the femoral head. The growth plate distance below the tangent plane was calculated across the growth plate surface to measure 3D growth plate shape. Because our participants ranged in age from 9 to 16 years old and the growth plate location in the femoral head changes with age, we also measured the shape of the growth plate relative to the center of the growth plate. A reference plane was created parallel to the tangent plane at the growth plate center (Figure 4A). Distances to the growth plate surface relative to this reference plane were calculated across the growth plate surface (Figure 4B). Measuring the distance relative to this reference plane removes the influence of growth plate location in the femoral head. While the distance from the tangent plane indicates the position of the growth plate in the femoral head, distance from the reference plane indicates relative curvature of the growth plate.
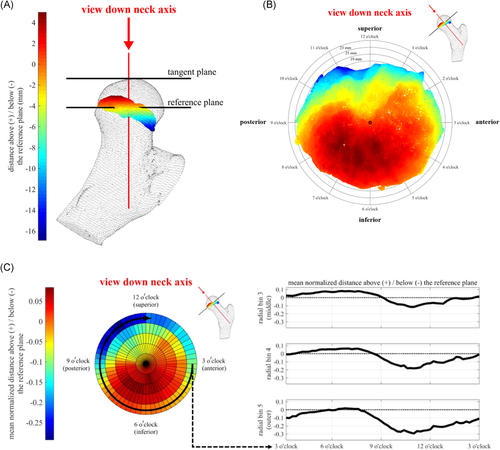
Distances from each plane (tangent and reference) were normalized to the diameter of the femoral head and were divided into 60 circumferential bins centered around the femoral neck axis. Within each circumferential bin, data were subsequently divided into five equally spaced radial bins, spanning from the neck axis to the outer edge of the growth plate within the circumferential bin. This choice was made to account for the growth plates not being perfectly circular in shape, thereby allowing the distance from the neck axis to the growth plate's outer edge to be normalized along the outer edge of the entire growth plate for comparison between participants. The mean normalized distances were calculated in each bin to allow regional differences in growth plate shape to be compared statistically. Data were also plotted as a function of circumferential position on a two-axis plot as an alternative way to visualize the mean normalized growth plate distance from the plane (Figure 4C).
2.6 Statistical analysis
Normalized growth plate distance data (from the reference or tangent plane) are an example of continuous anatomical data, meaning that data within a localized spatial region of the growth plate are not independent from data in neighboring spatial regions. To allow comparison of continuous data, we compared distances in the radial bins between groups using one-dimensional statistical parametric mapping (spm1d).32 Statistical parametric mapping uses random field theory to conduct statistical tests on data over a continuous domain and corrects for the multiple comparison problem introduced by neighboring data that are not independent.33 Data were considered as circular fields (i.e., the first and last circumferential bins in the field are adjacent in position) to account for the continuous adjacency of circumferential bins within the radial bin. Here, we show the analysis of the outer radial bin because changes in growth plate shape within this region have been implicated in cam development and this region has the greatest implication for osseous changes at the femoral head-neck junction.
Two-tailed two-sample unpaired t tests were used to test the null hypothesis that the normalized growth plate distance data of groups were equal. Hypotheses were rejected at the 0.05 significance level. We report the regions and corresponding p-values where the null-hypothesis is rejected, indicating the groups are different.
3 RESULTS
3.1 3D methods
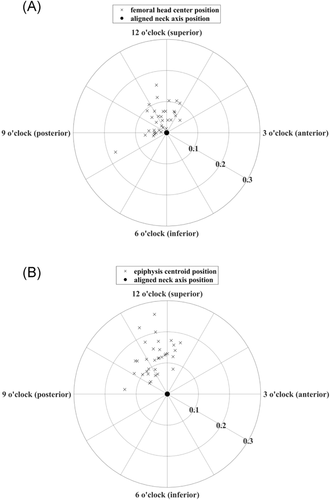
The methods presented in this study can be used to determine a 3D neck axis that is not forced to pass through the center of the femoral head. We found that the femoral head center did not coincide with the femoral neck axis. The positions of the femoral head centers, projected onto a plane perpendicular to the neck axis, were located between the 8 o'clock (posteroinferior) and 2 o'clock (anterosuperior) positions, measured clockwise (Figure 5A). The femoral head radii and the positions of the femoral head center in relation to the neck axis were variable (Table 2).
| Mean ± SD | Range (min, max) | ||
|---|---|---|---|
| Femoral head radius | (mm) | 20.55 ± 2.03 | 16.22, 25.20 |
| Radial distance between femoral head center and neck axis | (mm) | 1.35 ± 0.81 | 0.28, 3.97 |
| (normalized) | 0.066 ± 0.038 | 0.013, 0.18 | |
| Radial distance between epiphysis centroid and neck axis | (mm) | 2.69 ± 0.93 | 1.40, 5.62 |
| (normalized) | 0.13 ± 0.045 | 0.066, 0.26 |
- Note: Values are reported in raw millimeters (mm) and normalized to the radius of the femoral head.
Our methods can also be used to describe other characteristics of the proximal femur, such as the position of the centroid of the epiphysis in relation to the neck axis. We found that the epiphysis centroids were all located between the 9 o'clock (posterior) and 1 o'clock (anterosuperior) positions, measured clockwise (Figure 5B, Table 2).
By using 3D methods, the entire proximal femoral morphology was accounted for in these anatomical measures (femoral head radii and locations of femoral head center/epiphysis centroid relative to the neck axis). Quantifying these anatomical characteristics with reliable 3D methods may prove useful in a clinical context for understanding the etiology and progression of cam morphology.
3.2 Growth plate shape analysis
The shape of the growth plate changed with age in the recreationally active cohort. In this group, the normalized distance from the reference plane increased with age in the anterosuperior region of the outer radial bin (radial bin 5), extending to the 11 o'clock and 4 o'clock positions (Figures 6, 7). The normalized distance from the reference plane is similar to epiphyseal extension, except for that distances are measured relative to a plane passing through the growth plate's center, not a plane tangent to the surface of the femoral head. Our results, therefore, indicated that the growth plate's curvature relative to its own center increased with age. Similarly, the normalized distance from the tangent plane increased with age in the recreationally active cohort, but only in a localized region within ~15° of the 12 o'clock position in the outer radial bin (Figure 8). This normalized distance from the tangent plane is analogous to a continuous measure of epiphyseal extension across the growth plate's surface. Here, we show the results for the outer radial bin (i.e., around the growth plate's outer edge). Interestingly, there were no significant differences with age in the at risk cohort. Within age groups, we found no difference in the growth plate distances to the reference plane between at risk and recreationally active cohorts. There were no significant differences in normalized distance from the tangent plane with age in the at risk cohort or in the comparisons between at risk and recreationally active groups in each age group.

4 DISCUSSION
In younger cohorts who subsequently develop cam morphology, osseous changes are not observed until after initial physeal changes.15, 34, 35 Because cam morphology forms prior to growth plate closure,17, 26 recognizing initial growth plate changes is critical for understanding its etiology and developing interventions. Although epiphyseal extension is a well-recognized precursor to cam development,8, 24 it is likely not the only contributing factor.15 Current 2D epiphyseal measures are also limited in that they only capture the behavior of the growth plate's outer edge at discrete intervals.
This study introduced a new methodology for measuring 3D growth plate shape across the entire growth plate surface. We defined a 3D neck axis that was not forced to pass through the center of the femoral head. Additionally, we defined a single tangent plane perpendicular to the neck axis that coincided with the outer surface of the femoral head, eliminating the effects of having different definitions of this reference for epiphyseal extension measures in multiple radial planes. We also measured growth plate shape relative to a reference plane defined perpendicular to the neck axis and passing through the growth plate center. Doing so allowed a single neck axis definition and reference plane definition for all epiphyseal measurements, eliminating the need to repeat these definitions in multiple planes. Redefining the neck axis and femoral head center in multiple radial planes has an impact on both bony and physeal measures. Femoral neckaxes and head centers that are defined by 2D methods do not align with one another in 3D space (Figure S1). Our developed 3D method allows use of a single, consistent femoral neck axis and head center definition for bony and epiphyseal measures in all radial planes. Additionally, by measuring the growth plate distance relative to a reference plane passing through the growth plate center instead of relative to a plane tangent to femoral head, our measures capture a sense of growth plate curvature (i.e., the distance the growth plate extends down the neck relative to its own center).
It has been shown that epiphyseal extension is greater in at risk athletes than in age-matched controls, both before and after growth plate closure, and that epiphyseal extension increases with age.8, 15 Our results indicate that the normalized growth plate distance below the reference plane increased with age in the outer radial bin. This increase was significant within the recreationally active cohort between ~11 o'clock and ~4 o'clock circumferential positions (measured clockwise). However, we did not find differences in physeal measures between at risk and recreationally active cohorts. This discrepancy with previous studies could be because of our relatively small sample size. The parent study from which these data came found a significant (p = 0.043) increase in epiphyseal extension in athletes with over 200 participants.15 The subset of participants evaluated in this study (n = 34) had a relatively high presence of cam in both the at risk and recreationally active cohorts. Though other studies have indicated morphological differences between at risk athletes and recreationally active peers, a two-tailed, two-sample t test comparison of the 34 participants included in this study indicated no significant differences in 2D alpha angles (Table 3) or epiphyseal extension measures (Table 4).
| Cohort | # of Hips | α-angle (degrees) | ||||
|---|---|---|---|---|---|---|
| Clockface position | ||||||
| 11 o'clock | 12 o'clock | 1 o'clock | 2 o'clock | 3 o'clock | ||
| At risk athletic | 17 | 45.43 ± 3.71 | 46.77 ± 7.78 | 52.30 ± 13.41 | 58.31 ± 11.27 | 58.50 ± 12.62 |
| Recreationally active | 17 | 45.12 ± 3.81 | 47.05 ± 5.78 | 51.04 ± 9.84 | 56.70 ± 6.70 | 57.08 ± 12.82 |
| p value | p = 0.8121 | p = 0.9054 | p = 0.7571 | p = 0.6153 | p = 0.7477 | |
| Cohort | # of Hips | Epiphyseal extension | ||||
|---|---|---|---|---|---|---|
| Clockface position | ||||||
| 11 o'clock | 12 o'clock | 1 o'clock | 2 o'clock | 3 o'clock | ||
| At risk athletic | 17 | 0.72 ± 0.029 | 0.69 ± 0.039 | 0.69 ± 0.055 | 0.66 ± 0.072 | 0.57 ± 0.068 |
| Recreationally active | 17 | 0.72 ± 0.047 | 0.69 ± 0.053 | 0.68 ± 0.053 | 0.65 ± 0.058 | 0.57 ± 0.070 |
| p value | p = 0.78 | p = 0.33 | p = 0.25 | p = 0.43 | p = 0.17 | |
Siebenrock et al.8 found that while athletes with open growth plates had epiphyseal extensions similar to athletes with closed growth plates, controls had a relative uniform increase in epiphyseal extension with growth plate closure. This result suggests that physeal changes that occur with increasing age are dissimilar between at risk athletic and recreationally active peer cohorts. While the position of the growth plate within the femoral head changes with age in controls, this change may not occur in at risk adolescent athletes. The methods presented in this study allow for further exploration of physeal changes by providing separate quantification of the growth plate position within the femoral head and the relative growth plate curvature.
Our results indicate that measures of growth plate orientation relative to a tangent plane do not capture the differences in the relative curvature of the growth plate. With age, tangent plane distances changed only in a very localized region, limited to within ~15° of the 12 o'clock position (Figure 8). Reference plane distances, which are a better measure of local growth plate shape, occurred between ~11 o'clock and ~4 o'clock circumferential positions (measured clockwise) (Figure 7). Because longitudinal growth is directed away from the growth plate diaphyseal surface,36 growth plate curvature may indicate changes in growth direction. Current 2D epiphyseal measures are likely not capturing important factors (such as relative growth plate curvature) for future longitudinal growth and potential impacts on cam development.
One limitation of this study is the small sample sizes within each group. We found no significant differences in normalized growth plate distance with increasing age in the at risk athletic group or between at risk athletic and recreationally active cohorts. It is possible that larger sample sizes could reveal significant variations between these groups. Despite the small sample size, we were able to highlight the advantages of using a 3D approach and the effects of measurement techniques on epiphyseal measurement outcomes. Additionally, this study only analyzed cross-sectional data and did not consider the future development of the proximal femur for the included participants. Future work will focus on applying these methods to longitudinal study data.
Cam development is linked to elite adolescent participation in at risk sports and is likely the result of a mechanoadaptive response during growth. Although the mechanism of cam formation remains poorly understood, growth plate changes are recognized as an important contributor. This study provides new methods for 3D epiphyseal measures that can capture a more robust quantification of growth plate shape in comparison to current 2D methods. In addition to its implications for understanding cam development, this method can be applied to other atypical morphologies of the proximal femur that are the result of a growth plate mechanoadaptive response.
ACKNOWLEDGMENTS
This study was funded by the National Institute for Health Research (NIHR) Oxford Musculoskeletal Biomedical Research Unit and Clinical Research Network. Support was also received from the Arthritis Research UK Centre for Sport, Exercise and Osteoarthritis and from the National Institute of Arthritis and Musculoskeletal and Skin Diseases of the National Institutes of Health under award number K23AR063235.
AUTHOR CONTRIBUTIONS
All authors have read and approved the final submitted manuscript. Credit for each authorship is as follows: Rachel E. Horenstein, Quentin Meslier, Cara L. Lewis, Sandra J. Shefelbine, Julia A. Spada, Anne Halverstadt, Scott Fernquest, Antony Palmer, Siôn Glyn-Jones, Mo Gimpel, Richard Birchall, ThaminduWedatilake.


