Evaluation of radiographers’ mammography screen-reading accuracy in Australia
Abstract
Introduction
This study aimed to evaluate the accuracy of radiographers’ screen-reading mammograms. Currently, radiologist workforce shortages may be compromising the BreastScreen Australia screening program goal to detect early breast cancer. The solution to a similar problem in the United Kingdom has successfully encouraged radiographers to take on the role as one of two screen-readers. Prior to consideration of this strategy in Australia, educational and experiential differences between radiographers in the United Kingdom and Australia emphasise the need for an investigation of Australian radiographers’ screen-reading accuracy.
Methods
Ten radiographers employed by the Westmead Breast Cancer Institute with a range of radiographic (median = 28 years), mammographic (median = 13 years) and BreastScreen (median = 8 years) experience were recruited to blindly and independently screen-read an image test set of 500 mammograms, without formal training. The radiographers indicated the presence of an abnormality using BI-RADS®. Accuracy was determined by comparison with the gold standard of known outcomes of pathology results, interval matching and client 6-year follow-up.
Results
Individual sensitivity and specificity levels ranged between 76.0% and 92.0%, and 74.8% and 96.2% respectively. Pooled screen-reader accuracy across the radiographers estimated sensitivity as 82.2% and specificity as 89.5%. Areas under the reading operating characteristic curve ranged between 0.842 and 0.923.
Conclusions
This sample of radiographers in an Australian setting have adequate accuracy levels when screen-reading mammograms. It is expected that with formal screen-reading training, accuracy levels will improve, and with support, radiographers have the potential to be one of the two screen-readers in the BreastScreen Australia program, contributing to timeliness and improved program outcomes.
Introduction
The goal of the BreastScreen Australia (BSA) program is the reduction of breast cancer mortality and morbidity through early detection and treatment. This goal may be compromised due to radiologist workforce shortages contributing to delays in women receiving their screening results.1 The number of women undergoing assessment, within the national standard of 28 days from their screening mammogram has reduced significantly between 1996 and 2005.2 In 2010 there were 70 radiologists providing services per million of the Australian population, while international levels average 100 radiologists per million of the population. Furthermore, the projected need of 1000 additional radiologists by 2021 to reach international average levels is considered unachievable.3 These delays are anticipated to increase as a result of the number of women reaching age of eligibility. There will be more women in the target age group, relative to the health and skilled labour needed for screening.2 The problem is anticipated to be further compounded by the recent increase in the breast screening target age from the current 50–69 years to 50–74 years of age.2
In the United Kingdom, as a solution to similar breast screening program delays, following support on many levels, radiographers have been trained and employed alongside radiologists as second screen-readers,4, 5 to ensure mammograms were accurately and efficiently double screen-read.4, 6 Evidence suggests that the accuracy of radiographer screen-readers in the United Kingdom is acceptable for practice. Previous screen-reading studies have reported acceptable radiographer screen-reading accuracy levels, when compared to an appropriate gold standard of known pathology and a minimum 1-year follow-up.5, 7-9 Further evidence reports that the addition of radiographers as screen-readers increased, rather than decreased, cancer detection rates.10-12
This same strategy could potentially be applied within Australian and other contexts, as a solution to radiologist shortages. In fact the BSA Evaluation Report suggests that increasing the number of available non-radiologist screen-readers may address the increasing radiologist shortages that contribute to increasing delays.2 However, Australia may differ from its U.K. counterpart due to many contributing factors including prevailing workplace attitudes, differing radiographer education and training and potential remote working conditions. These factors may contribute to variations in radiographer screen-reading accuracy. Therefore, prior to radiographers taking on the role as one of two screen-readers in any setting, it is critical to evaluate the accuracy of these radiographers as screen-readers.
Not only is there a need for an Australian study but also the need for a quality study. In their systematic review, van den Biggelaar, Nelemans, and Flobbe identified very few well-designed studies evaluating the accuracy of radiographers screen-reading.13 The design of this study aims to improve on previous studies by evaluating accuracy by comparison with a robust gold standard, while applying rigorous study design characteristics, including BI-RADS® and extensive data analysis, such as reader operating characteristic (ROC) curve analysis. The aim of this study is to evaluate the accuracy of radiographers’ screen-reading mammograms in an Australian setting.
Materials and Methods
Ethics approval was obtained through Sydney West Area Health Service Human Research Ethics Committee and University of Sydney Human Research Ethics Committee.
Screen-reader recruitment
All 20 radiographers employed in both a screening (BreastScreen) and diagnostic (symptomatic) capacity by the Westmead Breast Cancer Institute (BCI) were invited to participate in this study. Ten radiographers consented to participate with no further selection criteria applied, and were aged between 27 and 64 years. They ranged in radiographic experience between 7 and 47 years (median = 28 years, interquartile range [IQR] = 30 years); mammographic experience between 3 and 27 years (median = 13 years, IQR = 20 years) and BreastScreen experience between 3 and 17 years (median = 8 years, IQR = 10 years) and were representative of BSA radiographers. They had not received any formalised screen-reading training and were required to screen-read an image test set of 500 mammogram examinations including prior images as appropriate. They were not informed of cancer prevalence so that expectation bias was minimised.
Image test set
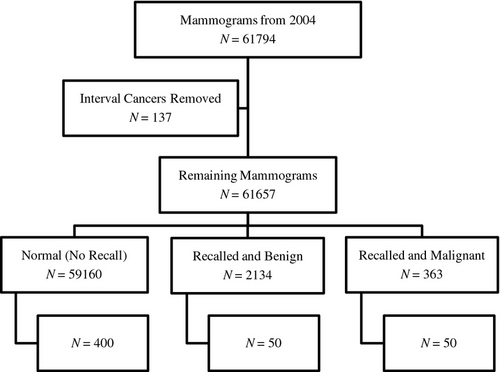
The film-screen (analogue) image test set was obtained from screening mammograms previously read during routine screening from the BreastScreen NSW Sydney West 2004 database. All interval cancers were excluded, to ensure that the cancers included in the screening set were visible on mammography. Images were stratified into three groups: normal mammograms; mammograms recalled and assessed as benign; and mammograms recalled and confirmed as cancers on the basis of histology. A systematic selection from each stratum was undertaken to obtain a sample of 500 mammogram examinations: 400 normal mammograms (80%); 50 benign lesions (10%) and 50 cancers (10%); each consisting of cranio-caudal (CC) and medio-lateral oblique (MLO) views.
The method of representative image test set compilation is presented in Figure 1. There was a representation of most typical lesion types and no limitations were applied to levels of difficulty. The distribution of benign and malignant lesion proportions is presented in Table 1. By enriching the image test set with malignant lesions it was possible to calculate accuracy levels without the impractical time-consuming task of screen-reading several thousand consecutive population mammograms to produce a sufficiently powered study to calculate meaningful accuracy levels. The original mammograms were double screen-read (triple screen-read in the case of discrepancies) by various combinations of 16 radiologists employed as first or second (or third) screen-readers.
| Recalled lesion | Benign lesion | % Benign | Malignant lesion | % Malignant |
|---|---|---|---|---|
| Calcifications | 2 | 4 | 10 | 20 |
| Discrete mass with/without calcifications | 12 | 24 | 17 | 34 |
| Stellate lesion | 0 | 0 | 17 | 34 |
| Architectural distortion | 7 | 14 | 2 | 4 |
| Non-specific density | 29 | 58 | 4 | 8 |
| Total | 50 | 100 | 50 | 100 |

The test set was randomly sorted, and then separated into 10 batches consisting of between 30 and 55 mammograms for screen-reading by the radiographers, in order to minimise potential fatigue levels.
The test set contained three unilateral images due to women having undergone mastectomy surgery of one of their breasts giving 997 individual right or left breast images.
Procedure
Images were placed for viewing (hung) on one of three Mammoviewer 810™ image viewers (Diversified Diagnostics, Inc., Houston, TX) in a quiet reporting room under the identical optimal viewing conditions and using the same standardised hanging protocol as originally viewed, with previous comparison images hung below the current 500 mammogram examinations.
Screen-reading process
The radiographers performed screen-reading over a series of sessions without any pre-specified time limits. Screen-reading was blinded to and independent of both the original radiologists report and other radiographers’ screen-reads. Screen-reading varied between daytime, evenings and weekends, and the radiographers individually chose to read between partial or multiple batches of between 20 and 155 mammograms in each screen-reading session, depending on personal, time and travelling constraints. No participants withdrew over the screen-reading period from April 2010 to May 2011.
Radiographers read the screening images using a paper standardised reporting form with a classification scale, based on the modified BI-RADS® (Reston, VA) classification lexicon14 used in BreastScreen NSW, Sydney West, as presented in Table 2. This was the same protocol used by radiologist readers in 2004. The radiographers then marked any potential lesion visualised on paper on a breast diagram in the MLO and CC projections of each breast. The radiographers were told that the circling of a ‘3, 4 or 5’ would be considered as ‘recall to assessment’, identical to normal screen-reading practice.
| BSA recommendation requirement | Modified BI-RADS® lexicon of mammogram classification |
|---|---|
| 1-Normal | ‘1’ (no lesion) |
| ‘2’ (benign lesion) | |
| 2-Suspicious | ‘3’ (probably benign) |
| ‘4’ (probably malignant) | |
| ‘5’ (malignant) |
Data analysis
The gold standard for all analyses was pathology results, interval matching and client 6-year follow-up. Accuracy for each radiographer was evaluated, and then accuracy was pooled across all radiographers. Individual radiographer accuracy levels were evaluated when screen-reading two images (CC and MLO). Both the right and left image of each mammogram (except for the three mastectomy clients, where only one breast was imaged) were included in the accuracy evaluation.
Individual accuracy
The radiographer classifications of ‘3, 4 or 5’ were defined as test positive and ‘1 or 2’ test negative, identically to routine screen-reading practice. If a lesion was drawn, it was checked that it corresponded with the location of the mammogram lesion. Side-specific analysis was undertaken. In the six examinations where there was more than one lesion in a breast, the lesion scoring a higher level of suspicion was used for analysis. These radiographer classifications were then compared to the gold standard classification of cancer or normal/benign to obtain the number of true and false positives (TP, FP) and true and false negatives (TN, FN). We estimated the sensitivity (true-positive rate) and specificity (true-negative rate) together with 95% confidence intervals (95% CI) for each radiographer. The empiric ROC curve was estimated for each radiographer.
Pooled accuracy
A bivariate model15, 16 to account for within-screen-reader correlation was used to estimate sensitivity and specificity pooled across all radiographers. This model only accounts for the within-radiographer correlation and not the within-woman correlation. To adjust pooled results for within-woman correlation, an inflation factor, based on a model of specificity alone that accounts for this correlation, was applied to the standard errors prior to the calculation of the CIs. We used separate models for each possible threshold of test positivity to estimate an approximate ROC curve. All analyses were conducted in SAS Version 9.2 (SAS Institute, Inc., Cary, NC, 2008) program and Stata Version 11.2 (Statacorp. 2009. Stata Statistical Software: Release 11, College Station, TX).
Results
Individual screen-reader accuracy
Sensitivity and specificity
Table 3 presents values for each radiographer of TP, FN, TN, FP, sensitivity, specificity and areas under the characteristic (AUC) curve (including 95% CI). Sensitivity was between 76.0% and 92.0%, and specificity was between 74.8% and 96.2%. AUC values were between 0.842 and 0.923.
| Reader | True positive | False negative | True negative | False positive | Sensitivity (95% CI) | Specificity (95% CI) | Area under curve (95% CI) |
|---|---|---|---|---|---|---|---|
| 1 | 41 | 9 | 887 | 60 | 82.0 (71.2, 92.8) | 93.7 (92.1, 95.2) | 0.903 (0.848, 0.958) |
| 2 | 38 | 12 | 911 | 36 | 76.0 (64.0, 88.0) | 96.2 (95.0, 97.4) | 0.899 (0.845, 0.953) |
| 3 | 42 | 8 | 860 | 87 | 84.0 (73.7, 94.3) | 90.8 (89.0, 92.7) | 0.890 (0.835, 0.945) |
| 4 | 38 | 12 | 881 | 66 | 76.0 (64.0, 88.0) | 93.0 (91.4, 94.7) | 0.887 (0.827, 0.947) |
| 5 | 43 | 7 | 786 | 161 | 86.0 (76.3, 95.7) | 83.0 (80.6, 85.4) | 0.902 (0.849, 0.956) |
| 6 | 40 | 10 | 862 | 85 | 80.0 (68.8, 91.2) | 91.0 (89.2, 92.8) | 0.896 (0.839, 0.954) |
| 7 | 44 | 6 | 815 | 132 | 88.0 (78.9, 97.1) | 86.1 (83.9, 88.3) | 0.912 (0.862, 0.961) |
| 8 | 41 | 9 | 831 | 116 | 82.0 (71.2, 92.8) | 87.8 (85.7, 89.8) | 0.881 (0.825, 0.936) |
| 9 | 38 | 12 | 818 | 129 | 76.0 (64.0, 88.0) | 86.4 (84.2, 88.6) | 0.842 (0.776, 0.909) |
| 10 | 46 | 4 | 708 | 239 | 92.0 (84.4, 99.6) | 74.8 (72.0, 77.5) | 0.923 (0.881, 0.966) |
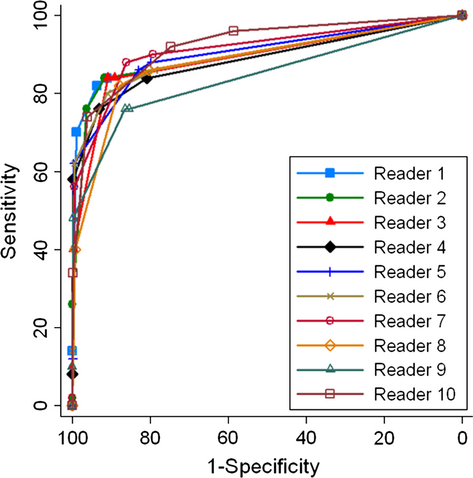
Reader operating characteristic curve
The accuracy of the radiographers across varying thresholds of test positivity are shown in Figure 2. The closer the curve to the top left-hand corner of the figure, the more accurate the reader.

Pooled screen-reader accuracy
Pooled sensitivity and specificity are presented in Table 4 for each of the separate models for the varying thresholds of test positivity.
| Positive threshold | ≥BI-RADS® ‘1, 2, 3, 4 or 5’ | ≥BI-RADS® ‘2, 3, 4 or 5’ | ≥BI-RADS® ‘3, 4 or 5’ | ≥BI-RADS® ‘4 or 5’ | ≥BI-RADS® ‘5’ | >BI-RADS® ‘5’ |
|---|---|---|---|---|---|---|
| Pooled sensitivity | 100 | 85.8 (80.5, 89.8) | 82.2 (77.1, 86.3) | 53.8 (41.1, 65.9) | 8.1 (3.4, 18.3) | 0 |
| Pooled specificity | 0 | 82.9 (73.9, 89.2) | 89.5 (83.8, 93.3) | 99.5 (98.7, 99.8) | 100.0 (99.8, 100.0) | 100 |
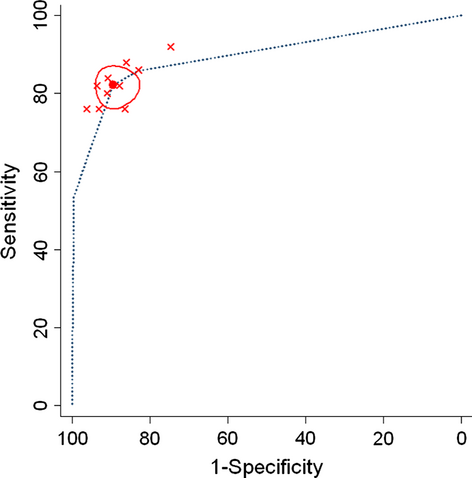
Figure 3 shows the implied ROC curve from the estimated pooled sensitivity and specificity at the various thresholds. For the most commonly used threshold of ‘3, 4 or 5’, we have also presented the original radiographers accuracy as red dots and the confidence region for the pooled accuracy shown in red circle. At this threshold the pooled sensitivity was 82.2% (77.1, 86.3) and specificity 89.5% (83.8, 93.3).

Discussion
Overall we found that accuracy varied across screen-readers, with sensitivity levels of 76.0–92.0% (median = 82, IQR = 10) and specificity levels of 74.8–96.2% (median = 89.3, IQR = 6.9), comparing favourably with other reported accuracy levels of radiographers and radiologists.5-12, 17-21 These results suggest radiographers as screen-readers have reasonable levels of sensitivity and specificity when compared to the applied gold standard. This support of ability provides further evidence in addition to previous international accuracy studies, of the ability of radiographers to read screening mammograms.
The radiographers screen-reading in this study are likely to be broadly representative of the BSA radiographer population based on their demographic and BreastScreen experience characteristics. Individual motivation and skill levels, however, may vary and while we cannot absolutely say that the study findings will generalise to the entire BSA radiographer workforce, the number of participating readers enhances the generalisability of our (pooled) estimates to all BSA radiographers.
Previous studies reported radiographer sensitivity levels of 61.0–91.42% and specificity levels of 45.0–99.1%, as presented in Table 5.5, 7, 8, 10, 17-20 When compared to previous studies, the accuracy values found in this study demonstrate higher minimum values of both sensitivity and specificity. This may indicate that a majority of the radiographers in this study had greater abnormality detection ability in comparison to radiographers in several previous studies, or that the difference can be explained by study differences. It is difficult to make comparisons between studies as there is such variation in methods employed. Differences in rigour of individual studies may have contributed such as variations in size, setting, composition, cancer prevalence and lesion proportion of the image set, combined with screen-reader experience, may potentially have influenced accuracy levels. The readers in our study may indeed have been more experienced than some readers in previous studies, but we cannot ascertain whether this accounts for the different findings in our study. In addition, the gold standard applied and the screen-reading process itself, as well as analysis of accuracy could account for accuracy differences.
| Study | Number of radiographers | Sensitivity | Specificity |
|---|---|---|---|
| Haiart and Henderson8 | 1 | 80% | 78% |
| Bassett et al.7 | |||
| Inst. 1 | 8 | 90% | 75% |
| Inst. 2 | 84% | 64% | |
| Pauli et al.5 | 7 | 73% | 86% |
| Pauli et al.20 | 7 | 83% | 80% |
| Tonita et al.9 | 3 | – | – |
| Wivell et al.6 | 3 | – | – |
| Sumkin et al.21 | 33 | – | – |
| Holt17 | 5 | 91.42% | 87.62% |
| Duijm et al.10 | 21 | 61.5% | 99.1% |
| Duijm et al.11 | 21 | – | – |
| Duijm et al.12 | 21 | – | – |
| Moran and Warren-Forward19 | 11 | 61–89% | 45–97% |
| Holt and Pollard18 | 12 | 77.1–82.6% | 75.4–79.6% |
| This study, 2013 | 10 | 82.2% | 89.5% |
A strength that can be attributed to the design of this study is the use of a modified BI-RADS® classification lexicon which facilitates ROC analysis. Pooled analysis was carried out to maximise the ability to infer the study sample results to the population.15, 16 Pooled sensitivity and specificity levels were reported in four previous studies.7, 10, 12, 17 Our approximate pooled ROC curve (see Fig. 3) represented further analysis that has not been undertaken in previous radiographer accuracy studies. ROC curves are used extensively in radiologist accuracy studies to analyse performance22 and this omission is a deficiency of previous radiographer accuracy studies, potentially due to not having a continuous test measure such as the BI-RADS® classification lexicon. This work therefore maximises the use of established analytic methods to estimate accuracy through ROC analysis, demonstrating high-accuracy levels relative to previous international radiographer accuracy studies.
It can be expected that these accuracy levels would increase with screen-reading education and training, as has been reported in previous studies.7, 20 The accuracy identified from this sample of Australian radiographers is encouraging, particularly considering the results which are comparable to trained screen-readers from other studies.5-8, 10-12, 20 This study therefore provides a baseline to measure any potential post-training accuracy differences. Several studies have recommended the necessity of training radiographers to improve accuracy prior to taking on the role as second screen-readers.5-7, 17, 20, 21 Interestingly, two of those studies17, 21 report comparable accuracy to radiologists, by radiographers without formalised screen-reading training, and may be explained through differences in experience of participants. Due to the small number of images read by some of the individual radiologists, we did not compare the accuracy of radiographers and radiologists, however, this was not an aim of this study.
In screening practice, both sensitivity and specificity are relevant due to the importance of maximising the potential for an accurate breast cancer diagnosis, while minimising anxiety caused by unnecessary recall to assessment. In typical screen-reading practice, mammograms are independently double screen-read to improve detection23-25 and increase overall accuracy levels by 10–15%.25 In potential future radiographer/radiologist double screen-reading practice, the overall accuracy levels can be expected to increase above those reported in this study.
The representative image test set, though artificially enriched with lesions, was representative of 2004 screens, the last year that had been matched for interval cancers at the time of test set compilation. This approach increased study quality by ensuring known outcomes (and hence correct classification of cases) and by including lesions representative of screen-detected cancers. Enriching the image test set with lesions allowed a sufficiently powered study to calculate meaningful accuracy levels. Although enriched test sets may lead to expectation bias due to radiographers expecting to find more cancers than are likely in consecutive population screen-reading, this is an established method in observer studies. Pauli et al. and Scott et al. have undertaken studies that report correlation between image test set results and consecutive screen-reading practice.20, 26 Furthermore, Gur et al. have reported consecutive screen-reading accuracy being significantly better than image test set results.27 Of note, we designed the study with attention to minimising the likelihood of expectation bias by ensuring that readers were not informed of the cancer prevalence or lesion proportion within the image set, therefore, this bias does not constitute a major limitation of our work.
It could be argued that a potential limitation of the study is that the method used to compile the image set did not allow us to calculate radiologists’ accuracy. While such a comparison would have provided some information it would not have been representative of the screen-readings performed by the radiologists (because it included a small subset of the screens from the study timeframe) and this was not a primary aim of our work and therefore does not undermine the integrity of the study. The test set sample limitations include the lack of allowance for within-woman correlation, potentially leading to confidence intervals that are minimally under-estimated, however, appropriate adjustment was made.
Australia predominantly uses digital technology; however, it is likely that these findings on readers’ accuracy using film-screen mammograms will transfer to screen-reading of digital mammograms. Previous studies have reported overall similar accuracy levels when comparing film-screen images and digital images.28
The results of this study provide evidence of the ability of radiographers to identify abnormalities in screening mammograms in an Australian setting. Future work is necessary to determine whether radiographers can be accepted as screen-readers in Australia. The BSA National Accreditation Standards (NAS)29 state that ‘For both medical and legal acceptance of the BreastScreen Australia program, it is necessary that at least one reader be a radiologist’, and ‘if the need arises…specifically trained non-radiologist readers could be employed’ (2008, p. 43). While maintaining this important standard, and to maintain the efficiency and accuracy of the BSA program, a radiographer could take on the role of one of the two screen-readers.
For radiographers to be accepted as non-radiologist readers, support is needed from relevant bodies within Australia. Currently, there are both political and legislative challenges to radiographers taking on the role of screen-reading. This is a very complex arena comprising a multitude of competing arguments which deserve in-depth analysis outside the scope of this paper. Suffice to say much has been written on this topic30 and much has been discussed and reported.31
Conclusion
This reported study has provided evidence that radiographers in an Australian setting demonstrate adequate screen-reading accuracy. While radiographers have the potential to be one of the two screen-readers within the BreastScreen Australia program, the current Australian context requires political and legislative change for this to take place. It may yet be some time before radiographers can contribute in this way to the timeliness and accuracy of program outcomes.
Acknowledgements
Acknowledgement goes to the Westmead Breast Cancer Institute for enabling the undertaking of this research. Thanks to the members of staff who generously contributed their skills and time.
Conflict of Interest
The authors declare no conflict of interest.


