RNA sequencing and bioinformatics analysis revealed PACSIN3 as a potential novel biomarker for platinum resistance in epithelial ovarian cancer
Funding information: Bio & Medical Technology Development Program; National Research Foundation of Korea; Yonsei University College of Medicine
Abstract
Background
Failure to respond to treatment in epithelial ovarian cancer can often be attributed to platinum-based chemotherapy resistance. However, the possible mechanisms or candidate biomarkers associated with platinum resistance are yet to be elucidated, even though many researchers have performed related studies.
Methods
We performed RNA sequencing of clinical specimens obtained from patients with platinum-sensitive or resistant epithelial ovarian cancer (EOC). Furthermore, various bioinformatics approaches, including spatial analysis of functional enrichment, were used to identify key regulators and associated underlying mechanisms of platinum resistance in EOC.
Results
Through RNA-sequencing, we identified 263 differentially expressed genes (98 upregulated and 165 downregulated) and subjected them to Gene Oncology and Kyoto Encyclopedia of Genes and Genomes pathway enrichment analyses, which were characterized to the traditional platinum-resistant characteristics. Subsequently, the gene interaction network and module analysis by spatial analysis of functional enrichment software demonstrated protein kinase C and casein kinase substrate in neurons 3 (PACSIN3) as the only upregulated hub gene, and neurotensin (NTS) and KIAA0319 as downregulated hub genes in platinum-resistant EOC. We selected PACSIN3 for further analysis because it has not been studied in relation to response to platinum-based chemotherapy. PACSIN3 was significantly upregulated in ovarian cancer cells compared to immortalized human ovarian surface epithelial cells. In addition, cisplatin-induced apoptosis was measured in PACSIN3 knockout OVCA433 and BRCA-mutated EOC cell line, SNU251, by a fluorescence-activated cell sorting-based Annexin-V/propium iodide double staining assay, which revealed a significant increase in apoptosis.
Conclusions
Taken together, the present study presents PACSIN3 as a promising predictive biomarker associated with platinum resistance, especially in BRCA-mutated epithelial ovarian cancers.
1 INTRODUCTION
Epithelial ovarian cancer (EOC) is one of the deadliest gynecological malignancies, with more than 13,770 EOC-related deaths reported in the USA in 2021.1 Currently, the standard treatment of choice for EOC is maximal debulking surgery, followed by platinum-based chemotherapy. Introduced in the late 1970s, platinum-based chemotherapy demonstrated magnificent clinical trial results by doubling the overall and complete response rates, compared to non-platinum-based chemotherapy.2, 3 However, up to 80% of patients who show a good response to platinum-based chemotherapy ultimately acquire platinum resistance, and the choice of second-line therapy is limited.4 Recently, in the era of targeted therapy, anti-angiogenic therapy (bevacizumab); poly adenosine diphosphate-ribose polymerase inhibitors; or immunological therapy such as single-agent programmed cell death protein 1 inhibitor have been highlighted for the treatment of EOC.5 However, platinum-based chemotherapy remains the backbone of treatment, and the development of platinum resistance is a major obstacle for the treatment of EOC. Therefore, there is an urgent need to identify biomarkers related to the mechanisms of platinum resistance, which may reveal new pathways with high clinical relevance.
Over the past few decades, the development of an array of high-throughput technologies for measuring RNA, RNA-sequencing (RNA-seq), and various bioinformatic analyses have provided a comprehensive understanding of transcriptomes to unveil novel genes, allele-specific expressions, fusion genes, disease-associated single nucleotide polymorphisms, post-transcriptional modifications, non-coding RNAs and differentially expressed genes (DEGs) across different groups or treatments.6 The Cancer Genome Atlas project identifies candidate therapeutic targets for precision medicine by utilizing this technology to create transcriptome data for 33 types of cancer, including EOC. [7-9] Platinum-sensitive and platinum-resistant EOC cells and the GEO database (https://www.ncbi.nlm.nih.gov/geo) have been contrasted through the usage of RNA-seq, but the mechanism of resistance is still unclear.7
Hence, in the present study, we performed RNA-seq to compare samples from platinum-sensitive and platinum-resistant EOC patients, and examined DEGs with bioinformatic studies to identify promising biomarkers associated with the development of resistance to platinum-based chemotherapy in EOC. In addition, public data along with our in vitro data revealed the significance of the biomarkers investigated through RNA-seq.
2 MATERIALS AND METHODS
2.1 Patients and tumor specimens
Sixteen EOC formalin-fixed, paraffin-embedded (FFPE) tissue samples of patients who were diagnosed with EOC and underwent debulking surgery at the Department of Obstetrics and Gynecology, Gangnam Severance Hospital, Yonsei University College of Medicine between 2018 and 2020 were provided by the Korean Gynecologic Cancer Bank, as part of the Bio & Medical Technology Development program of the Ministry of the National Research Foundation (NRF) funded by the Korean government (MIST) (NRF-2017M3A9B8069610). In compliance with the Declaration of Helsinki, written informed consent was received from each patient before obtaining all specimens and patient information. This study received approval from the Institutional Review Board (IRB) of Gangnam Severance Hospital (IRB no.3–2020-0377). All patients included in this study underwent combination treatment with carboplatin and paclitaxel after receiving maximal debulking surgery. Before the surgery, none of the patients had received chemotherapy. All specimens were histologically confirmed and were staged according to the International Federation of Gynecology and Obstetrics (FIGO) staging system and graded based on the World Health Organization grading system. The time interval between the surgery and either the last follow-up visit or the date of recurrence/progression was referred to as progression-free survival (PFS). The Response Evaluation Criteria in Solid Tumors (RECIST, version 1.1), which considers CA-125 levels, computed tomography or positron emission tomography to determine disease progression, was utilized to define the date of recurrence or progression [21]. Platinum resistance was defined as PFS of less than 6 months after the last platinum-based treatment, and patients with PFS of over 12 months were categorized as platinum-sensitive. Overall, eight platinum-sensitive primary high-grade serous ovarian cancer (HGSOC) FFPE tissues and eight platinum-resistant primary HGSOC FFPE tissues were included.
2.2 Laser-capture microdissection (LCM) and RNA extraction and quality control
Hematoxylin and eosin were used to stain all FFPE tissue slides; an experienced gynecological pathologist then reviewed these slides. A Leica AS LMD laser microdissection system (Leica Microsystems Inc., Buffalo Grove, IL, USA) was utilized in accordance with the manufacturer's instructions to perform LCM to cut out the desired lesions from the tissue. The sectioned FFPE tissues were placed on slides with a polyethylene terephthalate membrane (Leica Microsystems Inc.). TRIzol reagent (Invitrogen, Waltham, MA, USA) was used to isolate total RNA, and the quality of the RNA was measured with an Agilent 2,100 bioanalyzer which utilized the RNA 6000 Nano Chip (Agilent Technologies, Amstelveen, The Netherlands). An ND-2000 Spectrophotometer (ThermoFisher, Waltham, MA, USA) was used for RNA quantification.
2.3 Library preparation and sequencing
For control and test RNAs, library construction was performed using the QuantSeq 3′ mRNA-Seq Library Prep Kit (Lexogen, Inc., Vienna, Austria), in accordance with the manufacturer's instructions. In brief, 500 ng of total RNA for control and test RNAs were prepared. An oligo-dT primer that included an Illumina-compatible sequence at its 5′ end was hybridized to the RNA. Reverse transcription was performed and, after the RNA template was degraded, a random primer that had an Illumina-compatible linker sequence at its 5′ end was utilized for second-strand synthesis. Magnetic beads were used to purify the double-stranded library. To ultimately perform cluster generation, complete adapter sequences were added to this library; polymerase chain reaction (PCR) components were then removed from this final library. A NextSeq 500 (Illumina, Inc., San Diego, CA, USA) was utilized for single-end 75 bp high-throughput sequencing.
2.4 RNA sequencing read mapping and gene expression analysis
Through the sequencing process, we obtained FASTQ raw data for eight independent libraries for both platinum-sensitive and platinum-resistant strains; in total, 16 samples were obtained. All FASTQ reads were trimmed for quality control and adapter trimming using Bbduk (BBMap, version 36.59)8 and FASTQC, (version 0.11.7)9 for the sequencing data. We carried out mapping through the STAR-HTSeq workflow, that is, STAR (version 2.7.3a)10 and HTSeq-count (version 0.12.4),11 where the reference genome (GRCh38) and the annotation were aligned with the sequencing reads. After carrying out read counts, we performed normalization and differential expression analysis on gene expression levels using DESeq2 (version 1.26.0 R)12 for which the normalization method was applied as variance stabilizing transformation. We selected significantly DEGs satisfying two different criteria: (i) adjusted p-value (Benjamini–Hochberg) < 0.05 and (ii) absolute log2 fold change (|log2FC|) > 1.
2.5 EnrichR database analysis
To investigate the biological processes involving the identified DEGs, Gene Ontology (GO) (http://geneontology.org) functional annotation and Kyoto Encyclopedia of Genes and Genomes (KEGG) (https://www.genome.jp/kegg) pathway enrichment analysis with DEGs were performed using the EnrichR database.13 Three categories, biological process, cellular component and molecular function, were included in the GO functional annotation. The top ten enriched GO items and KEGG pathways were downloaded.
2.6 Finding key regulators and functional sub-networks
To identify sub-network modules associated with platinum resistance, we first investigated the centralities of DEGs in the STRING functional protein network (version 11.0)14 restricted to associations with high confidence (confidence score > 0.7). Using NetworkAnalyzer tool embedded in Cytoscape (version 3.8.1),15 we measured five centralities (degree, betweenness, closeness, clustering coefficient and neighborhood connectivity) of each DEG. Subsequently, based on each centrality measure, we extracted the top 30 hub DEGs for each centrality, and then selected the hub DEGs commonly included in the top 30 for all centralities as candidate key regulator. The functional sub-networks that may be regulated by the candidate key regulators could be predicted using the spatial analysis of functional enrichment (SAFE) software16 within the Cytoscape plug-in. SAFE can detect network regions that are statistically over-represented by functional groups or pathways of interest. From the largest component composed of DEGs and their first neighbors in the STRING network, we explored the pathway-enriched network regions and then defined the pathway-enriched network regions involving key regulators as functional sub-networks associated with platinum resistance.
2.7 Public database
To validate our RNA sequencing data, two datasets (GEO4555317 and GEO14914618) analyzed DEGs between platinum-sensitive and platinum-resistant HGSOC samples were used after downloading from the GEO database (accessed December 20, 2021).
2.8 Cell culture
The human ovarian cancer cell line, OVCAR3, was purchased from the American Type Culture Collection (ATCC, Manassas, VA, USA). SNU251 cells were purchased from the Korea Cell Line Bank (KCLB, Seoul, Republic of Korea). All cell lines were cultured in RPMI 1640 supplemented with 10% fetal bovine serum (FBS) and 1% penicillin/streptomycin. OVCA433 cells were obtained from the Catholic University of Korea, St Vincent's Hospital, and cultured in Dulbeccos’ modified Eagle's medium (DMEM) supplemented with 10% FBS and 1% penicillin/streptomycin. Two immortalized human ovarian surface epithelial (iHOSE) cell lines (IHOSE1481 and 4138) were established previously,19 and maintained in DMEM supplemented with 10% FBS and 50 μg/ml gentamicin. All the cell lines were incubated at 37°C in a humidified incubator with 5% CO2.
2.9 siRNA transfection
Specific small interfering RNA (siRNA) pools for protein kinase C and casein kinase substrate in neurons 3 (PACSIN3) were purchased from Santa Cruz Biotechnology (Santa Cruz, CA, USA). siRNA was transfected into six-well plates at a dose of 50 pmol per well using Lipofectamine® RNAiMAX Reagent (Invitrogen), in accordance with the manufacturer's instructions.
2.10 Real-time quantitative reverse transcriptase (RT)-PCR
In accordance with the manufacturer's instructions, the AccuPrep® Universal RNA Extraction Kit (Bioneer, Seoul, Republic of Korea) was used to isolate total RNA and AccuPower® RocketScript™ RT PreMix (Bioneer) was used to synthesize cDNA. An Applied Biosystems 7300 real-time PCR system (Applied Biosystems, Foster City, CA, USA) was utilized with TOPreal™ quantitative PCR 2X PreMIX (SYBR Green with high ROX; Enzynomics, Daejeon, Republic of Korea) to perform real-time quantitative PCR, with the reaction conditions of 10 min of pre-incubation at 94°C, then 40 cycles of 10 s at 94°C, 15 s at 60°C, 15 s at 72°C, and a melting curve program with increasing temperature from 60°C to 95°C. Relative mRNA expression was quantified via the comparative cycle threshold method (2-∆∆Ct); normalization was performed utilizing GAPDH as an endogenous control. The primers were utilized were: 5′-AGAAGGCTGGGGCTCATTTG-3′ (forward); 5′-AGGGGCCATCCACAGTCTTC-3′ (reverse); 5′-AGAGCTGCATCGCTACACTC-3′ (forward); 5′-CAGCGCAGATCCTCTTCGTC-3′ (reverse); GAPDH; and PACSIN3. All studies were conducted in triplicate.
2.11 Flow cytometric analysis
OVCA433 and SNU251 cells were treated with cisplatin and collected for apoptosis analysis. For 15 min in the dark and at room temperature, propium iodide (PI) and Annexin V-fluorescein isothiocyanate (FITC) (BD Biosciences, Waltham, MA, USA) were used to incubate and stain the cells. Binding buffer was used to dilute the stained cells, which were subsequently analyzed by flow cytometry via a FACS-Canto II (BD Biosciences) analyzer and then FACSDiva software (BD Biosciences).
2.12 Statistical analysis
SPSS, version 25.0 (IBM Corp., Armonk, NY, USA) or R, version 3.32 (R Foundation, Vienna, Austria) was used for the statistical analysis of the experimental data. The Mann–Whitney U test or the Kruskal–Wallis test was used to compare the groups, as appropriate. Quantitative data are presented as the mean ± SD. p < 0.05 was considered statistically significant.
3 RESULTS
3.1 Transcriptome profiles showing molecular signatures in patients with platinum-resistant versus platinum-sensitive EOC
Various biomarkers have been proposed to identify resistance to platinum-based chemotherapies. However, reliable predictive biomarkers have not yet been identified. As such, we assessed gene expression changes via RNA-Seq in platinum-resistant EOCs (n = 8) compared to platinum-sensitive EOCs (n = 8). The characteristics of patients involved in this study are summarized in Table 1. Patients in the platinum-sensitive group were either grade 2 or 3, stage III or IV according to the FIGO system, except for one patient who was diagnosed with grade 1 or stage I. In the platinum-resistant group, all patients were either grade 3 or 4, stage III or IV. All 16 patients underwent maximal debulking surgery with a residual disease of no more than 1 cm, and none of the patients underwent neoadjuvant chemotherapy.
| Patient no. | Age | Histologic type | Stage | Grade | Adjuvant CTx1 | NAC2 | Prediction |
|---|---|---|---|---|---|---|---|
| 1 | 51 | Serous | 3 | 3 | Carbo-Taxol3 | X | Sensitive |
| 2 | 51 | Serous | 3 | 3 | Carbo-Taxol | X | Sensitive |
| 3 | 47 | Serous | 3 | 3 | Carbo-Taxol | X | Sensitive |
| 4 | 65 | Serous | 1 | 1 | Carbo-Taxol | X | Sensitive |
| 5 | 41 | Serous | 3 | 3 | Carbo-Taxol | X | Sensitive |
| 6 | 53 | Serous | 3 | 3 | Carbo-Taxol | X | Sensitive |
| 7 | 57 | Serous | 4 | 4 | Carbo-Taxol | X | Sensitive |
| 8 | 74 | Serous | 3 | 3 | Carbo-Taxol | X | Sensitive |
| 9 | 53 | Serous | 4 | 4 | Carbo-Taxol | X | Resistance |
| 10 | 43 | Serous | 3 | 3 | Carbo-Taxol | X | Resistance |
| 11 | 76 | Serous | 3 | 3 | Carbo-Taxol | X | Resistance |
| 12 | 71 | Serous | 3 | 3 | Carbo-Taxol | X | Resistance |
| 13 | 54 | Serous | 3 | 3 | Carbo-Taxol | X | Resistance |
| 14 | 51 | Serous | 3 | 3 | Carbo-Taxol | X | Resistance |
| 15 | 55 | Serous | 3 | 3 | Carbo-Taxol | X | Resistance |
| 16 | 58 | Serous | 3 | 3 | Carbo-Taxol | X | Resistance |
- 1 CTx, chemotherapy;
- 2 NAC, neoadjuvant chemotherapy;
- 3 Carbo-Taxol, carboplatin-taxol.
When comparing the platinum-sensitive and platinum-resistant groups, we identified 263 DEGs, of which 98 were upregulated and 165 were downregulated (|log2FC| > 1 and p ≤ 0.05) (Figure 1A,B). The list of DEGs identified in the present study includes genes already known to be associated with platinum resistance, according to previous studies. For example, C-C motif chemokine ligand 2 (CCL2) was reported to be linked to platinum resistance via epithelial to mesenchymal transition and the CCL2/CCR2 signaling pathway in EOC, and interleukin-10 (IL-10) has been reported to be associated with platinum resistance in EOC and breast cancer via tumor-associated macrophages through the IL-10/STAT3/bcl-2 signaling pathway.20-22 In addition, it has been reported that a family with sequence similarity 72 A (FAM72A) and keratin 18 pseudogene 4 (KRT18P4) are associated with platinum resistance in various solid cancers, including EOC.23, 24 Conversely, by examining the DEGs overexpressed in platinum-sensitive EOC, dynein axonemal heavy chain 10 (DNAH10), RPA-related, RAD51-antagonist on X-chromosome (RADX) and Tubulin Alpha 4 B (TUBA4B) were overexpressed in platinum-sensitive EOC, as reported previously.25-27
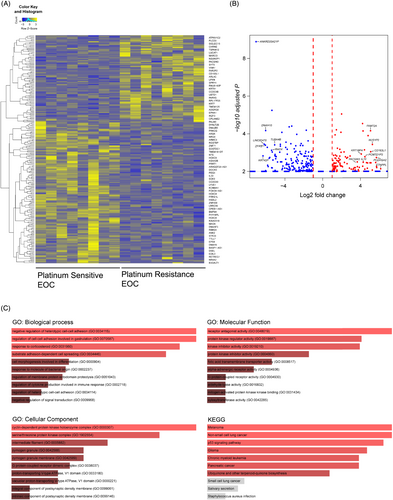
Because the list of DEGs in platinum resistance by itself does not provide immediate insights into the biological mechanism associated with platinum resistance in EOC, we performed GO and KEGG enrichment pathway analyses (Figure 1C). As expected, significantly enriched pathways were related to altered apoptosis, cell cycle, DNA damage repair and epithelial to mesenchymal transition, which play pivotal roles in migration, invasion and acquisition of chemoresistance in various cancers.28, 29 Notably, serine/threonine kinase activity, termed the AKT and p53 signaling pathways, was dysregulated. Normally, when there is an extensive DNA break, p53 is phosphorylated on serin-15 by cisplatin-induced activation of ATR kinases and promotes expression of cell death-related genes, both apoptotic and non-apoptotic [33-35]. In tumors, p53 overexpression is often considered to signify a mutation in the TP53 gene and indicates cancer. Yang-Hartwich et al.30 found that chemoresistance in HGSOC is caused by p53 overexpression which leads to wild-type p53 aggregation. In summary, our RNA-seq data and the resultant observed DEGs and GO and KEGG pathway analyses, represent the group of platinum-resistant EOC.
3.2 Our functional sub-networks participate in the regulation of activities of platinum-based drugs
Because the genes that are induced or suppressed in platinum-resistant EOC are connected to each other through functional pathways and/or coregulatory signatures, we further investigated hub DEGs with potential key roles in platinum resistance using STRING functional protein network (version 11.0).15 Using five centralities (degree, betweenness, closeness, clustering coefficients and neighborhood connectivity), the hubness of each DEG was measured in the STRING network, and three hub DEGs commonly included in the top 30 for all centralities were predicted as candidate key regulators (see Supporting information, Table S1). Among these candidates, PACSIN3 was upregulated, and neurotensin (NTS) and KIAA0319 were downregulated in platinum-resistant EOCs, compared to platinum-sensitive EOC (Figure 2A).
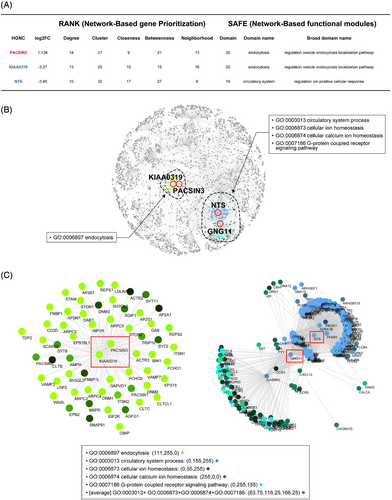
To identify the biological function of the candidate key regulator under platinum resistance, we performed a network-based enrichment test using the SAFE software.15 As shown in Figure 2B, we found two functional sub-networks, both of which are linked to ion transportation and endocytosis. In the setting of platinum-based chemotherapy, these functions are involved in regulating the detoxification, accumulation, entry, exit and sequestration of the drug [37] (Figure 2C).
3.3 Verification of hub genes from a public database
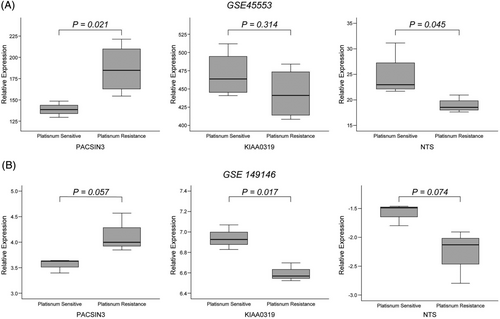
After identifying the key regulators related to the response to platinum-based chemotherapy, we further verified PACSIN3, NTS, KIAA0319 from the public GEO database by comparing the expression levels of platinum-sensitive and resistant HGSOC cell lines. Based on GSE45553, PACSIN3 and NTS showed significantly different expression levels, which was similar to our data; however, KIAA0319 did not show the same trend as our data (Figure 3A). In addition, in GSE149146, PACSIN3 and KIAA0319 showed significantly different expression levels, similar to our data; although the expression pattern of NTS was the same as our data, it did not show significance (Figure 3B). Overall, the expression patterns of the candidate key regulators selected through our RNA-seq data and the expression patterns in the public database showed a similar trend. Finally, we selected PACSIN3 for further analysis because it has not been studied in relation to the response to platinum chemotherapy and is the only key regulator upregulated in platinum-resistant EOCs.
3.4 PACSIN3 was significantly associated with platinum resistance in EOC cell lines
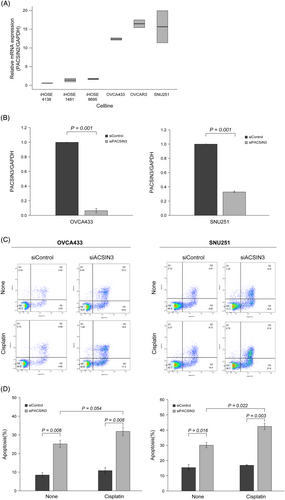
Finally, to eliminate the chance of PACSIN3 expression only occurring in GEO databases, we also compared the expression levels in various ovarian cell lines. Because platinum has been known to be an effective anticancer drug in BRCA-mutated cancers via leading homologous recombination deficiency [38], in addition to serous ovarian cancer cell lines, we also evaluated PACSIN3 expression levels in SNU251 cells, a BRCA mutated EOC cell line. Quantitative PCR showed that serous ovarian cancer cell lines and SNU251 cells had abundant levels of PACSIN3 mRNA expression, whereas levels were almost undetectable in iHOSE cell lines (Figure 4A). Consequently, we utilized siRNA transfection to knockdown expression of PACSIN3 in OVCA433 and SNU251 cells (Figure 4B). An Annexin V/PI staining assay was used to determine the impact of PACSIN3 knockdown on chemosensitivity of EOC cell lines. Utilizing flow cytometry, it was found that PACSIN3 knockdown significantly increased the apoptotic ratio in both OVCA433 (8.6 ± 1.2 to 25.2 ± 1.93) and SNU251 (15.55 ± 1.91 to 30.15 ± 1.77) cells (Figure 4C,D). Furthermore, in the OVCA433 and SNU251 cells transfected with siPACSIN3, cisplatin treatment resulted in significantly increased levels of apoptosis. In summary, the results suggested that PACSIN3 contributes to EOC cell line resistance to cisplatin-induced apoptosis.
4 CONCLUSIONS
Platinum-based chemotherapy followed by debulking surgery is the standard treatment for patients with EOC. However, platinum resistance is a major limitation in disease management, regardless of recent progress in treatment. Therefore, studying biomarkers to overcome platinum resistance is critical for improving the treatment response in patients with EOC. Hence, in the present study, we confirmed PACSIN3 as the key regulator associated with platinum-resistant EOC through both systems biology to screen DEGs in a network-based strategy and in vitro analysis with various EOC cell lines.
We propose PACSIN3 to be a novel biomarker linked with resistance to platinum therapy in EOC, based on a SAFE analysis and several validation techniques such as FACS-based Annexin-V/PI double staining in OVCA433 and SNU251. PACSIN3 is a protein in the feline sarcoma Cdc42 interacting protein 4 (Fes-CIP4) homology BAR (F-BAR) subfamily within the BAR-domain superfamily of proteins.31, 32 To date, the expression of PACSIN3 has been known to utilize actin cytoskeletal rearrangement to prevent dynamin-mediated endocytosis, although its role has only been revealed in the lung, heart and muscle.33, 34 However, its role in various solid tumors has not been elucidated, but we suggest three different hypotheses. Endocytosis is an important mechanism for the uptake of macromolecules, and plays a role in platinum resistance.35 Roach and Plomann36 reported that PACSIN3 mediates subcellular localization of transient receptor potential vanilloid type 4 (TRPV4).37 TRPV4 is a cation channel, and its overexpression in epithelial cells promotes angiogenesis, tumor growth, and resistance to cisplatin and oxaliplatin treatment in EOC and breast cancer.38 Second, PACSIN3 overexpression inhibits GLUT1 endocytosis, thereby increasing GLUT1 in the plasma membrane.36 In EOC, GLUT1 is known to recycle continuously between the intracellular membrane and plasma membranes. Previous studies have shown that, when endocytosis is inhibited and thus GLUT1 is upregulated in the plasma membrane, the rate of glucose metabolism markedly increases; this increase is linked to platinum resistance, malignant transformation and patient prognosis in EOC.39, 40 Therefore, inhibition of GLUT1 endocytosis by PACSIN3 via the clathrin-coated pit pathway is another possible mechanism associated with platinum resistance.41 Modregger et al.42 reported that PACSIN3 binds to the cytoplasmic proline-rich region of ADMA12, which is linked with platinum resistance and poor prognosis in EOC by activating the estimated glomerular filtration rate signaling pathway through G-protein-coupled receptors.
In summary, we identified novel biomarkers associated with platinum resistance in EOC by conducting a thorough systematic investigation using RNA-seq technology and bioinformatic analysis. We identified PACSIN3 as an up-regulated gene in three independent cohorts. In addition to the three independent cohorts, our functional study confirmed the association with platinum resistance of PACSIN3 in two EOC cell lines, as well as GO term enrichment analysis. Our data highlight the capability of RNA-seq technology and bioinformatic analysis to discover novel genes involved in platinum resistance in EOC, which may serve as alternative biomarkers and/or molecular treatment targets for EOC.
ACKNOWLEDGEMENTS
We thank the Bioinformatics Collaboration Unit (BiCU) in the Department of Biomedical Systems Informatics, Yonsei University College of Medicine, for RNA-seq and downstream data analysis. This work was supported by the National Research Foundation of Korea (NRF) grant funded by the Korea government (MIST) (NRF-2020R1A2C2004782). The research was supported by the Bio & Medical Technology Development Program of the National Research Foundation (NRF) funded by the Korean government (MSIT) (NRF-2017M3A9B8 069610). The study was also supported by a faculty research grant of Yonsei University College of Medicine (No. 6–2020-0226).
AUTHOR CONTRIBUTIONS
Hanbyoul Cho and Gwan Hee Han are responsible for study conceptualization. Gwan Hee Han is responsible for the gormal analysis. Gwan Hee Han, Jun Eun Shim, Hee Yun, Julie Kim and Jae-Hoon Kim are responsible for study investigations. Gwan Hee Han is responsible for writing the original draft. Hanbyoul Cho and Jae-Hoon Kim are responsible for reviewing and editing.
CONFLICTS OF INTEREST
The authors declare that they have no conflicts of interest.
Open Research
DATA AVAILABILITY STATEMENT
The datasets generated during and/or analyzed during the current study are available from the corresponding author upon reasonable request.


