Single-cell transcriptomes reveal characteristic features of cell types within the human adrenal microenvironment
Lin Huang, Jinling Liao, and Yang Chen contributed equally to this work.
Abstract
Various cells within the adrenal microenvironment are important in maintaining the body homeostasis. However, our understanding of adrenal disease pathogenesis is limited by an incomplete molecular characterization of the cell types responsible for the organ's multiple homeostatic functions. We report a cellular landscape of the human adrenal gland using single-cell RNA sequencing. We reveal characteristic features of cell types within the human adrenal microenvironment and found immune activation of nonimmune cells in the adrenal endothelial cells. We also reveal that abundant immune cells occupied a lot of space in adrenal gland. Additionally, Sex-related diversity in the adrenocortical cells and different gene expression profiles between the left and right adrenal gland are also observed at single-cell resolution. Together, at single-cell resolution, the transcriptomic map presents a comprehensive view of the human adrenal gland, which serves as a fundamental baseline description of this organ and paves a way for the further studies of adrenal diseases.
Abbreviations
-
- DEGs
-
- differentially expressed genes
-
- DPBS
-
- Dulbecco's Phosphate Buffered Saline
-
- EC
-
- endothelial cells
-
- PCA
-
- principle component analysis
-
- QC
-
- quality control
-
- RT-qPCR
-
- quantitative reverse transcription PCR
-
- ScRNA seq
-
- single cell RNA sequencing
-
- t-SNE
-
- t-distributed stochastic neighbour embedding
-
- UMAP
-
- uniform manifold approximation and projection
-
- VSMC
-
- vascular smooth muscle cells
-
- ZF
-
- zona fasciculata
-
- ZG
-
- zona glomerulosa
-
- ZR
-
- zona reticularis
1 INTRODUCTION
The adrenal gland is an important and complex endocrine organ that consists of various cell types with diverse functions. Two embryonically different tissues coexist in the adrenal gland: mesodermally derived, corticosteroid-producing adrenal cortex and ectodermally derived, catecholamine-producing adrenal medulla (Yates et al., 2013). The adult human cortex is composed of three histologically and functionally distinct layers: the outermost zona glomerulosa (zG), the middle zona fasciculata (zF) and the inner zona reticularis (zR) (Miller & Auchus, 2011; Nussdorfer, 1986). Adrenomedullary chromaffin cells secrete two products: norepinephrine and epinephrine, which acutely promote increased cardiac output and high blood pressure responses to stress (Ensinger et al., 2002; Trager & Radermacher, 2003).
As a major effector organ of the stress system, there is a coordinated interaction of various cell types within the adrenal microenvironment that is involved in maintenance of body homeostasis. Within the microenvironment, the immune-adrenocortical and immune-adrenomedullary crosstalk, adrenocortical-medullary cell interactions and adrenal vascular system exert crucial functions. There is a complex interplay among numerous cells, including adrenocortical, chromaffin, endothelial, immune and others. These various cells influence each other through secretion of biologically active products directly or in a paracrine manner (Ehrhart-Bornstein et al., 1998; Kanczkowski et al., 2016) In stress-free conditions, adrenal-resident immune cells play a vital role in engulfing and digesting cellular debris and pathogens, removing apoptotic cells and secreting growth factors to regulate tissue remodeling (Bornstein et al., 2004; Kanczkowski et al., 2015). During stress-related inflammatory conditions, there are rapid changes within adrenal immune cell populations, including leucocyte and neutrophil infiltration (Engstrom et al., 2008; Kanczkowski et al., 2013).
Above all, different cell types within the microenvironment, and their intra-adrenal interactions, maintain adrenal homeostasis during physiological and pathophysiologic conditions. However, current understanding of human adrenal cellular organization is limited. Many details about the exact cell subgroups remain unknown. small conditional RNA (scRNA)-seq can help close this knowledge gap. Traditional sequencing methods can only obtain the average gene expression of many cells, and not analyze the heterogeneity information between single cells. Compared with the traditional sequencing technology, single cell sequencing technology has the advantages of detecting the heterogeneity between single cells, identifying small clusters of cells and drawing cell maps (Wen & Tang, 2018). This technique was recently used to establish transcriptome profiles of single cells and dissect the heterogeneity of cell types, such as human pancreas (Muraro et al., 2016) testis (Guo et al., 2018) liver (MacParland et al., 2018), and brain (Johnson et al., 2015). Additionally, it can help identify some novel cell types as well as novel marker genes of known cell populations (Wang & Navin, 2015).
Taking advantage of scRNA-seq, in this study, we aimed to determine the cellular landscape of the human adrenal gland. After analysis, we demonstrated a comprehensive view of the human adrenal gland at single-cell resolution. These data will uncover aspects of the immuno-microenvironment in the adrenal gland and serve as a fundamental baseline description of this organ.
2 MATERIALS AND METHODS
2.1 Experimental model and subject details
Adult human adrenal samples for scRNA-seq, immunostaining and qPCR analysis were collected from the First Affiliated Hospital of Guangxi Medical University and the Affiliated Tumor Hospital of Guangxi Medical University (characteristics of these patients were summarized in Table S1). The adrenal tissues from these three subjects were: Patient (P) #1 (woman), 54 years old; P #2 (man), 59 years old; P #3 (man), 73 years old. P #1 and P #3 samples were obtained from patients with an upper pole kidney tumor who needed a radical nephrectomy. The P #2 sample was obtained from a patient with a benign adrenal cystic mass. All patients underwent a detailed preoperative evaluation. The diagnosis was based on clinical presentation, imaging characteristics and postoperative histopathological data. Adrenal samples were confirmed to have normal histological patterns. The human protocols were approved by the Institutional Ethics Review Board of The First Affiliated Hospital of Guangxi Medical University. Informed consent for research was obtained from all three participants.
2.2 Human adult adrenal sample preparation for scRNA-seq
After surgery, 10% of the three human adrenal tissues were collected for Immunohistochemical analysis and qPCR analysis. A total of 90% remaining normal adrenal tissues were transferred immediately to a cold transfer buffer (RPMI medium [no.: C11875500BT; Gibco] with 1% antibiotic/antimycotic [no.: 15240062; Gibco]) and delivered to the laboratory within 15 min for digestion. The tissue was transferred to a 100 mm plate with cold Dulbecco's Phosphate Buffered Saline (DPBS) (no.: 311425CL; WISENT) and minced with sterilised scissors. Adrenal pieces were placed in DPBS in a 15 ml conical tube and centrifuged at 300g for 3 min at 4°C. The supernatant was discarded, the pellet was resuspended in 10 ml DPBD with a pipette and then centrifuged at 300g for 3 min at 4°C. Subsequently, 10 ml enzymatic digestion buffer was added to the tissue pieces: 1 mg/ml collagenase type VI (no.: 17104019; Gibco), 1.2 mg/ml dispase II (no.: 049420780; SIGNA), 0.2 mg/ml DNase I (no.: 10104159001; Roche) and 5% foetal bovine serum (no.: 10091148; Gibco) in HBSS (no.: 311512009; WISENT), filtered through a 0.22 µm filter (BD). The mixture was digested at 37°C for 50 min. Subsequently, 10 ml cold DPBS was added to the digestion solution, and it was filtered through a 100 µm strainer and centrifuged at 300g for 5 min at 4°C. The cell pellet was resuspended in DPBS and centrifuged at 300g for 5 min at 4°C. The supernatant was removed and discarded, 1 ml 1X RBC lysis buffer (no.: 420301; BioLegend) was used to resuspend the cell pellet and incubated for 5 min to remove red blood cells. Next, 10 ml cold DPBS was added, the cells were filtered through a 40-µm strainer and the mixture was centrifuged at 300g for 5 min at 4°C. The cell pellet was resuspended in DPBS and centrifuged at 300g for 5 min at 4°C. The pellet was resuspended in DPBS, and cells were counted with trypan blue. It took approximately 2 h to prepare the human adrenal single-cell suspension.
2.3 scRNA-seq, library preparation, and sequencing
Libraries were prepared as outlined by the 10x Genomics Single Cell 3′ v2 Reagent Kit user guide (https://support.10xgenomics.com/single-cell-gene-expression/index/doc/user-guide-chromium-single-cell-3-reagent-kits-user-guide-v2-chemistry). Briefly, sample viability was assessed via a haemocytometer (Thermo Fisher Scientific) with trypan blue. Following counting, the appropriate volume for each experiment was calculated for a target capture of 10,000 single cells. As per the manufacturer's recommendations, the single cells, gel beads and oils were mixed and then loaded into the 10x Genomics single-cell-A chip. After droplet generation, samples were transferred into a PCR tube (Eppendorf), heat-sealed and reverse transcription was performed using a T100 Thermal Cycler (Bio-Rad). Using the Recovery Agent provided by 10x Genomics, complementary DNA (cDNA) was recovered after the reverse transcription and then cleaned using a Silane DynaBead following the user's guide. Before being cleaned up, purified cDNA was used for library amplification (10 cycles using SPRIselect beads; Beckman), and then run on the Qubit2.0 Fluorometer (Invitrogen) to determine cDNA concentration.
2.4 Processing of scRNA-seq data and preliminary results
The resulting libraries were run on an Illumina HiSeq. 2500 instrument (Illumina) to generate preliminary sequencing data (bcl files) with the following parameters: read 1, 150 cycles; read 2, 150 cycles; index, 14 cycles. The raw data were then converted to fastq files with the cell ranger count application using default settings and then aligned to the human genome reference sequence (GRCh38). Cell Ranger (version3.0, https://support.10xgenomics.com/single-cell-gene-expression/software/pipelines/latest/what-is-cell-ranger) analysis was used to generate a file from the preliminary data for further analysis (gene expression matrix, gene table, and cellular barcode table). The overview information, including number of cells, median number of genes, sequencing saturation and depth, are summarized in Table S2.
2.5 Quantification and statistical analysis
We use R (https://www.r-project.org/version 3.5.1) and Seurat (https://satijalab.org/seurat/version 3.1.0) packages to perform dimensional reduction, normalisation, cell identification, and clustering analysis. We first used the Read10X function to load the raw (non-normalised) data from each patient into R and then built the Seurat objects. Seurat objects (matrices from three human different adrenal samples) were then combined using the MergeSeurat function and normalised with default settings. We eliminated dead and dying cells with gene count expression of more than 3000 genes or less than 200 and cells with more than 20% expression of mitochondrial genes according to the median number of genes and the percentage of mitochondrial genes (Figure S2a,b). Standard scRNA-seq filtering excludes cells with a high ratio of reads from mitochondrial genome transcripts, which indicates potential plasma membrane rupture and dissociation-based damage. Specifically, the adrenal gland has a very high mitochondrial content, and thus we chose a threshold of 20% to optimise keeping adrenalocytes. After data normalisation with LogNormalize, we used the method FindVariableGenes to calculate highly variable genes with log-normalised expression. Gene values between 0.0125 and 3, and with a dispersion of at least 0.5, were considered variable.
As the data came from three different samples, we adopted a strategy called “Harmony” (version 0.99.9, https://github.com/immunogenomics/Harmony) to eliminate the batch effect affecting downstream analysis. Subsequently, two thousand highly variable genes for human data were identified and then principle component analysis (PCA) was performed with the function RunPCA based on these variable genes. PCs 1–20 (identified as significant by the JackStraw procedure) were selected for t-distributed stochastic neighbour embedding and uniform manifold approximation and projection (UMAP). We then used the function FindClusters to define cell clusters and classified them into 20 clusters for human adrenal cells. Differentially expressed genes (DEGs) for each cluster were compared to all remaining cell clusters via the function FindAllMarkers (Table S3).
2.6 Pseudotime analysis of three main adrenocortical cell subgroups with Monocle 2
The differentiation trajectories of human adrenocortical cell were performed with the Monocle 2 R package (http://cole-trapnell-lab.github.io/monocle-release/docs/; version 2.12.0). Briefly, three main adrenocortical cell subgroups (zG, zF, and zR cells) from the UMAP plot were derived from Seurat and then imported into Monocle 2. We selected only genes that were expressed in more than 5% of cells for pseudotime calculation. For ordering, we only kept the top 1000 significantly DEGs with the highest adjusted p value and performed discriminative dimensionality reduction through the DDRTree method. Additionally, we identified genes with a variable expression pattern that changed as a function of pseudotime using the differentialGeneTest function. We also visualised the top 100 pseudotime-dependent genes according to the plot_pseudotime_heatmap function.
2.7 Extraction of RNA and RT-qPCR
Total RNA was extracted from the six human adrenal tissues using Hipure Universal miRNA kit (Magen) in accordance with the manufacture's instruction. The reverse transcription was carried out with PrimeScriptTM RT reagent Kit with gDNA Eraser (Takara). The RT product and primer pairs (Table S4) were mixed with FastStart Essential DNA Green Master (Roche) and PCR was performed using the LightCycler 96 according to the manufacturer's protocol (Roche). The production of the amplicon was measured by SYBR green fluorescence and the threshold cycle (Ct) values were calculated. Ct values obtained were normalized to Ct values for glyceraldehyde-3-phosphate dehydrogenase gene.
3 RESULTS
3.1 Single-cell transcriptional profiling of adult human adrenal cells
We performed droplet-based single-cell RNA-seq of three human adrenal glands with a confirmed normal histological pattern (Figure S1a–c). The study design is shown in Figure 1a. From a total of 19,261 cells, with a median of 613–1058 genes/cell sequenced from the samples, 14,481 high-quality cells passed quality control and were retained for downstream analysis (Figure S2a,b and Table S2).
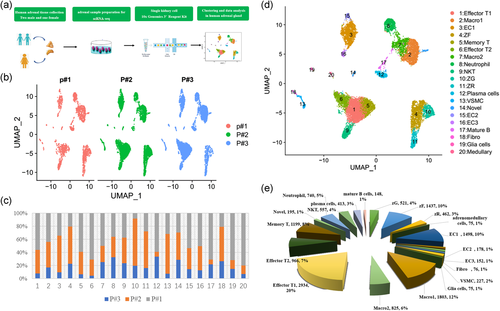
After eliminating the batch effect with “Harmony,” the UMAP plot and stacked barplots for the distribution of three human samples illustrated a good correlation and only a minor variation in the homogeneity among the three samples based on the donor origin (Figure 1b,c and Figure S2c). The average expression of genes also showed a good Pearson correlation and maintained high homogeneity (Figure S2d).
Finally, 20 human adrenal cells clusters were obtained, and then based on the known cell-specific markers (Table 1), we identified each cell cluster to the corresponding cell type (Figure 1d). The cell type composition of human adrenal cell types was seen in (Figure 1e).
| Cell type | Marker genes | References |
|---|---|---|
| adrenocortical cell | STAR, CYP21A2, HSD3B2 | Bergman et al. (2017) |
| zG cell | CYP11B2 | Nishimoto et al. (2010) |
| zF cell | CYP11B1 | Nishimoto et al. (2010) |
| zR cell | SULT2A1, CYB5A | Rainey and Nakamura (2008) |
| Adrenomedullary cell | PNMT, TH, CHGA | Goldstein et al. (1972); Santana et al. (2012) |
| Endothelial cell | CDH5, TM4SF1, PECAM1 | Kalluri et al. (2019); Ren et al. (2015); Sauteur et al. (2014), Shih et al. (2009) |
| Fibroblasts | LUM, COL1A1, COL1A2 | Iwano et al. (2002); Kalluri et al. (2019); Varga et al. (1987) |
| VSMC | MYH11, ACTA2, TAGLN | Kalluri et al. (2019) |
| Macrophages | CD68, CD163, VSIG4 | Lavin et al. (2014); Helmy et al. (2006) |
| T cells | CD3D, CD3E, CD8A, TRAC1, CD69 | Arazi et al. (2019); Chen et al. (2018); Peng et al. (2019) |
| NK cell | GZMB, GNLY, KLRF1 | Arazi et al. (2019); Chen et al. (2018) |
| B cell | CD79A, CD79B, MZB1, IGHG2, MS4A1 CD27 | Andreani et al. (2018); Anolik et al. (2003); Baker et al. (2017); Korkolopoulou et al. (1994); Nutt et al. (2015) |
| Neutrophil | SI00A8, SI00A9, | Arazi et al. (2019) |
| Glia cell | SPP1, PLP1, CRYAB | Kuipers et al. (2017); Nevin et al. (2017) |
- Abbreviations: NK, natural killer; VSMC, vascular smooth muscle cells; zF, zona fasciculata; zG, zona glomerulosa; zR, zona reticularis.
3.2 Pseudotime analysis of the adrenocortical cells
Previous reports (Pihlajoki et al., 2015; Vinson, 2016) showed that adrenocortical cells arise in the outer part of the gland and migrate centripetally from zG through zF to zR, with changes in the phenotype. We performed pseudotime trajectory with Monocle 2 to analyse the differentiation trajectories of human adrenocortical cells.
Based on adrenocortical cell markers (Bergman et al., 2017), we identified Clusters 4, 10, and 11 as adrenocortical cells. To distinguish the three adrenocortical subgroups in more detail, we separated them with the Subset function in Seurat. According to the specific marker genes (Figure 2a), we defined Cluster 11 as zR-like cells because they expressed high levels of SULT2A1 (Rainey & Nakamura, 2008) and CYB5A (Rainey & Nakamura, 2008). Based the expression CYP11B1 (Nishimoto et al., 2010) Cluster 4 was identified as zF-like cells. Cluster 10 was identified as zG-like cells as the highly expressed CYP11B2 (Nishimoto et al., 2010) and not expressed CYP11B1 and SULT2A1.
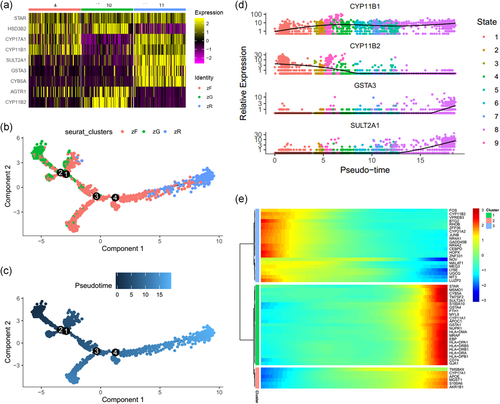
We selected three adrenocortical cell subgroups (zG, zF, and zR cells) included 2433 cells. Pseudotime analysis showed that the states and relationships among these adrenocortical cells (Figure 2b,c). Additionally, the pseudotime expression changes for CYP11B2, SULT2A1, CYP11B1, and GSTA3 were similar to the trajectory analysis (Figure 2d). Together, these results are consistent with the centripetal migration order of adrenocortical cells. To further analyze the genes in terms of pseudotime changes, we clustered genes via a pseudotemporal expression pattern. The top 50 genes that varied as a function of pseudotime were clustered, as shown by the heat map (Figure 2e).
3.3 Various types of immune cells were identified in adrenal microenvironment
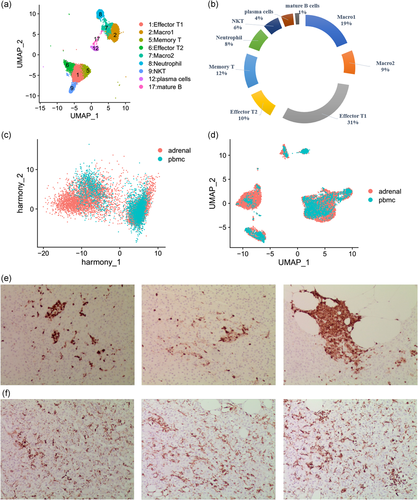
within the adrenal microenvironment, various immune cells reside in both the adrenal cortex and medulla and act directly or by cross-talk with others. This crosstalk plays a crucial role in the regulation of adrenal homeostasis and the stress reaction. However, the phenotype, frequency and identity of adrenal immune cells is largely unknown. Using scRNA-seq analysis, an important goal of our study was to explore the immune cell populations in the adrenal microenvironment to expand the current knowledge. Within the immune cell clusters of our sequencing data, we identified T cells, macrophages, natural killer T cells, neutrophil and B cells. T cells and macrophages were the main components among these immune cells (Figure 3a,b).
Using markers of macrophage including CD68 (Lavin et al., 2014) CD163 (Lavin et al., 2014), and VISG (Helmy et al., 2006) (Table 1), clustering analysis of immune cells identified two distinct macrophage subpopulations. Subsequently, to distinguish cellular functions that differ among two macrophage subgroups, Gene Ontology (GO) analyses were performed with the top 50 DEGs for each macrophage subpopulation via online software, Metascape (http://metascape.org/gp/index.html). The top GO term staphylococcus aureus infection was highest in macrophage population 2, a finding that suggests these cells have an inflammatory properties function. Whereas, parsing the file for indicators of macrophage-population-1-related GO terms revealed leucocyte activation involved in immune response (Figure S3a,b).
In addition, within these T subpopulations, we identified three clusters of CD8+ T cells (Clusters 1, 5, 6). Within the Cluster 5, cells show enriched expression of IL7R and KLF2, which is a marker enriched in memory T cells (Arazi et al., 2019; Peng et al., 2019) Moreover, this cell cluster do not or lower enrichment expression of GZMA, GZMH, and GZMK, markers of effector T cells, which pointing to this cluster as memory T cells. Meanwhile, other two CD8+ T cell clusters shared enriched expression of genes associated with effector T cells (Arazi et al., 2019; Peng et al., 2019), including GZMA, GZMH, and GZMK, indicating the predominant cell in these subgroups as the effector T cells (Figure S3c).
To characterize these immune cells, we performed harmony and UAMP analyses to contrast them with the peripheral blood mononuclear cells (PBMC) from a healthy donor (data from https://support.10xgenomics.com/single-cell-gene-expression/datasets). After mitigating the batch effect with the “Harmony,” the immune cells in the adrenal gland were overlap from those in the PBMC (Figure 3c,d). In addition, The Immunohistochemical expression of CD45 and CD68 in three human adrenal sequenced samples, do not exclude the possibility that samples infiltrated by inflammation (Figure 3e,f).
3.4 Immune activation of nonimmune cells in the adrenal endothelial cells
In our adrenal data, we identified three clusters of endothelial cells (Clusters 3, 15, 16) with enriched expression of markers PECAM1 (CD31) (Ren et al., 2015), CDH5 (Kalluri et al., 2019; Sauteur et al., 2014), and TM4SF1 (Shih et al., 2009; Zukauskas et al., 2011) (Figure 4a and Table 1).
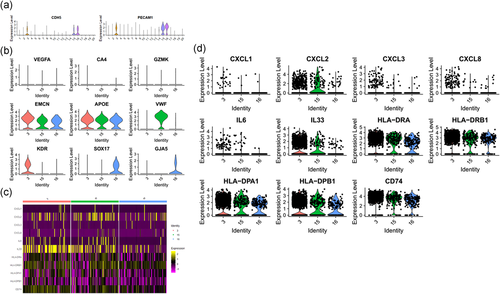
Within these EC subpopulations, we identified two clusters of artery-venous EC cells (Clusters 3 and 16) and one clusters of venous EC cells (Cluster 15). All three EC cell clusters do not or lower enrichment expression of capillary cells markers (VEGFA, CA4, and GZMK). Within the Cluster 15, cells show enriched expression of EMCN, VWF, and APOE, which is a marker enriched in venous EC cells. Moreover, this cell cluster does not enrichment expression of artery EC cells markers KDR, SOX17, and GJA5, indicating the cell cluster as the venous EC cells. Meanwhile, Clusters 3 and 16 were identified as the artery-venous EC cells as they both shared enriched expression of artery EC cells and venous EC cells markers (Chavkin & Hirschi, 2020; dela Paz & D'Amore, 2009; Kalucka et al., 2020; Vanlandewijck et al., 2018) (Figure 4b).
Notably, we identified endothelial cell populations that express MHC Class II genes such as HLA-DPA1 and HLA-DRA (Figure 4c), which indicated the existence of antigen-presenting endothelial cells in the adult human adrenal gland. This professional antigen-presenting signature indicates potential immune function of endothelial cells. However, without providing protein data, such statement is just suggestion.
3.5 Sex-related diversity in the adrenocortical cells at single-cell resolution
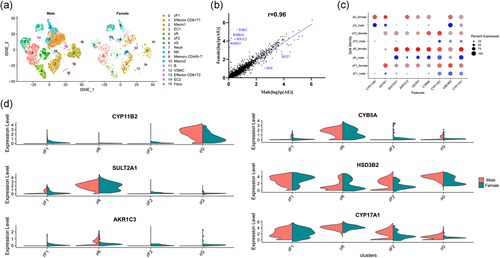
To compare the sex-related diversity in the adrenocortical cells, we analyzed the scRNA-sequencing profiles from female donor #1 and male donor #2 because both them seem to have similar age and sampling size. The cell cluster composition by sex differences is illustrated (Figure 5a). A high correlation was observed between the male and female data sets based on the average expression level per gene (correlation coefficient was 0.96) (Figure 5b). Some genes were expressed differently. For example, IGKC, IGHG4 IGLC2, and IGHG1 were highly expressed in female adrenal cells but lower in male. Consistently, the expression level and the percentage of cells expressing the key adrenal steroidogenic genes (e.g., SULT2A1, CYP11B1, and CYP17A2) were similar (Figure 5c,d), which also indicated that most of the male and female adrenal cells were relatively well correlated.
3.6 Comparison of expression profiles between the left and right adrenal gland at single-cell resolution
The left and right adrenal gland are semilunar and triangular, respectively. Given the different morphology between bilateral adrenal glands, whether there were also different at single-cell resolution. To compare the similarities and variations, we analyzed the scRNA-sequencing profiles from the right adrenal gland (P#1 and P#2) and left adrenal gland (P#3). we also adopted the ‘Harmony' to eliminate the batch effect affecting downstream analysis.
Most of the left and right adrenal cells were also relatively well correlated (Figure 6a,b and Table S5). Interestingly, this analysis revealed some variations (Figure 6c,d). For example, both the expression level and the percentage of cells expressing special genes CYP11B2 were higher in the right than in left adrenal gland, which indicated the ability related to aldosterone synthesis and secretion between the left and right adrenal cells may be different. Additionally, the special genes of the adrenomedullary cells as PNMT and TH were also various between the left and right adrenal glands, which indicated the ability in the response to stress may be various.
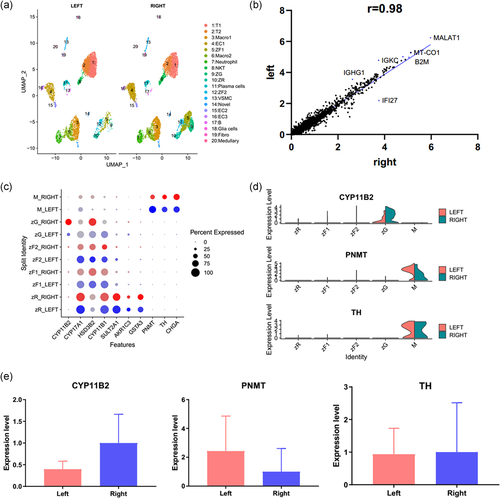
To perform in-depth analysis, we selected CYP11B2, PNMT and TH for qPCR analysis (Figure 6e). We found the average expression level of CYP11B2 was higher in right adrenal gland than left. PNMT expressed higher level in left than in right. Unfortunately, no significant statistical difference was observed as the small sample sizes. More samples in our future studies needed to confirm the reliability of the results. Nonetheless, these clues provided a decision approach for clinical urologist surgeons in cope with bilateral adrenal diseases.
3.7 The expression levels of circadian rhythms genes in the adrenocortical cells between the left and right adrenal gland
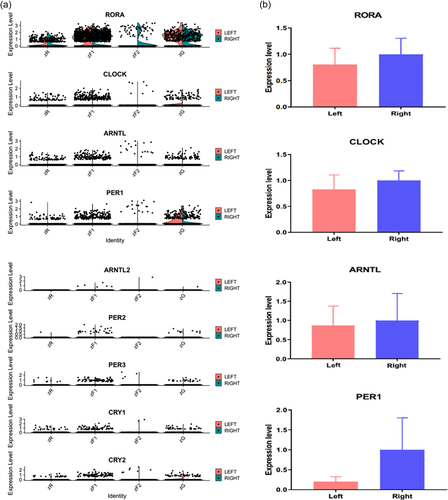
There is a central and peripheral circadian clock adjusting the physiologically relevant rhythms in most organisms. What about the expression of these rhythmic genes between the left and right adrenal glands at single-cell resolution. We analyzed the expression of these rhythmic genes between the left and right adrenal glands in human adrenocortical cells (Figure 7a). We also selected RORA, CLOCK, ARNTL, and PER1 for qPCR analysis to find the difference between left and right adrenal glands in human (Figure 7b). However, no significant statistical difference was observed as the small sample sizes.
4 DISCUSSION
In our scRNA-seq data, we revealed five different types of immune cells in human adrenal gland. Macrophages and T lymphocytes comprised the majority. Immune cells appear to constitute a high proportion of transcripts in most organs that have been studied, and resident T cells and macrophages are to be expected that differ in phenotype from their circulating counterparts. Whether the adrenal conditions immune cells to return to systemic circulation, via lymph or blood, is an interesting notion needed future study. In fact, the immune-adrenal interactions within the adrenal microenvironment play an important role in health, disease pathophysiology and regeneration (Kanczkowski et al., 2015, 2017). Many immune cells, including T cells, macrophages and neutrophils, stay in direct cell–cell contact with adrenal and endothelial cells, as observed via electron microscopic analysis. These immune cells are involved in phagocytosis, secretion of cytokines and chemokines and wound repair during different conditions (Kanczkowski et al., 2015). Interestingly, our data identified two macrophage subpopulations, each with marker genes and unique functional pathways, in the human adrenal gland. The role of macrophages in the human adrenal gland, and how macrophages contribute to adrenal regeneration and development of adrenal disease, is a topic of ongoing discussion. Thus, the characterizations of these macrophages provide a valuable framework for future research.
Our scRNA-Seq revealed a glia-like multipotent cell cluster (Cluster 19). Within the Cluster 19, cells showed enriched expression of CRYAB, S100B, SPP1, and PLP1, which were associated with increased severity of demyelination of astrocytes or oligodendrocyte in human brain (Kuipers et al., 2017; Nevin et al., 2017). After a comparison of previous reports (Rubin de Celis et al., 2015), we found the cell population in our data might be glial cells in the adrenal medulla and most probably some progenitors. In previous reports, Rubin de Celis et al. (2015) show that a defined pool of glia-like nestin–expressing progenitor cells that having features of coexpression of nestin–GFP and S100b in the adult adrenal medulla. These glia-like cells are multipotent and involved in the gland's response and adaptation to long-term stress. In addition to the glial lineage, these glia-like cells also differentiated into two major lineages relevant to adrenal function, chromaffin cells and neurons. In addition, our scRNA-Seq also revealed immune activation of nonimmune cells in the adrenal endothelial cells (Clusters 3, 15, 16). These endothelial cell populations expressed MHC Class II genes such as HLA-DPA1 and HLA-DRA, which indicated the existence of antigen-presenting endothelial cells in the adult human adrenal gland. This professional antigen-presenting signature indicates potential immune function of endothelial cells. In addition, without providing protein data, such statement is just suggestion. However, what is the function of these special cell types and the physiological, pathological and clinical significance need our further study.
As expected, the adrenal gland is also a peripheral clock and under the control of the circadian clock on many aspects of metabolism and behavior (Spiga et al., 2014). A functional biological clock at the cellular level is vital to steroid synthesis and secretion with the characteristics of biological rhythms in adrenal gland. For example, clock genes regulate mineralocorticoid production within ZG through the rate-limiting synthetic enzymes. Under the control of central clock in the suprachiasmatic nucleus, the ZF secretes glucocorticoid hormones into the systemic circulation (Doi et al., 2010; Ishida et al., 2005). Our scRNA-sequencing data expanded the current understanding of rhythmic genes expressed in adrenal gland at single-cell resolution. To find the difference of expression of these rhythmic genes between the left and right adrenal gland, we performed qPCR analysis these genes in human. However, no significant statistical difference was observed as the small sample sizes.
In our scRNA-seq data, we get relatively few adrenal chromaffin cells. During our experiment, we used the enzyme digestion to obtain adrenal single cells, we found that the sensitivity of adrenal cells to enzyme is different. The adrenal chromaffin cells secrete stress-related hormones (e.g., adrenaline and noradrenaline) and the cells are highly sensitive to enzymes. This points to conclusion that the isolation protocol used in our study is not optimised. A common drawback in our study is high number of immune cell populations detected and low percentage of chromaffin cells. This is a cofounding factor especially regarding the creation of the cellular atlas. Therefore, the optimised isolation protocol requires our further study.
Together, our study represents the comprehensive description of distinct cell populations in the human adrenal gland. The single-cell description of the adrenal gland contributes to the understanding of the cellular basis of human adrenal function and provides a map of the baseline adrenal cellular network. Additionally, it provides clues for the development of novel cell-based approaches to prevent and treat adrenal disease.
ACKNOWLEDGMENTS
This work was supported by grants from the National Key R&D Program of China (2017YFC0908000), Guangxi key Laboratory for Genomic and Personalized Medicine (16-380-54, 17-259-45, 19-050-22, 19-185-33, 20-065-33), the Guangxi Health Department Scientific Research Program (Z20180483) and the Youth Science Foundation of Guangxi Medical University (GXMUYSF201708, GXMUYSF201810).
CONFLICT OF INTERESTS
The authors declare that there are no conflict of interests.
AUTHOR CONTRIBUTIONS
Lin Huang: performed scRNA-seq experiments and analyses, made figures, and wrote the paper. Jinling Liao: dissected human adrenal tissues, performed RNA-seq experiments, and performed immunohistochemistry. Yang Chen: performed scRNA-seq analyses and wrote the paper. Chunlin Zou: dissected mouse adrenal tissues. Linjian Mo, Tianyu Li, and Qinyun Zhang: provided and dissected human adrenal tissue. Yanyu Zeng, Mengying Bao, and Fangxing Zhang: performed immunohistochemistry and qPCR. Haiying Zhang, Zhanbin Yang, Xiaobo Yang, and Yu Ye: critically discussed the draft paper. Zengnan Mo and Jiwen Cheng: conceived of and supervised the project, analyzed data, made figures, and wrote the paper; all authors read the manuscript.
Open Research
DATA AVAILABILITY STATEMENT
The raw data that support the findings of this study are available from the corresponding author upon reasonable request.


