Rapid responses of adipocytes to iron overload increase serum TG level by decreasing adiponectin
Yuxiao Tang, Dongyao Wang, Hongwei Zhang, and Yinyin Zhang contributed equally to this study.
Abstract
Iron overload is tightly connected with metabolic disorders. Excess iron in the adipose and its roles in dyslipidemia are of interest to be identified. In acute iron overload mice receiving intraperitoneal injection of 100 mg/kg/day dextran-iron for 5 days, the epididymis adipose showed a remarkable increase in iron. Serum triglyceride and low-density lipoprotein cholesterol (LDL-C) levels were increased and high-density lipoprotein cholesterol (HDL-C) level was decreased, while serum alkaline phosphatase, aspartate aminotransferase, glucose, and insulin were not affected. The serum-cytokine-microarray showed that adipocytokines, including adiponectin, leptin, and resistin were significantly decreased. Other serum cytokines, including pro-insulin cytokines, inflammatory cytokines, chemokines, and growth factors were not changed, except that ghrelin and chemokine RANTES were increased. Iron overload decreased expressions of adiponectin and leptin both in vivo and in vitro. Intraperitoneal injection of recombinant leptin at 1 μg/g in acute iron overload mice had no significant effects on serum levels of TC, TG, HDL-C, and LDL-C, while intraperitoneal injection of recombinant adiponectin at 3 μg/g partially restored serum TG level through improving activities of lipoprotein lipase and hepatic lipase, but abnormal serum LDL-C and HDL-C were not redressed, suggesting other mechanisms also existed. In conclusion, the adipose responds to iron overload at an early stage to interfere with lipid metabolism by secreting adipocytokines, which may further affect glucose metabolism, inflammation, and other iron overload-induced effects on the body.
1 INTRODUCTION
The trace element iron impacts on many biological processes in the body. Iron overload is tightly connected to metabolic disorders as that iron accumulates in the liver, the adipose, the heart, and the brain due to metabolic diseases (He et al., 2011; H. Li, et al., 2017; Orr et al., 2014; Sachinidis et al., 2020; X. Zheng et al., 2011). On the other hand, iron overload itself is proved to disturb the metabolism, especially the lipid metabolism, showing dyslipidemia in human and experimental animals (Marques et al., 2019; Solanas-Barca et al., 2009). The liver is deemed to be responsible for the abnormal lipid metabolism induced by iron overload because it regulates lipid metabolism and the excess iron mainly deposits in it (Ahmed et al., 2012). Nevertheless, the emerging roles of adipose tissue in lipid metabolism and the accumulation of iron in adipocytes (J. Zheng et al., 2018) suggest there is a link connecting iron overload and dyslipidemia to adipocytes.
The adipose tissue is now recognized far beyond storing lipid but widely participating in various biological and pathological responses ranging from glucolipid metabolism to energy control, to metabolic syndrome, and to immune responses through secreting more than 50 cytokines into blood (Saxton et al., 2019). Among these, adipocyte-specifically secreting adipocytokines, adiponectin, leptin, and resistin, are negatively correlated with iron overload and exert pivotal roles in glucolipid metabolism. It has been reported by the same group that iron regulates adiponectin and leptin, thus regulating insulin sensitivity and food intake (Gabrielsen et al., 2012; Gao et al., 2015). The insulin resistance induced by iron overload through resistin is also suggested by evidence from dietary iron overload mice models (Dongiovanni et al., 2013). However, the roles of adipocytokines, especially adiponectin, in iron overload-induced abnormal lipid metabolism needs to be identified.
Here, we reported that excess iron significantly accumulated in the adipocytes and led to hyperlipidemia in acute iron overload mice. Serum levels of 20 cytokines, including adipocytokines, insulin-related cytokines, inflammatory cytokines, growth factors, and chemokines were analyzed by a cytokine microarray. Effects of iron overload on the expressions of adipocytokines in adipocytes were observed. At last, roles of adiponectin and mechanisms underlying iron overload-induced hyperlipidemia were determined in the acute iron overload mice with adiponectin treatment.
2 MATERIAL AND METHODS
2.1 Animal experiments
Animal experiments were under the approval of the Animal Care and Use Committee of the Second Military Medicine University. Guidelines and Policies on using and caring of the laboratory animals were followed all time. C57/BL6 mouse (20 ± 2 g body weight, 7–8 weeks old) were purchased from the Slac Laboratory Animal (Shanghai, China) and were reared in the SPF environment in the Animal Center of the Second Military Medicine University. The acute iron overload (IO) mouse model was constructed by intraperitoneal injection of 100 mg/kg/day dextran-iron for 5 days (n = 10). The mice in the Control group (Con, n = 10) were injected with an equal volume of sterile saline. The adiponectin treatment was performed by intraperitoneal injection of recombinant adiponectin (Cat. 5095-AC-050, R&D Systems) at 3 μg/g along with the injection of dextran-iron at Day 2 and Day 4 (n = 10). The leptin treatment was performed by intraperitoneal injection of recombinant leptin (Cat. 450-31, PeproTech) at 1 μg/g along with the injection of dextran-iron at Day 2 and Day 4 (n = 10). The status of mice was monitored and body weight and food consumption were weighted. After treatment, mice were anesthetized and blood was collected. Then the liver and the epididymis adipose were collected after perfused by sterile saline through the heart.
2.2 Iron indicators
The serum iron concentration, serum transferrin binding capacity (TIBC), and serum transferrin saturation (TS) were determined by the Hitachi 7600 Automatic Biochemical Analyzer (Hitachi). The iron contents of the liver and the adipose were determined by a flame atomic absorption spectrophotometer (Hitachi) as previously reported (Y. Tang et al., 2019). Prussian blue staining of the adipose slices and the liver slices were performed to observe iron accumulation in the adipose and in the liver.
2.3 Serum biochemical parameters
The fasting levels of blood glucose, serum triglyceride (TG), serum total cholesterol (TC), serum high-density lipoprotein cholesterol (HDL-C), and low-density lipoprotein cholesterol (LDL-C) were measured by the automatic biochemical analyzer (Hitachi).
2.4 Serum cytokines
The serum concentrations of 20 cytokines, adiponectin, leptin, ghrelin, resistin, GIP, GLP-1, PAI-1, IL-1, IL-2, IL-6, IL-10, IL-12, IL-15, IFN-γ, TNF-α, MCP-1, RANTES, FGF, VEGF, and PDGF were measured by a customized cytokines microarray (Bio-Plex® Multiplex Immunoassay System, Bio-Rad). The serum insulin concentration was determined by the Insulin Mouse Enzyme-linked Immunosorbent Assay (ELISA) Kit (Cat. EMINS, Invitrogen). Serum adiponectin and leptin levels and concentrations in the cell medium were determined by commercial ELISA kits following the protocols (Cat. ab108785 & ab100718; Abcam).
2.5 Cells and interventions
3T3-L1 cells (ATCC® CL-173) were maintained in high-glucose Dulbecco's modified Eagle's medium (DMEM) supplemented with 10% fetal bovine serum (FBS; Gibco). Cells were cultured in differentiation media I (DMEM, 10% FBS, 1 μg/ml insulin, 0.25 μg/ml dexamethasone, 0.5 mM IBMX [Cat. HY-12318; MCE]) for 72 h, followed by differentiation media II (DMEM, 10% FBS, 1 μg/ml insulin) for 48 h, to induce the differentiation to adipocytes. Iron overload in cells was performed by adding the different ratios of mixtures of apo-transferrin and holo-transferrin (0%, 25%, 50%, 75%, and 100%, Cat. 616424 & 616419; Merck Millipore) to the 3T3-L1-derived adipocytes at a total transferrin concentration of 30 μM. Besides, iron sulfate was also used at concentrations ranging from 0 to 100 μM. Cells were treated for 24 h for detection. FBS was removed before the treatment to exclude the influences of serum transferrin and other factors. Cell viabilities were determined by a commercial Cell Counting Kit-8 (Cat. KGA317, Keygene Biotech).
2.6 Real-time PCR
RNA was extracted from cells or tissues by using Trizol reagent (Cat. 15596-026; Invitrogen). 1 μg RNA was reverse-transcribed by using the PrimeScript™ RT Master Mix (Cat. RR037A, Takara, Japan). Real-time quantitative polymerase chain reaction was performed by the SYBR Green Kit (Cat. QPK201; Toyobo Bio Inc.) using the StepOnePlus system (Applied Biosystems) (Li et al., 2020). The expressions of target genes were normalized by internal reference 18S. The sequences of primers were: mmu-Leptin: F:5′-GCCCAGCAACATTATCCAGT-3′, R:5′-AGCCCTTTCTCAAAGGCTTC-3′; mmu-Adiponectin:F:5′GCAAGCTCTCCTGTTCCTCTTAATC-3′, R:5′-TGCATCTCCTTTCTCTCCCTTCTC-3′. mmu-TFRC: F:5′-TGGGTCTAAGTCTACAGTGGC-3′, R:5′-AGATACATAGGGCGACAGGAA −3′.
2.7 Western blot
Whole proteins were extracted by the total protein extraction kit (Cat. C510003; Sangon Biotech). Western blot assays were performed and analyzed as before (Y. Tang et al., 2020). For native gel electrophoresis, total proteins were mixed with native gel sample loading buffer (Cat. P0016N; Beyotime Biotechnology) and electrophoresed in Hepes-polyacrylamide gel with Hepes electrophoresis buffer. The procedures of transmembrane, incubation, and scan were same as sodium dodecyl sulfate-phage gel electrophoresis. Antibodies used in this study were: adiponectin (Cat. 66239-1-Ig; Proteintech), fatty acid synthase (FAS; Cat. ab22759; Abcam); acetyl coA carboxylase (ACC; Cat. ab45174, Abcam); phospho-ACC (Cat. ab68191; Abcam); and β-actin (Cat. D110001; Sangon Biotech). The IRDye® secondary antibody (LI-COR) was used and immunoblots were scanned by Odyssey® dual-color infrared fluorescence imaging system.
2.8 Immunohistochemistry
The liver tissues, preperfused by 0.9% NaCl, were fixed in 4% paraformaldehyde overnight and embedded in paraffin. The slices were dewaxed, repaired for antigen in antigen repair buffer (Cat. C1032; Solarbio Science & Technology), blocked by Normal Donkey Serum (Cat. ab7475; Abcam), and incubated by F4/80 antibodies (1:200, Cat. ab111101; Abcam) and secondary antibodies (Cat. ab205718; Abcam). After 3ʹ-diaminobenzidine staining, the nuclei were stained by hematoxylin (Sangon Biotech). The images of all slices were taken by an inverted fluorescence microscope (Leica).
2.9 Serum LPL and HL activities
The mice were injected with heparin at 100 IU/kg 15 min before anesthesia to release lipoprotein lipase (LPL) and hepatic lipase (HL) from endotheliocyte into blood (Beck et al., 2018). The LPL and HL activities were determined by using Lipoprotein lipase and Hepatic Lipase assay kits (Cat. BC2440 & BC2380; Solarbio Life Sciences).
2.10 Statistics
Data were presented as mean ± SD and plotted by GraphPad Prism 7. The t-test was used for two-group comparisons if the data obeyed the normal distribution, and the Mann–Whitney test was used if not. The one-way analysis of variance was used for multigroup comparison, and the Kruskal-Wallis test was used for multigroup comparisons if the data did not obey the normal distribution.
3 RESULTS
3.1 Acute iron overload accumulated in the adipose and induced dyslipidemia in mice
Mice in the iron overload group (IO) receiving 100 mg/kg/day intraperitoneal injection of dextran-iron for 5 days showed increased serum iron level (Table S1). The serum transferrin binding capacity (TIBC) and serum transferrin saturation (TS) were increased as well (Table S1). The bodyweights of mice showed no statistical difference between the Control group and the IO group. The epididymis adipose nearly had no iron in normal mice but in acute iron overload mice, iron was significantly deposited in the epididymis adipose, as indicated by Prussian blue staining (Figure 1a). The liver also had obvious iron accumulation (Figure 1a). The determinations of iron content in the liver (Figure 1b) and the epididymis adipose (Figure 1c) showed that iron content in the adipose increased remarkably, as it only increased about three times in the liver, although the absolute quantitation was still much lower.
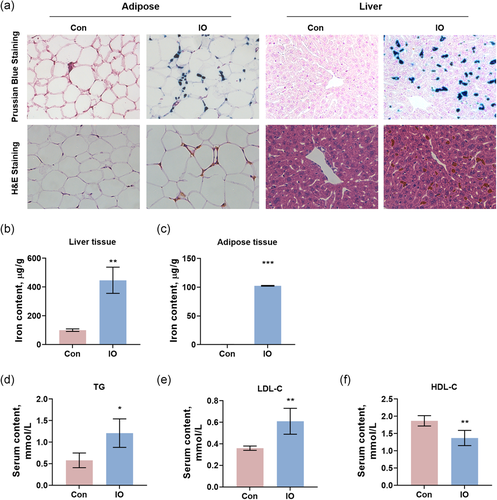
Interestingly, lipid metabolism was disturbed by acute iron overload while glucose metabolism had not been affected yet. Serum levels of triglyceride (TG; Figure 1d) and low-density lipoprotein cholesterol (LDL-C; Figure 1e) were increased by acute iron overload. High-density lipoprotein cholesterol (HDL-C; Figure 1f) was decreased. The blood glucose and the insulin level were not changed. Serum levels of alkaline phosphatase (ALT) and aspartate aminotransferase (AST), as well as total cholesterol, were not changed either (Table S1), suggesting the liver had not yet injured by the acute iron overload.
3.2 Early alterations of adipocytokines in acute iron overload mice
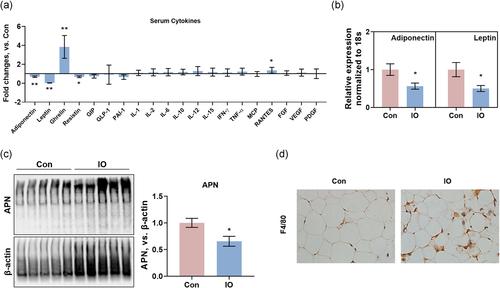
The deposit of iron in adipocytes intrigued us to investigate the roles of adipocytes in iron overload-induced hyperlipidemia. The 20-cytokines-microarray, including adipocytokines, pro-insulin cytokines, inflammatory cytokines, growth factors, and chemokines, showed that adipocytokines (adiponectin, leptin, and resistin) were significantly decreased by acute iron overload (Figure 2a). Messenger RNA (mRNA) expressions of adiponectin and leptin in the adipose were decreased (Figure 2b), suggesting that acute iron overload directly decreases the synthesis of adiponectin and leptin. Moreover, since the oligomerizations of adiponectin are also thought to be critical in pathophysiology, we performed native gel electrophoresis of adiponectin and observed that acute iron overload reduced oligomerization of adiponectin in the adipose (Figure 2c). Ghrelin, the corresponding hormone to leptin (Cui et al., 2017) was increased and the chemokine RANTES was slightly increased (Figure 2a, Table S2). The pro-insulin cytokines glucose-dependent insulinotropic peptide (GIP) and glucagon-like peptide-1 (GLP-1) (Samms et al., 2020), the inflammatory cytokines IL-1, IL-2, IL-6, IL-10, IL-12, IL-15, IFN-γ, TNF-α, the chemokine MCP, the growth factors VEGF, FGF, PDGF, and PAI-1 were not significantly changed by acute iron overload. However, most of inflammatory cytokines and chemokines were increased in iron-overload group (Figure 2a). The H&E staining and immunohistochemical staining of F4/80 also showed a remarkable infiltration of macrophages (Figures 1a and 2d), suggesting an inflammatory infiltrate in adipose tissue after the dextran-iron injection, in line with our previous finding that iron overload recruits macrophages in the liver (M. Li, Tang, et al., 2017). Together with the results of serum levels of glucose, insulin, ALT, and AST, the lipid disorders resulted from decreases of adipocytokines might be the early stage among all the effects of iron overload on the body.
3.3 Iron overload decreased the secretions of adiponectin and leptin from adipocytes
To confirm that the decreased serum levels of adiponectin and leptin were induced by iron overload in adipocytes, effects of two kinds of iron, transferrin-bound iron and non-transferrin-bound iron (FeSO4), on expressions and secretions of adiponectin and leptin were determined in vitro. 3T3-L1 cells were differentiated to adipocytes (Figure 3a, detailed procedures described in Section 2). A gradient transferrin saturation of iron (0, 25%, 50%, 75%, and 100%, total 30μM) and a gradient concentration of FeSO4 (0, 10, 50, 100 μM) were used. After treatment for 24 h, cell viabilities of the 3T3-L1-derived adipocytes were not affected by these different concentrations of iron (Figure 3b). Transferrin receptor 1 (TFRC) mRNA was decreased by transferrin-iron at saturation of 50%, 75%, and 100%. All 10, 50, and 100 μM of FeSO4 could decrease the TFRC mRNA expression, with a downtrend in the high concentration group (Figure 3c).
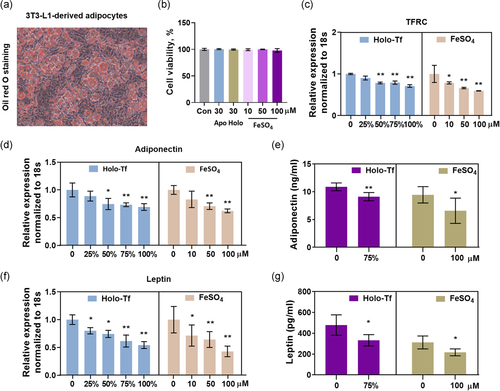
Iron overload decreased mRNA expression of adiponectin in 3T3-L1-derived adipocytes (Figure 3d). Adiponectin in the medium was decreased too (Figure 3e). The same effects were observed in leptin (Figure 3f,g), as a parallel control to adiponectin. These results revealed that decreases of serum adiponectin and leptin in acute iron overload mice resulted from iron overload-adipocytes.
3.4 Adiponectin ameliorated serum TG level induced by acute iron overload
Due to the key role of adiponectin in lipid metabolism, we reversed its serum level by intraperitoneal injection of recombinant adiponectin to observe its effects on hyperlipidemia in acute iron overload mice. Also, the effects of leptin treatment were determined. Serum iron content, TIBC, TS, and iron content in the adipose tissue confirmed the iron overload status in mice (Tables S3, S4, and Figure 4a). Serum content of adiponectin was increased, more than control, in iron overload mice received adiponectin injection (Figure 4b), and the decreased serum leptin was reversed by recombinant leptin injection (Figure 4c). Serum ALT and AST were not altered in both iron overload + adiponectin group and iron overload + leptin group (Tables S3 and S4), but serum glucose was decreased by adiponectin, in line with the report that adiponectin could effectively reduce the blood glucose level (Paulsen et al., 2019).
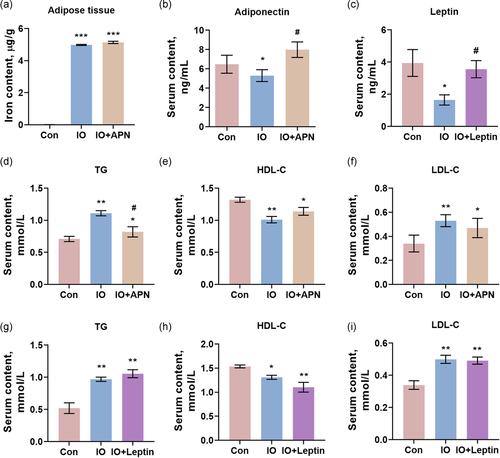
To our surprise, adiponectin only had a positive role in regulating serum TG level induced by acute iron overload (Figure 4d). The decrease of HDL-C (Figure 4e) and the increase of LDL-C (Figure 4f) were not significantly reversed by adiponectin, indicating that other mechanisms existed. The intervention of leptin showed no significant effects on serum lipid indicators of acute iron overload mice, including serum TG (Figure 4g), serum HDL-C (Figure 4h), serum LDL-C (Figure 4i), and serum TC (Table S4). Nevertheless, the mechanisms of adiponectin alleviating serum TG level were subsequently explored.
3.5 Adiponectin enhanced the activity of lipoprotein lipase and hepatic lipase to restore the serum TG level
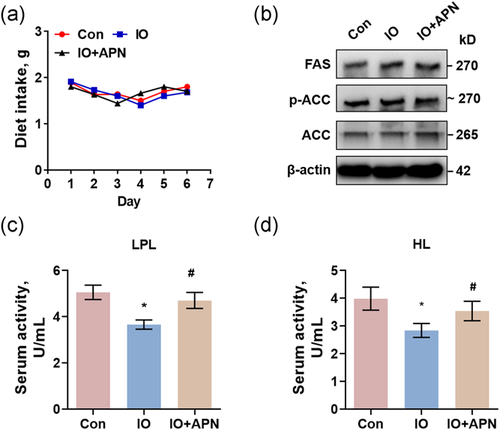
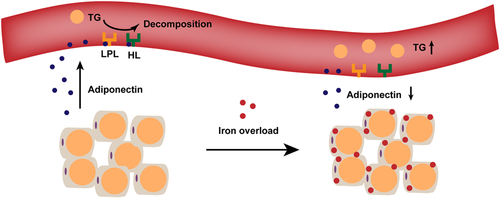
Serum TG level could be increased through (1) the increase of food intake; (2) the increase of its synthesis in the liver; and (3) the decrease of its decomposition. In mice with acute iron overload and iron overload with adiponectin injection, diet intake was not affected (Figure 5a). Besides, expressions of fatty acid synthase (FAS) and acetyl CoA carboxylase (ACC), the main TG synthetases in the liver (Jones, 2016), and the phosphorylation level of ACC were not changed by iron overload or adiponectin (Figure 5b). However, lipoprotein lipase and hepatic lipase, two enzymes responsible for serum TG decomposition (Jones, 2016), were inhibited by acute iron overload. The supplement of adiponectin effectively restored activities of lipoprotein lipase (Figure 5c), with same effects on plasma hepatic lipase (Figure 5d), suggesting that acute iron overload decreased adipocyte-secreting adiponectin to inhibit activities of lipoprotein lipase and hepatic lipase, leading to the decrease of TG decomposition and the increase of serum TG level (Figure 6).
4 DISCUSSION
In this study, we reported that acute iron overload in mice caused early responses of adipocytes. Lipid metabolism was rapidly disturbed, without changes in glucose metabolism, inflammatory responses, growth factors, and liver injuries. The liver storages excess iron by ferritin (C. Y. Wang & Babitt, 2019), which may increase its tolerance capacity to iron overload. This short-time (5 days) and weak iron overload (about 4 times than normal) did not injury the liver. The adipose tissue nearly had no iron in normal condition, but its iron level increased dramatically in acute iron overload mice. Therefore, adipocytes would be more sensitive to iron overload than hepatocytes. The rapid changes in adipocyte-specific cytokines indicated that adipocytes were influenced by acute iron overload.
The ability to transmit electron makes iron capable of producing hydroxyl free radical, inducing oxidative damages if excess. Besides, iron profoundly affects various cell signaling pathways by orchestrating gene expression and posttranslated protein modification (M. Li, Tang, et al., 2017; Y. Tang et al., 2020; Y. X. Tang et al., 2017), changing the viability, morphology, development, function, cycle, and even death of cells (Stockwell et al., 2017). The identical group reported that iron overload could directly decrease adiponectin and leptin expressions through transcription factor FOXO1 and CREB, respectively (Gabrielsen et al., 2012; Gao et al., 2015). In line with this, we observed that iron overload decreased expressions and secretions of adiponectin and leptin both in vivo and in vitro. However, other factors affecting their expressions including insulin, inflammatory cytokines, and growth factors were not altered (Gairolla et al., 2017; B. H. Liu et al., 2008). The increase of chemokine RANTES and infiltration of macrophages suggested that inflammatory responses start to be initiated (Mikolajczyk et al., 2016). These results showed that iron overload-induced decreases of adipocytokines and dyslipidemia were immediate responses of adipocytes, rather than stepwise responses of other disturbances.
Adiponectin is responsible for iron overload-induced abnormal glucose metabolism and insulin resistance, but its roles in iron overload-induced dyslipidemia are rarely focused, although adiponectin is deeply involved in lipid metabolism (Yanai & Yoshida, 2019). Clinical investigations revealed that patients with lipid disorders or diabetes show a significant decrease in circulation adiponectin (Yanai & Yoshida, 2019). Treatment of adiponectin in mouse model effectively alleviated the hyperlipemia, as well as the insulin resistance (Y. Liu et al., 2013). Adiponectin treatment in mice with dyslipidemia showed improvements in serum levels of TG, TC, LDL-C, and HDL-C (X. Wang et al., 2016; X. Wang et al., 2014). In this study, it is interesting that adiponectin treatment in acute iron overload mice only partially restored serum TG level, excluding LDL-C and HDL-C, suggesting that (1) iron overload increased serum TG level through decreasing adiponectin; (2) the recombinant adiponectin might not be fully functional; and (3) iron overload induced-dyslipidemia did not solely rely on adiponectin or adipocytes. The lipoprotein synthesis and transport in the liver may be responsible for the abnormalities of serum LDL-C and HDL-C induced by iron overload (Brunet et al., 1999).
Although leptin is decreased by acute iron overload, the food intake of mice showed no difference among groups of control, iron overload, and iron overload with adiponectin treatment, meaning that diet intake would not be the reason for increasing serum TG level. In fact, leptin treatment showed no significant improvements on abnormal serum lipid indicators of acute iron overload mice. In addition, FAS and ACC, two rate-limiting enzymes of TG synthesis in the liver (Jones, 2016), were not affected. However, activities of lipoprotein lipase and hepatic lipase were decreased by iron overload and restored by adiponectin treatment. These results suggest that iron overload increased serum TG level by decreasing adiponectin and inhibiting activities of lipoprotein lipase and hepatic lipase. Former research works have shown that adiponectin initiates the AMPK pathway and RhoA/ROCK-Mediated actin remodeling to increase lipoprotein lipase activity (Combs et al., 2004; Ganguly et al., 2011; Schindler et al., 2017). The mechanisms of adiponectin restoring hepatic lipase activity have not been disclosed yet. Nevertheless, due to the complicated roles of adiponectin in glucolipid metabolism, inflammatory processes, oxidative stress, obesity, insulin resistance, vascular function, and atherosclerosis (Esmaili et al., 2020), it, and the adipocytes, may be important to iron overload-induced effects. The subsequent roles of early decrease of adiponectin are also of interest to be explored.
In conclusion, our results highlighted the early responses of adipocytes to acute iron overload. The adipose tissue itself contributes to iron overload-induced dyslipidemia through decreasing adiponectin synthesis, inhibiting lipoprotein lipase and hepatic lipase activities, and increasing serum TG level (Figure 6). Meanwhile, other mechanisms also exist, since changes in lipoprotein could not be restored by adiponectin treatment. Thus, only application of adiponectin to intervene in iron overload-induced dyslipidemia may not succeed and the combined, effective measures need to be explored.
ACKNOWLEDGMENTS
This study was supported by the National Natural Science Foundation of China (31671236, to Min Li; 81903306, to Yuxiao Tang; 82003711, to Dongyao Wang), the Shanghai Sailing Program (19YF1459400, to Dongyao Wang), and the Shanghai Natural Science Foundation (19ZR1469700, to Yuxiao Tang).
CONFLICT OF INTERESTS
The authors declare that there are no conflict of interests.
AUTHOR CONTRIBUTIONS
Yuxiao Tang, Dongyao Wang, and Hongwei Zhang performed animal experiments and drafted the manuscript. Yinyin Zhang, Jie Wang, and Ruirui Qi performed cell experiments. Jianxin Yang and Hui Shen provided technical and material supports. Yuxiao Tang and Dongyao Wang analyzed and interpreted the experimental data. Yan Xu provided critical revision of the manuscript. Min Li proposed the study concept and designed this study.


