Human papillomavirus elevated genetic biomarker signature by statistical algorithm
Abstract
Head and neck squamous cell carcinoma (HNSCC) is the one of the most frequently found cancers in the world. The aim of the study was to find the genes responsible and enriched pathways associated with HNSCC using bioinformatics and survival analysis methods. A total of 646 patients with HNSCC based on clinical information were considered for the study. HNSCC samples were grouped according to the parameters (RFS, DFS, PFS, or OS). The probe ID of these 11 genes was retrieved by Affymetrix using the NetAffx Query algorithm. The protein–protein interaction (PPI) network and Kaplan–Meier curve were used to find associations among the genes' expression data. We found that among these 11 genes, nine genes, CCNA1, MMP3, FLRT3, GJB6, ZFR2, PITX2, SYCP2, MEI1, and UGT8 were significant (p < .05). A survival plot was drawn between the p value and gene expression. This study helped us find the nine significant genes which play vital roles in HNSCC along with their key pathways and their interaction with other genes in the PPI network. Finally, we found the biomarker index for relapse time and risk factors for HNSCC in cancer patients.
1 INTRODUCTION
The human papillomaviruses (HPV) belongs to a family of viruses called Papilloma viridae. They are a group of small nonenveloped viruses with a circular DNA of an approximate size of 8 kb. The HPV family is classified into five genera and subdivided into 31 species and numerous types. The HPV family is known to be sexually transmitted in humans, being mostly epitheliotropic, with affinity, depending on the host cell factors, to differentiating keratinocytes near the skin or mucosa, and hence, they can infect both mucosal and cutaneous epithelia, at the squamocolumnar transition zones (Speel, 2017). There is now overwhelming evidence that HPVs, particularly HPV-16 and -18, play a causal role in essentially all cases of cervical cancer. There are more than 300 types of HPV, each being a functionally distinct serotype, meaning that serum antibodies that neutralize one HPV serotype do not robustly neutralize other HPV serotypes. HPVs are associated with about half of penile cancers, 88% of anal cancers, 43% of vulvar cancers, 70% of vaginal cancers, and an increasing fraction of head and neck cancers (DeVita, Lawrence, & Rosenberg, 2015). The most common type, HPV-16, has widespread prevalence with levels of prevalence ranging from 3% to 4% in North America to 2% in Europe. The second most common one, HPV-18, is present worldwide (IARC, 2019). HPV prevalence according to age-standardization varied nearly 20 times between populations, from 1.4% in Spain to 25.6% in Nigeria. The prevalence of HPV-18 and HPV-16 was the highest in sub-Saharan Africa. European women, who were HPV-positive, were significantly more likely to be infected with HPV-16 than were those in sub-Saharan Africa and they were significantly less likely to be infected with high-risk HPV types rather than HPV-16 and/or low-risk HPV types. South American women had an HPV-type distribution in-between those from sub-Saharan Africa and Europe. Other than cervical cancers, squamous cell cancers of the head and neck, caused by HPV, are common in Eurasia, with the highest incidence of more than 30 per 100,000 population in India (oral cancer) and France and Hong Kong (nasopharyngeal cancer). Head and neck cancer constitutes about 4% of all cancers in the United States and 5% in the United Kingdom. New cases of lip, mouth, and pharyngeal cancer in men reported in the United Kingdom in 1996 were 2,940: an incidence of 10.2 per 100,000 population (Dickinson, 2000).
In Asia, the heterogeneity between its areas of distribution was significant (Clifford et al., 2005). In Indian women, the overall prevalence of HPV infection was 60.33%, prevalence of HPV infection was 93.80% in invasive cervical cancer (ICC) cases, 54.32% in inflammatory smear and 19.11% in normal cervical cytology. The most prevalent genotype in India was HPV-16 (87.28%) followed by HPV-18 (24.56%) and HPV-51 (3.46%). The overall prevalence of single type was 76.58% and it was the highest (78.9%) among ICC cases (Senapati, Nayak, Kar, & Dwibedi, 2017). As per the report of the HPV Information Centre, India, the prevalence of HPV varies in different organs, ranging from the cervix (5% with normal cervical cytology to 83% in invasive cervical cancer), anal (80.8%), vulva (28.7% in vulval cancers to 100% in vulval intraepithelial neoplasia VIN-2/VIN-3), and vaginal (71.7% in vaginal cancers to 100% in vaginal intraepithelial neoplasia VaIN-2/VaIN-3). The prevalence of HPV in Indian men varied from 26.7% in men with partners with normal cytology to 66.7% in men with partners with cervical cancer (HPV, India).
Almost all cervical cancers, as well as some forms of HNSCCs, are caused by high-risk HPV; as is now widely accepted. Tobacco and alcohol abuse have been implicated as causal factors in head and neck cancers. Also, HPV-infections may lead to the development of head and neck mucosal lesions. The high-risk variety HPV-16 has been implicated in the carcinogenesis of squamous cell carcinomas of the head and neck in general, and in oropharyngeal cancers in particular. It is worthwhile to note that such cancers have a favorable prognosis, independent of the applied treatment modality. The reported incidence of HPV-16 in oropharyngeal squamous cell cancers (OPSCCs) ranges from 25% to 93% in different studies, and appears to be on the rise since the last decade. The overall incidence of OPSCC and its proportion within the total head and neck squamous cell carcinomas (HNSCC) are increasing. Low-risk HPV-16 and 211 are found to play a role in the development of benign laryngeal lesions. In such lesions, HPV positivity predicts a higher risk for recurrence and a lower risk for malignant progression as compared with HPV-negative, smoking-induced laryngeal lesions. Most of our knowledge of HPV-associated mucosal carcinogenesis comes from studies on uterine cervical carcinogenesis, because patients with head and neck lesions containing high-risk HPV usually present with advanced disease and seldom with primary premalignant lesions (Mooren et al., 2014). HPV-related HNSCCs and HPV-unrelated HNSCCs both differ based on their molecular mechanisms underlying their oncogenic processes. HPV-unrelated HNSCC have frequently been found to have p53 mutations (Chalertpet, Pakdeechaidan, Patel, Mutirangura, & Yanatatsaneejit, 2015).
Although it has now become almost an established fact that HPV has a causal relationship with HNSCC. It is less known about the type and distribution of the genetic mutation and about its possible biomarkers. This study purports to find the pattern and distribution of genetic alterations caused by HPV in mucosal carcinogenesis of head and neck cancers and seeks to explore the possibility of determining reliable biomarkers so that we can understand their biological functions and target them for potential diagnosis and treatment of cancer.
2 GENES, HPV-RELATED MODULATION OF EXPRESSION, AND TUMORIGENESIS
2.1 Cyclin A1 (CCNA1)
The oncogenic genes of the HPV genome and their products, namely E6 and E7 proteins, have oncogenic transforming abilities by targeting p53 and RB genes, respectively, for degradation. Upon integration, E6 and E7 become overexpressed, due to E2 disruption (Chalertpet et al., 2015). Apart from this, there may be another mechanism by which HPV causes tumor genesis. Genome-wide methylation and expression studies have suggested that HPV can increase methylation and reduce the expression of as many as 75 genes, in head and neck cancer including IRS1, GNA11, GNAI2, EREG, CCNA1, RGS4, and PKIG (Sartor et al., 2011). Cyclin A1 plays a significant role in cell cycle regulation and genomic stabilization (Ji et al., 2005) and the product of this gene exists only in very low levels in normal cells. As discussed above, CCNA1 is a candidate gene for epigenetic silencing in HNSCC (Pyeon et al., 2007). In solid tumors, cyclin A1 is strongly methylated and it is a gene expressed tissue-specifically. Apoptosis and growth arrest downstream of p53 involves this gene, there is an inverse correlation between cyclin A1 promoter methylation and the presence of p53 mutations. CCNA1 shows a strong correlation with HPV-associated cancer. In HPV-associated cervical cancers, and also in HNSCC, methylated CCNA1 is found. It is upregulated in head and neck cancer (Chalertpet et al., 2015).
2.2 Matrix metallopeptidase 3 (MMP3)
Matrix metallo-proteinases are secreted or cell-surface-associated enzymes that degrade basement membrane components and extracellular matrix. MMPs belong to the family of those proteins which include many biological functions such as cell proliferation and angiogenesis. They also have a role in matrix remodeling during normal development as well as in pathological processes. MMP expression is tightly regulated in normal physiology of the cell and has scope for dysregulation in pathological conditions and neoplasias. Overexpression of one or more MMPs in malignant tumor cells has been associated with malignant progression in human prostate, gastric, colon, breast, ovary, and in head and neck carcinomas. MMP3 overexpression is found in HNSCC. It may also involve different levels of carcinogenesis. MMP3 and MMP7 are expressed in HNSCC and have been correlated to invasiveness (Birkedal-Hansen et al., 2000). Mutation in TP53 and its absence in MMP3 and tumor DNA both are independent factors and they influence HNSCC patients in chemotherapy. The role of these expressed genes (MMP9, MMP2 and MMP3) is found in head neck cancer growth. Stokes, in his seminal paper, published in 1962, concluded that MMPs are involved in head and neck cancer development (Stokes et al., 2010).
2.3 Gap-junction beta-6 protein (GJB6)
The GJB6 gene provides instructions for making a protein called gap-junction β6, more commonly known as connexin 30. Connexin 30 is a member of the connexin protein family. Connexin proteins form channels called gap junctions that permit the transport of nutrients, charged atoms (ions), and signaling molecules between adjoining cells. The GJB6 gene shows underexpression in HPV-positive cases and a negative correlation in HPV-negative cases. This gene shows a downregulated pathway and is connected to HPV-positive tumors. This gene is significantly downregulated and shows more methylation in HPV-negative HNSCC (Costa, Boroni, & Soares, 2018).
2.4 Small proline-rich protein 2G (SPRR2G)
SPRR2G is a protein-coding gene. Among its related functional pathways are keratinization and developmental biology of the cell. It is a keratinocyte protein that first appears in the cell cytosol, but ultimately becomes cross-linked to membrane proteins by transglutaminase. All this results in the formation of an insoluble envelope beneath the plasma membrane. SPRR2G is, therefore, involved in keratinocyte functions and differentiation (Tsuchida et al., 2004). This gene is downregulated in HPV induced tumors. SPRR2G shows downregulation in HPV-positive cases as compared with HPV-negative cases (Costa et al., 2018).
2.5 Fibronectin-like domain-containing leucine-rich transmembrane protein 3 (FLRT3)
FLRT3 is a protein-coding gene. FLRTs may function in cell adhesion and/or receptor signaling. Their protein structures resemble small leucine-rich proteoglycans found in the extracellular matrix. Among its related pathways are negative regulation of FGFR3 signaling and downstream signaling of activated FGFR2 which play a role in downregulation of HPV-positive cases as compared with HPV-negative cases. The FLRT3 gene is downregulated in tumor-associated lymphatic endothelial cells (Zhuang, Jian, Longjiang, Bo, & Hongwei, 2008).
2.6 Synaptonemal complex protein 2 (SYCP2)
SYCP2 is a protein-coding gene and its product has protein heterodimerization activity. The synaptonemal complex is a proteinaceous structure that links homologous chromosomes during the prophase of meiosis. The protein encoded by this gene is a major component of the synaptonemal complex and may bind DNA at scaffold attachment and promote recombination (Martinez, Wang, Hobson, Ferris, & Khan, 2007). SYCP2 expression is greater in HPV-positive tumor regions. SYCP2 is an upregulated gene in HPV-positive cases compared with HPV-negative head and neck cancer (Pyeon et al., 2007).
2.7 SRY-related HMG box (SOX30)
The SOX30 family of transcription factor-encoded protein acts as a transcriptional regulator when present in a complex with other proteins. It can activate p53 transcription to promote tumor cell apoptosis in lung cancer. It is involved in the regulation of embryonic development and in the determination of cell fate. Partial demethylation of SOX30 is found in tumor tissues. This gene is statistically significantly demethylated in tumor patients (Pattani et al., 2012). A lower expression/underexpression of SOX30 is found in HNSCC. SOX30 is a deregulated gene in cancer (Thu et al., 2014).
2.8 Meiotic double-strand break formation protein 1 (MEI1)
MEI1 is a protein-coding gene. It is required for normal meiotic chromosome synapsis. MEI1 has been found to be methylated in HPV-positive compared with HPV-negative cases in HNSCC. The role of MEI1 in cancer is not known and its investigation is ongoing (Worsham et al., 2016). The MEI1 gene was overexpressed in HPV-negative cases as compared with HPV-positive cases.
2.9 Zinc finger RNA-binding protein 2 (ZFR2)
ZFR2 is a protein-coding gene. It binds single- and double-stranded DNA, as well as zinc ions. ZFR2 gene is overexpressed in HPV-positive patients as compared with HPV-negative patients.
2.10 UDP glycosyltransferase 8 (UGT8)
The protein encoded by this gene belongs to the UDP glycosyltransferase family. It catalyzes the transfer of galactose to ceramide, a key enzymatic step in the biosynthesis of galactocerebrosides, which are abundant in sphingolipids of the myelin membrane of the central and peripheral nervous systems. UGT8 is present in basal-like breast cancer. Upregulation of SOX10 controls UGT8 expression that causes basal-like breast cancer progression. Its knockdown suppresses tumorigenicity and metastasis whereas its expression promotes them (Cao et al., 2018).
2.11 Paired-like homeodomain transcription factor 2 (PITX2)
PITX2 is a protein-coding gene. Among its related pathways are the TGF-β signaling pathway (Kyoto Encyclopedia of Genes and Genomes, KEGG) and the mesodermal commitment pathway. It is known to control cell proliferation in a tissue-specific manner and is involved in morphogenesis and plays a key role in embryonic development, including determination of left-right asymmetry in the embryo. Hypermethylation of PITX2 is linked with a better survival (p < .001). Methylation of PITX2 status is an independent predictor for survival in HNSCC patients (Sailer et al., 2016).
The Wnt pathway regulates the PITX2 gene expression and cell growth through cyclins D2 and A1. Hypermethylation of PITX2 is also found in acute myeloid leukemia. Tumor progression in thyroid and ovarian carcinomas results due to low methylation and PITX2 overexpression. There is a risk of diseases associated with PITX2 and DNA methylation in patients with non-small-cell lung cancer (Sailer et al., 2017).
3 GENE EXPRESSION PREDICTION
Predictive modeling aims to build tools that help in estimating risk or finding the probability of an outcome occurring that helps in the decision-making processes. In cancer, the outcomes include survival of patients (over a specific period) and curability (risk of recurrence). Various studies have shown that other predictive models are superior to this model. If this model is used to predict a patient's outcome, it may not reflect the patient's own actual risk, but it represents the overall risk of the group in which he is allocated. Risk grouping is a type of predictive model in which patients are allocated to a specific group based on their characteristics and it is applied to cancer patients to divide them into high, moderate, and low-risk groups. On the basis of the characteristics and which group patients belong, clinicians find their risk and the probability of benefit in terms of response to treatment and survival.
4 METHODOLOGY
4.1 Retrieval of data set from Gene Expression Omnibus (GEO) data base
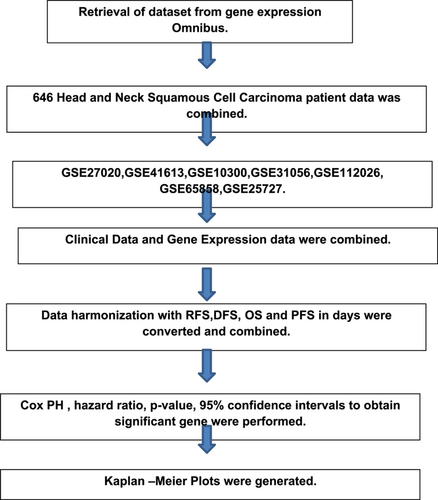
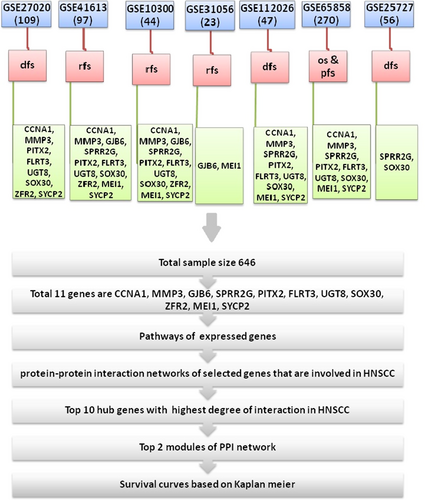
The GEO data base gives information about functional genomic data sets as well as about gene expression. By using this data base, seven data sets were retrieved, whose clinical data were more or less similar. A total of 646 patient samples were taken from these seven data sets. These selected data sets were obtained on HNSCC as shown in Figure 1. The clinical parameters were measured as relapse-free survival (RFS), disease-free survival (DFS), progression-free survival (PFS) and overall survival (OS). The measurement of RFS, DFS, and PFS were harmonized and defined as PFS. From the literature, we have found that 11 genes were associated with HNSCC. The probes of these 11 genes were retrieved from the affymetrix data base. We obtained data containing a gene list corresponding to their selected data sets. We have also studied the expression of the gene list that is upregulated or downregulated in HNSCC as shown in Table 1.
| Upregulated genes | Downregulated genes |
|---|---|
| SYCP2 | GJB6 |
| CCNA1MMP3 | SPRR2G |
| MEI1 | PITX2 |
| ZFR2 | – |
| UGT8 | – |
| SOX30 | – |
- Abbreviations: CCNA1, cyclin A1; GJB6, gap-junction beta-6 protein; MEI1, meiotic double-strand break formation protein 1; MMP3, matrix metallopeptidase 3; PITX2, paired-like homeodomain transcription factor 2; SOX30, SRY-related HMG box; SPRR2G, small proline-rich protein 2G; SYCP2, synaptonemal complex protein 2; UGT8, UDP glycosyltransferase 8; ZFR2, zinc finger RNA-binding protein 2.
4.2 Pathway analysis
The String data base was used to identify the significant pathways involved in HNSCC by submitting the 11-gene list in a query list.
4.3 The p value estimation
The Cox proportional hazards (CPH) model is a regression model. It is based on survival analysis methods to study the effect of the various risk factors on survival time. Using the CPH function in R software, the p value was calculated to find the significant genes. The CPH model includes the time (relapse-free survival, disease-free survival, and progression-free survival), status (recurrence), and gene expression value (x) of a particular gene. The hazard ratio (HR), 95% confidence interval (CI) value and other parameters were also calculated by using this method. On the basis of the HR values, genes were categorized into two groups I1 (more than 1, high expression) and I2 (less than 1, low expression).
4.4 Kaplan–Meier plot
The Kaplan–Meier was plotted in R software using the function survfit. The survfit function included time (RFS, DFS, and PFS), status (recurrence), and gene expression values in the form of 0 and 1 of all samples of data sets. The time duration was in months.
5 RESULTS
The data sets taken from GEO were analyzed by a process described in the flowchart Figure 2. These seven data sets were retrieved based on clinical data whose clinical data were more or less similar. Samples from 646 patients with HNSCC were taken. Using clinical data information, HNSCC samples were grouped according to the parameters (RFS, DFS, PFS, or OS). Table 2 shows the presence of different parameters with their units and sample sizes. Eleven genes were obtained from the literature review that were involved in HNSCC. The probe ID of these 11 genes was retrieved by Affymetrix using the NetAffx Query algorithm. CCNA1, MMP3, GJB6, SPRR2G, PITX2 had one probe sets but some genes had more than one probe sets like FLRT3 and UGT8 had two and ZFR2, MEI1, SYCP2 had three probe sets. Using these probe sets, we searched the list of genes in seven data sets to retrieve the causative genes of HNSCC. R software was used for invariant analysis of p value, HR, 95% CI value and the parameters of these genes using CPH function. Tables 3 and 4 shows the list of genes with DFS, RFS, and PFS parameters, as well as of the OS parameter showing the HR, 95% CI and p value simultaneously.
| Study ID | GSE41613 | GSE27020 | GSE31056 | GSE10300 | GSE65858 | GSE112026 | GSE25727 |
|---|---|---|---|---|---|---|---|
| RFS | Yes | No | Yes | Yes | No | No | No |
| PFS | No | No | No | No | Yes | No | No |
| DFS | No | Yes | No | No | No | Yes | Yes |
| OS | No | No | No | No | Yes | No | No |
| RFS unit | Days | Days | Days | Days | Days | Days | Days |
| DFS unit | Days | Days | Days | Days | Days | Days | Days |
| PFS unit | Days | Days | Days | Days | Days | Days | Days |
| OS unit | Days | Days | Days | Days | Days | Days | Days |
| Sample size | 97 | 109 | 23 | 44 | 270 | 47 | 56 |
| Maximum RFS | 2,550.9 | – | 1,790.1 | 281.1 | – | – | – |
| Minimum RFS | 13.8 | – | 42.9 | 7.8 | – | – | – |
| Maximum PFS | – | – | – | – | 2,393 | – | – |
| Minimum PFS | – | – | – | – | 11 | – | – |
| Maximum DFS | – | 2,820 | – | – | – | 5,400 | 4,830 |
| Minimum DFS | – | 30 | – | – | – | 0 | 0 |
| Maximum OS | – | – | – | – | 2,393 | – | – |
| Minimum OS | – | – | – | – | 11 | – | – |
- Abbreviations: DFS, disease-free survival; ID, identity document; OS, overall survival; PFS, progression-free survival; RFS, relapse-free survival.
| 95% CI | |||||
|---|---|---|---|---|---|
| Gene name | Hazard ratio | Lower value | Upper value | Parameter | p Value |
| CCNA1 | 0.9151 | 0.8644 | 0.9688 | DFS, RFS, PFS | .00229 |
| FLRT3 | 0.9991 | 0.9972 | 1.001 | DFS, RFS, PFS | .327 |
| ZFR2 | 0.9051 | 0.8383 | 0.9767 | DFS, RFS, PFS | .0103 |
| UGT8 | 0.9999 | 0.9992 | 1.001 | DFS, RFS, PFS | .853 |
| SYCP2 | 0.9998 | 0.9996 | 0.9999 | DFS, RFS, PFS | .00590 |
| SPRR2G | 0.9998 | 0.9972 | 1.002 | DFS, RFS, PFS | .693 |
| SOX30 | 0.9964 | 0.9919 | 1.001 | DFS, RFS, PFS | .114 |
| PITX2 | 0.9998 | 0.9962 | 1.003 | DFS, RFS, PFS | .907 |
| MMP3 | 0.9985 | 1.002 | 0.9966 | DFS, RFS, PFS | .117 |
| MEI1 | 0.9997 | 0.9992 | 1 | DFS, RFS, PFS | .216 |
| GJB6 | 1.013 | 0.9819 | 1.044 | DFS, RFS, PFS | .423 |
- Abbreviations: CCNA1, cyclin A1; CI, confidence interval; DFS, disease-free survival; FLRT3, fibronectin-like domain-containing leucine-rich transmembrane protein 3; GJB6, gap-junction beta-6 protein; MEI1, meiotic double-strand break formation protein 1; MMP3, matrix metallopeptidase 3; PFS, progression-free survival; PITX2, paired-like homeodomain transcription factor 2; RFS, relapse-free survival; SOX30, SRY-related HMG box; SPRR2G, small proline-rich protein 2G SYCP2, synaptonemal complex protein 2; UGT8, UDP glycosyltransferase 8; ZFR2, zinc finger RNA-binding protein 2.
| 95% CI | |||||
|---|---|---|---|---|---|
| Gene name | Hazard ratio | Lower value | Upper value | Parameter | p Value |
| CCNA1 | 0.845 | 0.6491 | 1.1 | OS | .211 |
| FLRT3 | 1.17 | 1.1078 | 12.7 | OS | .897 |
| MEI1 | 5.827 | 0.8702 | 39.03 | OS | .0693 |
| MMP3 | 0.9688 | 0.8432 | 1.115 | OS | .657 |
| PITX2 | 0.4108 | 0.1383 | 1.221 | OS | .109 |
| SOX30 | 1.97 | 0.06056 | 64.08 | OS | .703 |
| SPRR2G | 0.9588 | 0.8623 | 1.066 | OS | .437 |
| SYCP2 | 1.338 | 0.9755 | 1.836 | OS | .0709 |
| UGT8 | 0.7575 | 0.4583 | 1.252 | OS | .79 |
- Abbreviations: CCNA1, cyclin A1; CI, confidence interval; DFS, disease-free survival; FLRT3, fibronectin-like domain-containing leucine-rich transmembrane protein 3; MEI1, meiotic double-strand break formation protein 1; MMP3, matrix metallopeptidase 3; OS, overall survival; PFS, progression-free survival; PITX2, paired-like homeodomain transcription factor 2; RFS, relapse-free survival; SOX30, SRY-related HMG box; SPRR2G, small proline-rich protein 2G; SYCP2, synaptonemal complex protein 2; UGT8, UDP glycosyltransferase 8; ZFR2, zinc finger RNA-binding protein 2.
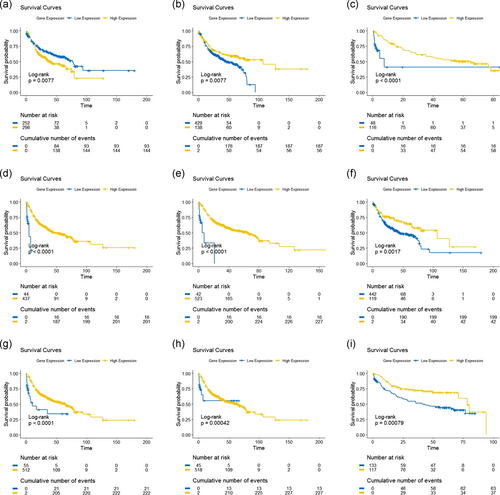
We obtained that among these 11 genes, nine genes are CCNA1, MMP3, FLRT3, GJB6, ZFR2, PITX2, SYCP2, MEI1, and UGT8 were significant (p < .05). A survival plot was drawn between p value and gene expression. On the basis of the mid values of survival plot, the range of low expression and high expression was decided.
5.1 Estimation of index value
These genes were categorized based on their HR values and named as I1 (having HR > 1) and I2 (having HR < 1). Out of these nine genes, one is in the I1 and rest eight were put in I2. I1 had a weightage of 0.111111 and I2 had a weightage of 0.11. On the basis of these weightage values, the final index value (I) was calculated. The p value of these indexes was obtained using SAS Software.
5.1.1 Formula for biomarker index value (I)
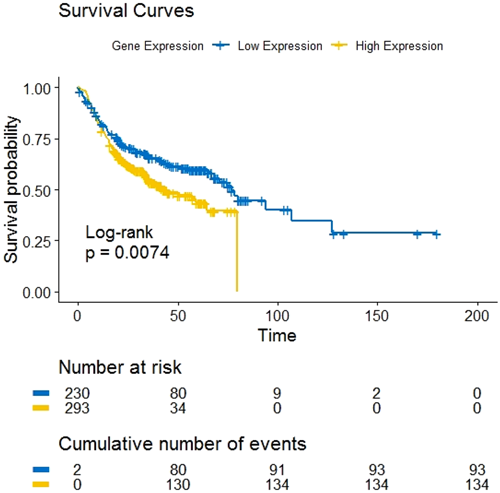
The threshold value of the index was obtained as 0.15. The index value which is less than the cutoff was assigned the value 0 and what was more than cutoff was assigned the value 1. The Kaplan–Meier curve was plotted based on these values. From this curve, we obtained the log-rank value (p = .0074), which describes the survival distribution of low and high gene expression at each observed event time.
5.2 Kaplan–Meier estimation
Clinical information regarding survival time was collected from GEO and then analyzed by the Kaplan–Meier method to study survival analysis among the nine genes which are involved in HNSCC. The survival curves of all genes and of the gene expressed by the risk group (index) are shown in Figures 3 and 4 together. From the survival curves, GJB6, MEI1, MMP3, and SYCP2 genes were found to have similar log-rank values (p < .0001) whereas CCNA1 and FLRT3 have p = .0077 log-rank value and the ther genes PITX2, UGT8, and ZFR2 have different log-rank values p = .0017, p = .00042, and p = .00079 respectively.
5.3 Pathway analysis
Pathways of these 11 genes involved in HNSCC were analyzed using KEGG pathway analysis. A total of 16 significantly enriched pathways were identified that are listed in Table 5. The false discovery rate of the cell cycle was very low.
| Pathway | Description | Count in gene set | False discovery rate |
|---|---|---|---|
| hsa04110 | Cell cycle | 17 of 123 | 1.64E–27 |
| hsa04914 | Progesterone-mediated oocyte maturation | 8 of 94 | 8.15E–11 |
| hsa03030 | DNA replication | 6 of 36 | 8.82E–10 |
| hsa04114 | Oocyte meiosis | 7 of 116 | 1.05E–08 |
| hsa04218 | Cellular senescence | 6 of 156 | 2.02E–06 |
| hsa05203 | Viral carcinogenesis | 6 of 183 | 4.18E–06 |
| hsa04115 | P53 signaling pathway | 4 of 68 | 3.19E–05 |
| hsa05169 | Epstein–Barr virus infection | 5 of 194 | 9.85E–05 |
| hsa04068 | FoxO signaling pathway | 4 of 130 | 0.00035 |
| hsa05161 | Hepatitis B | 4 of 142 | 0.00045 |
| hsa05215 | Prostate cancer | 3 of 97 | 0.0027 |
| hsa05166 | HTLV-I infection | 4 of 250 | 0.0031 |
| hsa05165 | Human papillomavirus | 4 of 317 | 0.0068 |
| hsa05202 | Transcriptional misregulation in cancer | 3 of 169 | 0.0100 |
| hsa05222 | Small-cell lung cancer | 2 of 92 | 0.0361 |
| hsa04066 | HIF-1 signaling pathway | 2 of 98 | 0.0381 |
5.4 Protein–protein interaction (PPI) network of selected genes that are involved in HNSCC
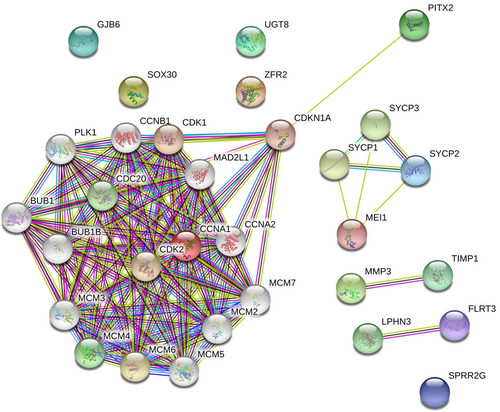
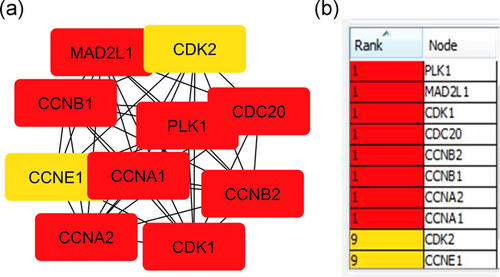
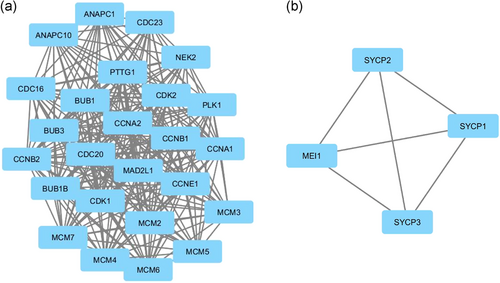
The PPI network was constructed in Figure 5 to identify the most important proteins and biological modules that were involved in the development of HNSCC. A total of 31 nodes and 47 edges were screened from this PPI network. The average node degree was 8.9, and PPI enrichment (p < .00). Each gene assigned with a degree that shows the number of connections of genes with their neighbors. The top-10 hub genes with the highest degree in HNSCC were PLK1, MAD2L1, CDK1, CDC20, CCNB2, CCNB1, CCNA1, CDK2, and CCNE1. CCNA1 has the highest degree of 24 that denotes their vital roles in HNSCC in Figure 6. To find the significance of these genes, the top two significant modules were selected and analyzed in Figure 7. The results showed that these two modules had some pathways that were playing a vital role in HNSCC. Module 1 involves cell cycle, progesterone-mediated oocyte maturation, oocyte meiosis, cellular senescence, and viral carcinogenesis in Table 6.
| Pathways | Genes involved |
|---|---|
| Cell cycle | PLK1, MAD2L1, CDK1, CDC20, CGNB2, CCNB1, CCNA2, CCNA1, CDK2, CCNE1 |
| Progesterone-mediated oocyte maturation | PLK1, CCNB1, CDK1, MAD2L1, CCNA2, CCNA1, CDK2 |
| Oocyte meiosis | PLK1, CCNB1, CDK1, CDC20, BUB, MAD2L1, CDK2 |
| Cellular senescence | CCNB1, CDK1, CCNA2, CCNA1, CDK2 |
| Viral carcinogenesis | CDK1, CDC20, CCNA1, CDK2, CCNA2 |
6 DISCUSSION
HNSCC is a cancer that occurs in the squamous cells of the head and neck. Squamous cells are found in the mucous membrane and in the outer layer of skin. On the basis of the location, HNSCC is classified into the oral cavity, oropharynx, larynx, nasopharynx, or hypopharynx. It is the seventh most common cancer occurring worldwide. Various risk factors are responsible for HNSCC such as the use of tobacco (smoking) and the consumption of alcohol. Besides these factors, infection caused by strains of HPV is also linked to HNSCC development.
HPVs are the cause of HNSCC. The most common type of HPV is HPV-16, another HR HPV is HPV-18. The association between cancer arising from squamous cell epithelial cells and HPV-16 infection is biologically credible. Cervical and oral epithelial cells can be immortalized by HPV-16. The tumor suppressor proteins p53 and pRb both are inactivated and bind by viral oncoproteins E6 and E7. In HPV-16, E7 mediated inactivation of pRb which may function in oral carcinogenesis.
Our approach started with the identification of samples associated with HNSCC. These samples are retrieved from seven data sets that have a more or less clinical similarity. Also, studies have shown that 11 genes are involved in HNSCC. This study applied the biostatistics and bioinformatics approach to finding the biomarker index for HPV elevated head and neck cancer patients. The data used here has 646 samples involving clinical data. The p value was calculated to find the significant genes that are involved in HNSCC. Out of 11 genes, we have found nine significant genes based on survival analysis (p < .05).
We have obtained the I1 and I2 based on HR value. One gene (ccna1) is selected from a pool of nine gene in I1 and the rest of the eight genes (mmp3, flrt3, gjb6, pitx2, zfr2, mei1, ugt8, and sycp2) are in I2. The final index value is estimated from I1 and I2. The purpose of calculating this index value is to know the relapse time and risk factors toward the HNSCC of each sample patient.
KEGG pathway analysis was performed to find the molecular level interaction between these genes. Enrichment analysis identified the most important pathways “cell cycle,” “p53 signaling pathway,” “cellular senescence,” “DNA replication,” “oocyte meiosis,” “viral carcinogenesis,” “progesterone-mediated oocyte maturation,” “prostate cancer,” “human papillomavirus,” “transcriptional misregulation in cancer,” “small-cell lung cancer,” “Epstein–Barr virus,” “Hepatitis B,” “HTLV-1 infection,” “transcriptional misregulation in cancer,” and “HIF-1 signaling pathway”—these are involved in HNSCC. From the literature survey it was found that “p53 and retinoblastoma Rb signaling pathway,” “cell cycle misregulation,” “DNA replication,” and “AKT signaling pathway” are the pathways that play an important role in HNSCC. This HPV contains E6 and E7 oncogenes which are expressed and inactivates retinoblastoma (Rb) and p53, causing dysregulation of the cell cycle of the infected cells. TP53 is mutated in 60–80% of HNSCC cases. The PPI network was constructed with the help of String to show the role of these genes with the interaction of other genes in development of HNSCC. The String file was imported in Cytoscape software using the CYTOHUBBA plug-in, and the top-10 hub genes were found based on their degree. The gene with the highest score was CCNA1. These top-10 hub genes play important roles in HNSCC. Using the MCODE plug-in of Cytoscape, the top two modules of this network were found. One module was seen to take part in HNSCC. High CCNA1 expression is associated with nasopharyngeal carcinoma. HPV-16 induces overexpression of cyclin A1 in HNSCC despite promoter methylation.
7 CONCLUSION
Hence, this study made us find nine significant genes which play vital roles in HNSCC with their key pathways and their interaction with other genes in the PPI network; finally, we found the biomarker index for relapse time and risk factors towards HNSCC in cancer patients.
ACKNOWLEDGMENTS
The authors are deeply indebted to the editor Gregg B. Fields and a learned anonymous referee for their valuable suggestions leading to improving the quality of contents and presentation of the original manuscript.
CONFLICT OF INTERESTS
The authors declare that there are no conflict of interests.
Open Research
DATA AVAILABILITY STATEMENT
The data that support the finding of the study are available from the corresponding author upon reasonable request from author.


