Long noncoding RNA CCAT1 inhibits miR-613 to promote nonalcoholic fatty liver disease via increasing LXRα transcription
Feizhou Huang and Huaizheng Liu contributed equally to this study.
Abstract
Nonalcoholic fatty liver disease (NAFLD) is regarded as a threat to public health; however, the pathologic mechanism of NAFLD is not fully understood. We attempted to identify abnormally expressed long noncoding RNA (lncRNAs) and messenger RNA that may affect the occurrence and development of NAFLD in this study. The expression of differentially expressed lncRNAs in NAFLD was determined in oleic acid (OA)-treated L02 cells, and the functions of CCAT1 in lipid droplet formation were evaluated in vitro. Differentially expressed genes (DEGs) were analyzed by microarray analysis, and DEGs related to CCTA1 were selected and verified by weighted correlation network analysis. The dynamic effects of LXRα and CCTA1 on lipid droplet formation and predicted binding was examined. The binding between miR-631 and CCAT1 and LXRα was verified. The dynamic effects of miR-613 inhibition and CCTA1 silencing on lipid droplet formation were examined. The expression and correlations of miR-631, CCAT1, and LXRα were determined in tissue samples. As the results show, CCAT1 was induced by OA and upregulated in NAFLD clinical samples. CCAT1 silencing significantly suppressed lipid droplet accumulation in vitro. LXRα was positively correlated with CCAT1. By inhibiting miR-613, CCAT1 increased the transcription of LXRα and promoted LXRα expression. The expression of LXRα was significantly increased in NAFLD tissues and was positively correlated with CCAT1. In conclusion, CCAT1 increases LXRα transcription by serving as a competing endogenous RNA for miR-613 in an LXRE-dependent manner, thereby promoting lipid droplet formation and NAFLD. CCAT1 and LXRα might be potent targets for NAFLD treatment.
1 INTRODUCTION
Nonalcoholic fatty liver disease (NAFLD) is one of the most commonly diagnosed liver diseases. It is becoming a global challenge to public health (Cohen, Horton, & Hobbs, 2011). Furthermore, NAFLD has become increasingly popular in developing countries (Vernon, Baranova, & Younossi, 2011; Younossi et al., 2011). In the beginning phase of NAFLD, triacylglycerols show abnormal accumulation, and eventually, cirrhosis and even liver cancer can develop (Ertle et al., 2011; Sanyal, Poklepovic, Moyneur, & Barghout, 2010). Besides, NAFLD has been reported to be related to an improper diet, obesity, hyperlipidemia, and type 2 diabetes and is considered a typical liver feature of metabolic syndrome (Eminler et al., 2014; Leung et al., 2015). However, the pathologic mechanism of NAFLD is still unclear.
Reportedly, environmental (behavioral) and genetic factors closely related to obesity and type 2 diabetes are involved in the pathologic mechanism of fatty liver (Kantartzis, Schick, Haring, & Stefan, 2010). As with the vast majority of common diseases, NAFLD has a genetic susceptibility component, suggesting that genetic variation can affect the disease risk (J. Yu, Marsh, Hu, Feng, & Wu, 2016). Macaluso, Maida, and Petta (2015) noted that genome-wide association studies (GWAS) have identified dozens of genes with several genetic polymorphisms, which may account for the NAFLD risk in some people (Macaluso et al., 2015). In our previous study, we showed that the expression levels of 1,735 long noncoding RNAs (lncRNAs) and 1,485 protein-coding RNAs in NAFLD liver were different from those in the healthy liver (Sun et al., 2015; Sun, Huang, Yan, Liu, & Wang, 2017). lncRNAs are transcripts composed of more than 200 nucleotides, which cannot encode proteins. Many lncRNAs are evolutionally conserved and affect transcriptional modulation, epigenetic gene regulation, and disease progression (Ponting, Oliver, & Reik, 2009; Wilusz, Sunwoo, & Spector, 2009; Yuan et al., 2015). Regarding the possible mechanism, lncRNAs act as competing endogenous RNAs (ceRNAs), a mechanism by which microRNAs (miRNAs) and lncRNAs regulate each other through their binding sites. Interactions of miRNAs and lncRNAs have been reported to trigger decay of the targeted lncRNAs and have essential roles in target gene regulation (Deng, Yang, Xu, & Zhang, 2015). Based on these previous findings, we speculate that the abnormally expressed lncRNAs and mRNAs reported in our earlier studies (Sun et al., 2015, 2017) may strongly affect the occurrence and development of NAFLD, possibly in a miRNA-related manner.
Although the dysregulation of lncRNAs has been reported in NAFLD progression, little is known of the role of lncRNAs in the development or progression of NAFLD. The expression levels of lncRNA MEG3 were significantly decreased in a CCl4-induced mouse liver fibrosis model and human liver fibrosis of undisclosed etiology (He et al., 2014). Another lncRNA, namely lncRNA APTR, was upregulated in human cirrhosis and activated hepatic stellate cells (F. Yu et al., 2015). Similarly, the expression of lncRNA MALAT1 was increased in the livers of ob/ob mice, as well as hepatocytes exposed to palmitate (Yan, Chen, & Chen, 2016). These findings provide a further rationale for the analysis of the specific role of lncRNAs in NAFLD. To further understand the function and mechanism of lncRNAs in NAFLD, we analyzed the liver expression of previously identified lncRNAs in NAFLD specimens. We found that lncRNA CCAT1 was significantly induced by oleic acid (OA) stimulation and upregulated in NAFLD samples. Thus, its effects on lipid droplet formation were investigated in vitro. Next, differentially expressed lncRNAs and mRNAs in NAFLD samples were analyzed by microarray analysis; then, a coexpression network of lncRNAs-mRNAs was constructed by weighted correlation network analysis (WGCNA). Among the critical genes of NAFLD lipid metabolism that were significantly correlated with CCAT1 identified in WGCNA, NR1H3, which encodes the liver X receptor α (LXRα) protein, was the most significantly downregulated gene in response to CCAT1 silencing.
LXRs are classically known as oxysterol-activated nuclear transcription factors and members of the nuclear receptor family. LXRs heterodimerize with retinoic X receptor (RXR; Nuclear Receptor Subfamily 2 Group B [R2B]) family members to regulate the expression of genes involved in cholesterol homeostasis, lipogenesis, glucose metabolism, and inflammation (Herrema et al., 2010). LXRα is the predominantly expressed isoform in lipogenic tissues, such as the liver and adipose tissue (Repa & Mangelsdorf, 2000); more important, LXRα regulates hepatic carbohydrate response element-binding protein α (ChREBPα) activity and lipogenesis upon glucose stimulation (Fan et al., 2017). Having identified a positive correlation between CCAT1 and LXRα, we hypothesized that CCAT1 might regulate LXRα and downstream ChREBP in a miRNA-related manner. Therefore, the effects of CCAT1 on NR1H3 transcription and LXRα and ChREBP expression were investigated. Next, the dynamic effects of CCAT1 and LXRα on lipid droplet formation were examined.
A hepatocellular carcinoma cell line HepG2 and an immortalized normal human liver cell line L02 treated with palmitic acid or OA were reported as a classic NAFLD model in vitro (Gao et al., 2018; Gu et al., 2019; Wan et al., 2016). Thus, the present study used these two cell lines as an in vitro model of NAFLD. For the molecular mechanism of CCAT1 modulating NR1H3 transcription, miR-613 reportedly binds to the 3'-untranslated region (UTR) of NR1H3 to inhibit its expression (Zhao, Feng, & He, 2014; Zhong, Zhang et al., 2013) and to repress lipogenesis in HepG2 cells upon glucose stimulation (Zhong, Zhang et al., 2013). Interestingly, an online tool predicted that CCAT1 might bind to miR-613 to regulate its expression. Therefore, we further investigated whether CCAT1 could serve as a ceRNA for miR-613 to relieve miR-613-mediated suppression of LXRα. Finally, the expression of NR1H3 and miR-613 and the correlations of CCAT1, miR-613, and NR1H3 in tissue samples were investigated. In summary, we demonstrated the specific role and the mechanism of a novel lncRNA (CCAT1) in NAFLD and the lipid droplet formation.
2 MATERIALS AND METHODS
2.1 Subjects and tissue and serum samples
NAFLD (n = 17) and normal liver tissues (n = 10) or serum samples were obtained in our previous studies (Sun et al., 2015, 2017). The study protocol was approved by the Ethics Committee of the Third Xiangya Hospital of Central South University and was conducted according to the principles expressed in the Declaration of Helsinki. Written informed consent was obtained from all patients. The tissue samples were stored in liquid nitrogen or fixed in 10% Formalin.
2.2 Cell lines and cell transfection
The human normal liver cell line L02 was obtained from ProCell (Wuhan, China) and cultured in RPMI-1640 (PM150110; ProCell) supplemented with 10% fetal bovine serum (FBS; Invitrogen, Waltham, MA). The hepatocellular carcinoma cell line HepG2 was obtained from ATCC (ATCC® HB-8065™, Manassas, VA) and cultured in Eagle's minimum essential medium (Catalog No. 30-2003, ATCC) supplemented with 10% FBS (Invitrogen). All cells were cultured at 37°C in 5% CO2.
LncRNA CCAT1 silencing was conducted by the transfection of si-CCAT1 (RiboBio, Guangzhou, China). LXRα overexpression was conducted by the transfection of the LXRα-overexpressing vector (RiboBio). All transfections were performed with Lipo2000 (Invitrogen). Forty-eight hours later, the cells were collected for further experiments.
2.3 Real-time polymerase chain reaction
Total RNA extraction, reverse transcription, and polymerase chain reaction (PCR) were performed following methods described previously (Asadi, Shanehbandi, Mohammadpour, Hashemzadeh, & Sepehri, 2018; Aslani et al., 2016) using SYBR Green PCR Master Mix (Qiagen, Hilden, Germany). GAPDH expression was used as an endogenous control for mRNA determination. The method was used to analyze the relative fold changes. The primer sequence is listed in Table S1.
2.4 Adipogenic induction by fatty acid treatment
OA was obtained from Sigma-Aldrich (St. Louis, MO) and dissolved in isopropyl alcohol at a stock concentration of 800 μM. OA was added to the culture medium at concentrations of 0, 10, 20, and 50 μM for 48 hr according to a method described previously (Cazanave et al., 2009). Oil Red O and BODIPY staining of cells was conducted as previously described (Shao et al., 2014; Wang et al., 2009) to identify the lipid droplets. Briefly, for Oil Red O staining, cells were fixed with 10% formalin and stained with Oil Red O (5 mg/ml, Solarbio, China) for 15 min. The nucleus was stained by hematoxylin solution (Solarbio) for 5 min. Oil droplets were observed using microscopy (Olympus, Tokyo, Japan). For BODIPY staining, cells were fixed with 10% formalin, and lipid accumulation was evaluated using BODIPY 493/503 staining for 30 min (1 μg/ml, Invitrogen). Cell nuclei were stained with 4′,6-diamidino-2-phenylindole (DAPI), and the lipid accumulation was observed using fluorescence microscopy (Olympus). The Oil Red O-stained area and the number of lipid droplets were estimated by the ImageJ software (NIH).
2.5 Data mining and analysis
The lncRNA microarray analysis was performed by an Agilent-045997 Arraystar human lncRNA microarray V3. Significant Analysis of Microarray (SAM) software was used to analyze NAFLD tissues (n = 5) and normal liver tissues (n = 5) for differences in the expression of lncRNAs and mRNAs. Total RNA from NAFLD tissues and normal liver tissues was extracted, and the purity and integrity of the RNA were detected. After hybridization, the different fluorescence intensities of lncRNAs and mRNAs were obtained by chip hybridization, and the fluorescence intensity values were obtained by image scanning. The differentially expressed lncRNAs and mRNAs were selected according to the criterion of p < .05 and fold change value >2.
2.6 Weighted correlation network analysis
WGCNA was carried out on the differentially expressed genes using the R “WGCNA” package (v1.61; http://www.r-project.org/). The heatmap tools package was used to analyze the strength of the interactions. For the identification of modules with different expression patterns, a soft threshold power was assigned to create coexpression networks. The networks were built by merging genes with highly similar coexpression patterns into modules, and the eigengenes of these modules were determined. Finally, a module with the key lncRNAs and their coexpressed genes was obtained.
2.7 Immunoblotting analyses
The protein levels of LXRα and ChREBP were determined using immunoblotting as described previously (M. Zhang, Sun, Zhou, & Tang, 2017). Anti-LXRα (ab41902; Abcam, Cambridge, MA), ChREBP (ab92809; Abcam) and anti-GAPDH (ab8245; Abcam) were used. The primary antibodies were incubated overnight at 4°C and visualized by ECL Plus (Thermo Fisher Scientific, Waltham, MA). The immunoblotting bands were observed by an automatic chemiluminescence imaging system (Tanon-4200, China)
2.8 Luciferase reporter assays
The luciferase reporter assays for transcription of LXRα were performed following methods described previously (Y. Zhang et al., 2012) using 300 ng of TK-LXRE3-Luc, SREBP1c-Pro-Luc, or TK-Pal-Luc vector and 10 ng of Renilla plasmid DNA per well (RiboBio). Luciferase activity was determined according to the manufacturer's instructions and was normalized to Renilla luciferase activity. For the binding of miR-613 and CCAT1 luciferase reporter assays, the fragment of CCAT1 was amplified and cloned downstream of Renilla in the psiCHECK2 vector (C8021; Promega, Madison, WI) named wt-CCAT1. To generate the CCAT1 mutant reporter, we mutated the seed region of CCAT1 to remove the complementarity to miR-613 and named the mut-CCAT1. The reporter vectors were cotransfected with miR-613 mimics or inhibitor to 293T cells. Luciferase assays were performed 48 hr after transfection using the Dual-Luciferase Reporter Assay System (Promega).
2.9 RNA fluorescence in situ hybridization
A Specific DIG-labeled CCAT1 probe was obtained from Servicebio tech (Wuhan, China). Cells were fixed in 4% formaldehyde for 30 min and then washed with phosphate buffered saline. After permeabilization, cells were prehybridized with a hybridization solution and then incubated with CCAT1 probes in hybridization buffer overnight at 37°C. After blocking with bovine serum albumin, cells were incubated with anti-DIG-HRP for 1 hr at 37°C. Then, cells were incubated with FITC-TSA reagent for 5 min at room temperature. Cell nuclei were stained with DAPI for 5 min at room temperature. Cells were observed by fluorescence microscopy (Olympus). The probe sequences are listed in Table S1.
2.10 Statistical analysis
Data were processed using SPSS17.0 statistical software and are presented as the mean ± standard deviation of results from at least three independent experiments. The Student's t test was used for statistical comparison between the two groups. Differences among more than two groups in the above assays were estimated using one-way analysis of variance following Turkey's test. For correlation analysis, the Pearson correlation coefficient analysis was used. *p < .05; **p < .01.
3 RESULTS
3.1 Adipogenic induction by OA treatment in L02 and HepG2 cells and lncRNA CCAT1 expression
L02 and HepG2 cells were treated with different concentrations of OA (0, 10, 20, and 50 µM) for 48 hr to induce lipogenesis in the cells. As identified by Oil Red O and BODIPY staining, the Oil Red O-stained area and the average number of lipid droplets of BOODIPY-stained cells could be increased by OA in a dose-dependent manner (Figure 1a,b). Moreover, the concentrations of TG and total cholesterol (TC) were also concentration-dependently increased by OA treatment in both cell lines (Figure 1c,d), indicating that OA treatment could successfully induce lipogenesis in both L02 and HepG2 cells.
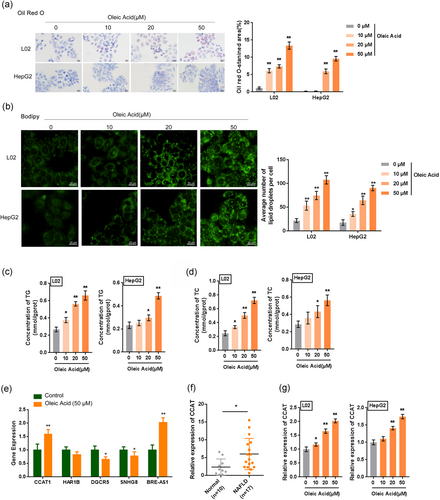
To identify the lncRNAs related to NAFLD, we selected five lncRNAs (CCAT1, HAR1B, DGCR5, SNHG8, and BRE-AS1) that showed the most differential expression in NAFLD tissues based on our previous studies (Sun et al., 2015, 2017) and examined their expression in OA-induced L02 cells. According to Figure 1e, among the five lncRNAs, CCAT1 and BRE-AS1 were the most significantly upregulated in response to 50 µM OA treatment. Moreover, CCAT1 has been reported to be related to liver-related disorders (Deng et al., 2015; Dou et al., 2017; H. Zhu et al., 2015; H. Q. Zhu et al., 2015). Similarly, CCAT1 expression was significantly upregulated in 17 NAFLD tissue samples (Figure 1f). Thus, CCAT1 was selected for further experiments. Meanwhile, the expression of CCAT1 could be concentration-dependently upregulated by OA treatment in both L02 and HepG2 cells (Figure 1g). The upregulation of CCAT1 suggests that CCAT1 plays a potential role in OA-induced lipogenesis in vitro.
3.2 Effects of CCAT1 silencing on lipid droplet formation in L02 and HepG2 cells
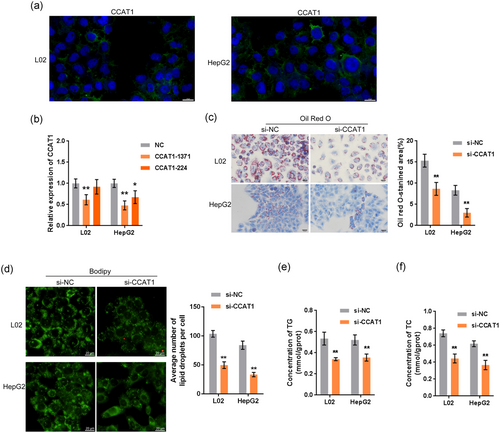
To investigate the effects of CCAT1 on lipogenesis, first, we performed the fluorescence in situ hybridization to determine the cytoplasmic location of CCAT1 (Figure 2a). We transfected L02 and HepG2 cells with si-CCAT1-1371 or si-CCAT1-244 to conduct CCAT1 silencing and performed real-time PCR to verify the transfection efficiency (Figure 2b). Because si-CCAT1-1371 was more efficient than si-CCAT1-244, we carried out further experiments with this siRNA. Next, we transfected L02 and HepG2 cells with si-CCAT1 and exposed them to OA (50 µM). Then, we examined lipid droplet formation by Oil Red O and BODIPY staining and TG concentration. According to Figure 2c-f, OA-induced increases in the numbers of cellular lipid droplets, and the concentrations of TG and TC were significantly reduced by CCAT1 silencing, indicating that CCAT1 participates in OA-induced lipogenesis in vitro.
3.3 Construction of the lncRNA–mRNA coexpression network by WGCNA
First, the screening criteria of |log2 (fold change)|> 1 and p < .05 were set to select the differentially expressed lncRNAs and mRNAs. The differentially expressed lncRNAs in NAFLD tissues were chosen to draw the heatmap (Figure S1A) and the volcano plot (Figure S1C). Similarly, the differentially expressed mRNAs are presented in the heatmap (Figure S1B) and the volcano plot (Figure S1D). Subsequently, Gene Ontology (GO) term enrichment analysis was applied based on several biological functions of the differentially expressed genes identified in the microarray. We found many enriched biological processes, including organic anion transport and fatty acid metabolic processes, that may play essential roles in the progression of NAFLD (Figure S1E). Next, the Kyoto Encyclopedia of Genes and Genomes pathway analysis was performed to investigate the biological signaling pathways involved in NAFLD. According to the enrichment scores, human cytomegalovirus infection, axon guidance, and the PPAR signaling pathway were highly related to NAFLD (Figure S1F).
To investigate the mechanism of CCAT1 involvement in NAFLD, we further analyzed the differentially expressed lncRNAs and mRNAs in NAFLD tissues and constructed a coexpression network of lncRNAs–mRNAs by WGCNA. First, the power value was screened (Figure S2A). When the power value was equal to 10, the independence degree was up to 0.9, and the average connectivity degree was higher. The eigengene dendrogram and heatmap-identified groups of correlated eigengenes are presented in Figure S2B. Seven different gene coexpression modules were obtained, with black (gene number n = 43), blue (n = 1011), brown (n = 992), green (n = 59), red (n = 50), azure (n = 4099), and yellow (n = 172) showing the correlation heat map between the modules. These co-expression modules were constructed and are shown in different colors (Figure S2C). These modules ranged from large to small by the number of genes they included. Visualizing the gene network using a heatmap plot is shown in Figure S2D. By associating the genes in the module with the phenotypic data, we showed that the genes in the blue module have the most significant correlation with liver tissue phenotype (p < .0001; Figure S2E). Therefore, 1,011 genes (including CCAT1) in the blue module were selected for subsequent analysis. Six lncRNAs (including CCAT1) were selected from the blue module for a coexpression network with key genes of NAFLD lipid metabolism. A total of seven genes were significantly correlated with CCAT1: FAS, PPARA, JUN, CASP3, IL1B, NR1H3, and SDHA (R > 0.90, p < .05; Figure S2F).
3.4 CCAT1 is correlated with LXRα
As stated before, a total of seven genes were significantly correlated with CCAT1: FAS, PPARA, JUN, CASP3, IL1B, NR1H3, and SDHA (Figure S2F). Therefore, these seven genes were examined for expression in response to CCAT1 silencing in OA-treated L02 cells. According to Figure 3a, NR1H3, which encodes the LXRα protein, showed the strongest downregulation by CCAT1 silencing. Similarly, in both L02 and HepG2 cells, CCAT1 silencing significantly reduced the LXRα protein levels (Figure 3b). In summary, CCAT1 is significantly correlated with LXRα in OA-induced lipogenesis.

3.5 CCAT1 positively regulates LXRα and downstream ChREBP expression
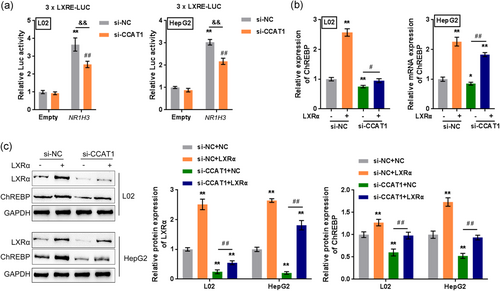
As mentioned above, CCAT1 silencing significantly decreases LXRα protein levels. Previously, LXRα/β and ChREBPα/β were shown to be key players in the transcriptional control of hepatic lipogenesis; LXRα is an important regulator of hepatic lipogenesis and ChREBPα activity upon glucose stimulation (Fan et al., 2017). Therefore, CCAT1 may affect the transcription of NR1H3 to regulate the protein level of LXRα, thus affecting ChREBP activity. To validate this speculation, we transiently transfected a luciferase construct that contained a fragment encompassing the putative LXR response elements (LXRE, 3xLXRE-LUC) into L02 and HepG2 cells with an empty plasmid/expression plasmid for human LXRα; we cotransfected L02 and HepG2 cells with si-NC/si-CCAT1 and then examined the luciferase activity. According to Figure 4a, LXRα transcription could be significantly promoted by the LXRα plasmid but inhibited by si-CCAT1 in both L02 and HepG2 cells. For further confirmation, L02 and HepG2 cells were then cotransfected with LXRα and si-CCAT1 and evaluated for the mRNA expression of ChREBP and the protein levels of LXRα and ChREBP. Figure 4b,c show that LXRα overexpression significantly increased, while CCAT1 silencing decreased ChREBP mRNA expression and the protein levels of LXRα and ChREBP in both cell lines; the effects of CCAT1 silencing could be significantly reversed by LXRα overexpression. These data indicated that CCAT1 promotes the transcription of LXRα, possibly in an LXRE-dependent manner, therefore upregulating LXRα and the downstream ChREBP mRNA and protein levels.
3.6 Dynamic effects of CCAT1 and LXRα on lipid droplet formation
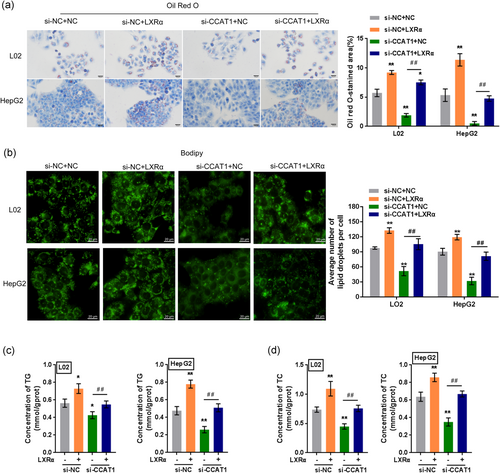
After confirming the promotive effect of CCAT1 on LXRα transcription, we next investigated the effects of the CCAT1 and LXRα combination on the formation of lipid droplets. Similarly, OA-treated L02 and HepG2 cells were cotransfected with LXRα and si-CCAT1 and then examined for lipid droplet formation by Oil Red O and BODIPY staining, TG concentration, and TC concentration. OA-induced increases in the numbers of cellular lipid droplets and the concentrations of TG and TC could be further enhanced by LXRα overexpression but suppressed by CCAT1 silencing; upon OA treatment, the effects of CCAT1 silencing could also be significantly reversed by LXRα overexpression (Figure 5a-d), indicating that CCAT1 promotes OA-induced lipogenesis through LXRα in vitro.
3.7 CCAT1 acts as a ceRNA for miR-613 to eliminate miR-613-mediated LXRα suppression
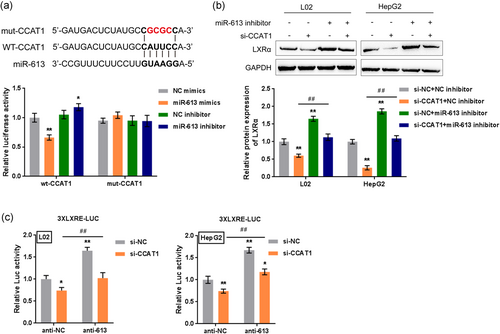
Since CCAT1 positively regulates LXRα and dynamically cooperates with LXRα to modulate OA-induced lipogenesis, we further investigated the mechanism of CCAT1 regulation of LXRα. LncRNAs act as ceRNAs; miRNAs and lncRNAs regulate each other through their binding sites to play important roles in target gene regulation (Yamamura, Imai-Sumida, Tanaka, & Dahiya, 2018). Reportedly, miR-613 could bind to the 3'-UTR of LXRα to inhibit its expression (Zhao et al., 2014; Zhong, Zhang et al., 2013) and to repress lipogenesis in HepG2 cells (Zhong, Zhang et al., 2013); an online tool predicted that CCAT1 might target miR-613. Thus, we performed a luciferase reporter assay to validate the predicted binding between CCAT1 and miR-613. Wild-type and mutant-type CCAT1 luciferase reporter vectors (wt-CCAT1 or mut-CCAT1) containing wild-type or mutated miR-613 binding sites were constructed and cotransfected into 293 T cells with miR-613 mimics or miR-613 inhibitor; the luciferase activity was determined. As shown in Figure 6a, mir-613 mimic transfection significantly suppressed, whereas miR-613 inhibitor transfection enhanced the luciferase activity of the wt-CCAT1 vector; after mutating the predicted miR-613 binding site, the changes in the luciferase activity were eliminated. Next, L02 and HepG2 cells were cotransfected with miR-613 inhibitor and si-CCAT1 and examined for the protein levels of LXRα. CCAT1 silencing significantly decreased LXRα protein levels, whereas miR-613 inhibition increased LXRα protein levels. The effects of CCAT1 silencing could be significantly reversed by miR-613 inhibition (Figure 6b), indicating that CCAT1 serves as a ceRNA for miR-613 to relieve miR-613-mediated suppression of LXRα. To further confirm these findings, we transiently transfected 3xLXRE-LUC into L02 and HepG2 cells with anti-613, a synthetic and hsa-miR-613-specific miRNA inhibitor, or anti-NC (negative control); we cotransfected L02 and HepG2 cells with si-NC/si-CCAT1 and then examined the luciferase activity in the presence of an LXRα agonist. As shown in Figure 6c, the luciferase activity was significantly suppressed by CCAT1 silencing but enhanced by miR-613 inhibition; CCAT1 silencing-induced decreases in the luciferase activity could be significantly reversed by miR-613 inhibition. These data indicated that CCAT1 binds to miR-613 to regulate the transcription of LXRα.
3.8 Dynamic effects of miR-613 and CCAT1 on lipid droplet formation
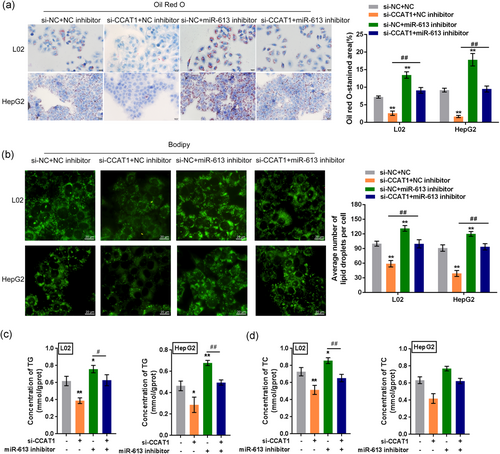
After confirming that CCAT1 is a direct downstream target of miR-613, we next investigated the dynamic effects of miR-613 and CCAT1 on the formation of lipid droplets. L02 and HepG2 cells were cotransfected with miR-613 inhibitor and si-CCAT1 under 50 µM OA treatment; next, lipid droplet formation was examined by Oil Red O and BODIPY staining, and TG and TC concentrations were examined by biochemical assays. OA-induced increases in the numbers of cellular lipid droplets and the concentrations of TG and TC could be significantly reduced by CCAT1 silencing and further enhanced by miR-613 inhibition. Under OA treatment, the effects of miR-613 inhibition were significantly reversed by CCAT1 silencing (Figure 7a-d), indicating that miR-613 inhibition enhances OA-induced lipogenesis through CCAT1 in vitro.
3.9 Expression of LXRα in tissue specimens and its relationship with CCAT1 and miR-613
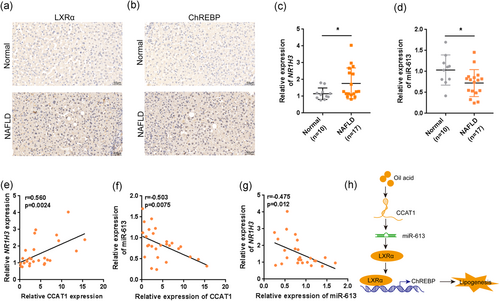
To provide further evidence for these findings, we first examined the protein levels of LXRα and ChREBP expression in the normal and NAFLD tissue samples. Both LXRα and ChREBP protein levels were higher in NAFLD tissues, compared to Normal liver tissues (Figure 8a,b). Next, we examined NR1H3 mRNA expression in tissue specimens and its correlation with CCAT1 and miR-613 expression. Similar to that of CCAT1, the expression of NR1H3 was significantly increased in NAFLD tissue specimens (Figure 8c). However, the expression of miR-613 was dramatically decreased in NAFLD tissue specimens (Figure 8d). The expression of NR1H3 in tissue specimens was positively related to the expression of CCAT1 (Figure 8e), indicating that CCAT1 enhances LXRα expression to promote lipogenesis within NAFLD. A negative correlation was observed between CCAT1 and miR-613 expression (Figure 8f) or miR-613 and NR1H3 expression (Figure 8g; p < .05).
4 DISCUSSION
NAFLD-related medicine development focuses on the following fields: medicines that regulate nuclear transcription factors, medications that target lipotoxicity and oxidative stress, and medications that regulate cellular energy homeostasis (Gastaldelli, 2017; Musso, Cassader, & Gambino, 2016). Given the complexity and heterogeneity of NAFLD, more efforts should be expended on drug development. Insulin sensitizers, such as metformin and thiazolidinedione are commonly used for those NAFLD patients who are resistant to insulin. Researchers detect the lncRNA expression changes in metformin-treated or high-fat diet mice livers. They find that the altered lncRNAs by metformin treatment can modulate NAFLD-related pathways by interacting with downstream miRNAs (Guo et al., 2018). Thus, noncoding RNAs might be novel targets for NAFLD treatment.
The expression of many lncRNAs in NAFLD samples is significantly abnormal compared to that in normal liver tissues. These abnormally expressed lncRNAs might participate in the occurrence and development of NAFLD. At the same time, some signaling pathways may be related to the occurrence and development of NAFLD. Here, we identified lncRNA CCAT1, which has been reported to be related to liver disorders, as a significantly upregulated lncRNA in NAFLD. CCAT1 expression increased during OA-induced lipid droplet formation. CCAT1 silencing significantly suppressed lipid droplet accumulation and TG and TG concentrations in vitro. Among the differentially expressed mRNAs, LXRα is a lipid metabolism-related gene and was positively correlated with CCAT1. By increasing the transcription of LXRα, CCAT1 promoted LXRα and downstream ChREBP expression, subsequently enhancing OA-induced lipid droplet formation. Regarding the molecular mechanism, CCAT1 serves as a ceRNA for miR-613 to relieve miR-613-mediated suppression of LXRα. miR-613 inhibition enhanced OA-induced lipid droplet formation and increased the TG and TC concentrations; the effects of miR-613 inhibition were significantly reversed by CCAT1 silencing, indicating that miR-613 modulates OA-induced lipid droplets through CCAT1.
The pathogenesis of NAFLD is still under investigation, but lipid accumulation, especially the filtration of triglycerides into liver cells, is regarded as the first step in the process of NAFLD (Dowman, Tomlinson, & Newsome, 2010). Therefore, fat accumulation plays a crucial role in NAFLD. Herein, OA induced significant increases in lipid droplet accumulation and TG concentration in both L02 and HepG2 cells, indicating the successful construction of the NAFLD model in vitro. Interestingly, the expression of a previously reported upregulated lncRNA in NAFLD liver samples, CCAT1, was also significantly induced by OA treatment, indicating that CCAT1 might play a role in lipid droplet formation in vitro and NAFLD in vivo. As expected, CCAT1 silencing in L02 and HepG2 cells dramatically suppressed OA-induced increases in lipid droplet accumulation and TG and TC concentrations. These findings indicated that CCAT1 silencing could improve OA-induced NAFLD in vitro.
To investigate the mechanism of CCAT1 function in NAFLD, we further analyzed the differentially expressed protein-coding RNAs in NAFLD livers. Via microarray analysis and WGCNA, we identified a total of seven mRNAs—FAS, PPARA, JUN, CASP3, IL1B, NR1H3, and SDHA, which were positively correlated with CCAT1. Upon CCAT1 silencing, NR1H3 was the most significantly inhibited. NR1H3 encodes LXRα, one of the two LXR homologous isoforms. In response to CCAT1 silencing, the protein levels of LXRα were significantly decreased in both L02 and HepG2 cells, indicating that LXRα might be involved in CCAT1 functions in NAFLD. LXRα is considered one of the nuclear receptors. These nuclear receptors are ligand-activated transcription factors that directly regulate transcriptional activities and epigenetic variation to modulate the expression of multiple genes (Ahn, Jang, Jun, Lee, & Shin, 2014). LXRα shows high expression in the liver and is also abundantly expressed in other tissues closely related to lipid metabolisms, such as macrophages, small intestine, adipose tissue, adrenal gland, kidney, and lung (Grefhorst et al., 2002). In humans, hepatic LXR expression has been shown to increase with increasing severity of NAFLD (Ahn et al., 2014). Consistently, we found that LXRα overexpression significantly enhanced OA-induced lipid droplet accumulation and TG concentration and reversed the effects of CCAT1 silencing in vitro, indicating that CCAT1 could cooperate with LXRα to affect lipid droplet formation. Notably, among the seven genes positively correlated with CCAT1, there was PPARA, which encodes the peroxisome proliferator-activated receptor α (PPARα). This ligand-activated transcription factor is abundantly expressed in the liver (Kersten & Stienstra, 2017). Considering that the expression of PPARA in human liver is reduced in patients with NAFLD and that PPARα agonists may hold promise as a therapy for NAFLD (Kersten & Stienstra, 2017), PPARA might also participate in the role of CCAT1 in lipid droplet formation, which needs further investigation in our future research.
Endogenous LXR ligands are oxidized cholesterol derivatives and oxysterols. The LXRs form obligate heterodimer response elements (LXREs) in target genes containing direct repeats (DR) of the prototypical sequence AGGTCA separated by four nucleotides (DR4) or by one nucleotide (DR1); an inverted repeat separated by one nucleotide has also been identified as an LXRE (Varga & Su, 2007). After activation by endogenous ligand oxidative sterols or synthetic ligands, LXRs form a heterodimer with retinoid X receptor (RXR), namely, LXR/RXR, which then functions as a transcription factor; subsequently, the transcription of the target gene is regulated by binding to LXRE (Varga & Su, 2007). LUC assays revealed that CCAT1 silencing significantly suppressed the transcription of LXRα. Moreover, CCAT1 silencing significantly decreased, while LXRα plasmid transfection increased, the protein level of LXRα, and the expression of the LXRα downstream Factor ChREBP. The effects of CCAT1 silencing could be significantly reversed by LXRα overexpression, indicating that CCAT1 promotes the transcription of LXRα, possibly in an LXRE-dependent manner, thereby modulating lipid droplet formation.
As mentioned previously, lncRNAs could compete with mRNAs for miRNA binding to counteract miRNA-mediated suppression on mRNAs (Yamamura et al., 2018). LXRα was previously reported to be a direct downstream target of multiple miRNAs, including miR-1 (Cheng et al., 2018; Zhong, Huang et al., 2013), miR-206 (Zhong, Huang et al., 2013), miR-155 (Kurowska-Stolarska et al., 2017), miR-205 (Cui et al., 2018), and miR-613 (Zhao et al., 2014; Zhong, Zhang et al., 2013). Interestingly, miR-613 also dramatically suppressed LXRα target genes, including sterol-regulatory element-binding protein 1c (SREBP-1c), FAS, ChREBP and acetyl-CoA carboxylase (ACC). Moreover, miR-613 significantly repressed LXRα-induced lipid droplet accumulation in HepG2 cells (Zhong, Zhang et al., 2013). Herein, online tool prediction and later experimental analyses indicated that miR-613 is a direct downstream target of CCAT1, CCAT1 significantly relieves miR-613-mediated suppression of LXRα via serving as a ceRNA for miR-613. More important, miR-613 inhibition significantly enhanced OA-induced lipid droplet formation and the concentrations of TG and TC, while CCAT1 silencing exerted the opposite effects; the effects of miR-613 inhibition were reversed considerably by CCAT1 silencing, indicating that miR-613 exerts its effects by targeting CCAT1.
To provide further evidence of these findings, we examined NR1H3 and miR-613 expression in normal and NAFLD tissue specimens. Similar to the cellular expression pattern, the expression of NR1H3 was significantly increased, whereas miR-613 expression was decreased in NAFLD tissues. In tissue samples, NR1H3 and CCAT1 were positively correlated, whereas miR-613 was negatively correlated with NR1H3 and CCAT1. In conclusion, CCAT1 serves as a ceRNA to compete with NR1H3 for miR-613 binding, thereby enhancing LXRα transcription in an LXRE-dependent manner and promoting lipid droplet formation and NAFLD. The CCAT1/miR-613/LXRα axis might be a potent target for NAFLD treatment (Figure 8h).
ACKNOWLEDGMENT
This work was supported by the National Natural Science Foundation of China (81600461).
CONFLICT OF INTERESTS
The authors declare that there are no conflict of interests.
AUTHOR CONTRIBUTIONS
Molecular experiments operation: F. H., H. L., and Z. L.; Animal experiments operation: Z. L., T. Z., M. Y., and K. Z.; Manuscript writing: F. H.; Project supervision and manuscript editing: C. S.
Open Research
DATA AVAILABILITY STATEMENT
Please contact the authors for data requests.


