BDNF Val66Met polymorphism alters food intake and hypothalamic BDNF expression in mice
Abstract
Obesity, a rising public health burden, is a multifactorial disease with an increased risk for patients to develop several pathological conditions including type 2 diabetes mellitus, hypertension, and cardiovascular disease. Increasing evidence suggests a relationship between the human brain-derived neurotrophic factor (BDNF) Val66Met single-nucleotide polymorphism (SNP) and obesity, although the underlying mechanisms of this connection are still not completely understood. In the present study, we found that homozygous knock-in BDNFMet/Met mice were overweight and hyperphagic compared to wildtype BDNFVal/Val mice. Increased food intake was associated with reduction of total BDNF and BDNF1, BDNF4 and BDNF6 transcripts in the hypothalamus of BDNFMet/Met mice. In contrast, in the white adipose tissue total BDNF and Glut4 expression levels were augmented, while sirtuin 1 and leptin receptor (Ob-R) expression levels were reduced in BDNFMet/Met mice. Moreover, plasmatic leptin levels were decreased in BDNFMet/Met mice. However, BDNFVal/Val and BDNFMet/Met mice showed a similar response to the insulin tolerance test and glucose tolerance test. Altogether, these results suggest that BDNF Val66Met SNP strongly contributes to adipose tissue pathophysiology, resulting in reduced circulating leptin levels and hypothalamic expression of BDNF, which, in turn, promote increased food intake and overweight in BDNFMet/Met mice.
1 INTRODUCTION
Obesity is a rising public health problem worldwide, affecting a considerable part of the population across all ages, genders, and ethnic groups. Individuals with obesity are at increased risk of several health conditions including type 2 diabetes mellitus, hypertension, cardiovascular disease, osteoarthritis, cognitive decline, and cancer (Buie, Watson, Smith, & Sims-Robinson, 2019; El-Sayed Moustafa & Froguel, 2013). The pathogenesis of obesity is still not very well known and involves interactions between genetic and environmental factors. It has been estimated that genetic variants account for the 40–70% heritability of the body mass index (BMI; El-Sayed Moustafa & Froguel, 2013). Understanding the role of genetic variants in regulating the energy balance should then provide an opportunity to develop novel therapeutic strategies against obesity.
Brain-derived neurotrophic factor (BDNF) is a member of the neurotrophin family, which plays a central role in neurogenesis, differentiation, survival, and synaptic plasticity (Leal, Bramham, & Duarte, 2017; Numakawa, Odaka, & Adachi, 2018; Tornese et al., 2019). BDNF is also an anorexigenic factor that regulates food intake, body weight, and metabolism. Indeed, BDNF haploinsufficiency or missense mutations in its receptor TrkB have been associated with hyperphagia, body weight gain, and obesity both in humans and in mice (Kernie, Liebl, & Parada, 2000; Xu et al., 2003; Yeo et al., 2004). Moreover, the finding that specific deletion of BDNF in ventromedial and dorsomedial nuclei of the hypothalamus results in hyperphagic behavior and obesity has suggested that hypothalamus is the major target of BDNF in regulating appetite (Unger, Calderon, Bradley, Sena-Esteves, & Rios, 2007), although a role for muscle-derived BDNF in controlling metabolic adaptation has been recently proposed in female mice (Yang et al., 2019). Importantly, a negative correlation between plasma BDNF levels, body weight, and BMI has been found in humans (Lommatzsch et al., 2005). Reduced serum BDNF levels have also been reported in humans with metabolic disorders, such as type 2 diabetes mellitus, independent of the presence of obesity (Krabbe et al., 2007). Moreover, lower serum BDNF levels were found in female patients with eating disorders, such as anorexia nervosa and bulimia nervosa, compared to control individuals (Saito, Watanabe, Hashimoto, & Saito, 2009). These findings in obese subjects were, however, not replicated by others and remain controversial (Pillai et al., 2012; Sandrini et al., 2018b).
The BDNF Val66Met genetic variant, which causes the substitution of a valine (Val) with a methionine (Met) at codon 66 of pro-BDNF, has been associated with cognitive dysfunction, neuropsychiatric and cardiovascular disorders (Amadio et al., 2017; Dincheva, Glatt, & Lee, 2012; Egan et al., 2003; Notaras, Hill, & van den Buuse, 2015). Several studies have also found an association between the Val66Met polymorphism of BDNF and eating disorders, obesity, and insulin resistance, although other studies failed to replicate these associations. The BDNF Val66Met is a common polymorphism, with a frequency of 20–30% for the heterozygous and about 4% for the homozygous genotype in the Caucasian population. However, it is more frequent in the Asian population, with 50% for heterozygous and about 20% for homozygous (Pivac et al., 2009; Shimizu, Hashimoto, & Iyo, 2004). Interestingly, a knock-in mouse carrying the BDNF Val66Met human single-nucleotide polymorphism (SNP) has been shown to recapitulate the phenotypic hallmarks of humans including anxiety, cognitive impairments, cardiovascular disorders and overweight (Amadio et al., 2017; Chen et al., 2006; Sandrini, Ieraci, et al., 2018; Wang et al., 2014). These alterations are associated with a pro-inflammatory profile and gene expression modifications both in central and peripheral tissues (Mallei et al., 2018; Sandrini et al., 2019; Wang et al., 2014). However, little is known regarding the feeding behavior of BDNFMet/Met mice and the insulin resistance phenotype.
Besides BDNF, several other factors and pathways have been implicated in the regulation of food intake and metabolism, either at the peripheral or central level, such as leptin, neuropeptide Y (NPY), proopiomelanocortin (POMC), insulin signaling, sirtuin 1 (SIRT1), peroxisome proliferator-activated receptor-γ coactivator 1α (PGC1α, etc.; Bost & Kaminski, 2019; Cakir et al., 2009; Moraes-Vieira, Saghatelian, & Kahn, 2016; Sestan-Pesa & Horvath, 2016; Valassi, Scacchi, & Cavagnini, 2008). However, whether these genes are differentially regulated in the hypothalamus and white adipose tissue (WAT) by the presence of BDNF Val66Met SNP is currently unknown.
Therefore, the aim of this study was to investigate the relationship between the Val66Met polymorphism and obesity, feeding behavior and hypothalamic gene expression, and to assess insulin resistance in BDNFMet/Met mice.
2 MATERIALS AND METHODS
2.1 Mice
Wild-type BDNFVal/Val and homozygous BDNFMet/Met mice were originally generated in the laboratory of Francis Lee (Chen et al., 2006). Adult male 2–4 months old mice were used in all the experiments. The mice were housed under standard conditions (20–22°C, 12 hr light/dark cycle) with water and food ad libitum. All efforts were made to minimize animal distress and to reduce the numbers of animals used in this study. Mice were killed by cervical dislocation, and the hypothalami and the epidydimal white adipose tissue were dissected, immediately frozen in dry ice and stored at −80°C as previously described (Macchi et al., 2017; Sandrini et al., 2019). All animal procedures were conducted according to current regulations for animal experimentation in Italy and the European Union; and were approved by the Italian Ministry of Health. All experimental procedures involving animals were conducted according to the European Community Council Directive 86/609/EEC and were approved by the National Ministry of Health (#349/2015).
2.2 High-fat diet (HFD)
Eight/ten-week old BDNFVal/Val and BDNFMet/Met mice were singly housed with unrestricted access to a standard diet (SD; 10% calories from fat; Research Diet INC D12450H) or high-fat diet (HFD; 45% calorie from fat; Research Diet INC D12451) for 2 months. The total amount of food intake was measured every other day.
2.3 RNA isolation and reverse transcription
RNA isolation and reverse transcription were performed as previously described (Mallei, Ieraci, & Popoli, 2019). Briefly, total RNA from the hypothalamus and white adipose tissue was extracted using the Direct-zolTM RNA MiniPrep (Zymo Research, purchased by Euroclone, Milan, Italy) and cDNA was synthesized using the iScript kit (Biorad, Milan, Italy) according to manufacturer's instructions.
2.4 Real-time polymerase chain reaction (PCR)
Real-Time PCR analysis was performed on a CFX Connect Real-Time System (Biorad) using the iTaq Universal SYBR Green supermix (Biorad), as previously described (Mallei, Ieraci, & Popoli, 2019). Primer sequences are described in Table 1. Quantitative PCR (qPCR) conditions were: 3 min at 95°C, 40 cycles of 10 s at 95°C, 30 s at 60°C. The relative expression of messenger RNA (mRNA) was calculated with the comparative CT (ΔΔCT) method using RPS18 and GAPDH as endogenous control genes. The relative mRNA levels were expressed as fold change. Melting curve analysis was performed to verify the specificity of the PCR products.
| Gene | Forward | Reverse |
|---|---|---|
| BDNF-1 | CCTGCATCTGTTGGGGAGAC | CGCCTTCATGCAACCGAAGTAT |
| BDNF-4 | CAGAGCAGCTGCCTTGATGTTT | CGCCTTCATGCAACCGAAGTAT |
| BDNF-6 | ACAATGTGACTCCACTGCCGG | CGCCTTCATGCAACCGAAGTAT |
| BDNF | TCGTTCCTTTCGAGTTAGCC | TTGGTAAACGGCACAAAAC |
| TrkB | CTCAAGTTGGCGAGACATTCCAAG | GGGGGTTTTCAATAACAGGAATCT |
| NPY | CAGAGGACATGGCCAGATACTAC | AAATCAGTGTCTCAGGGCTGGA |
| POMC | GATGCCGAGATTCTGCTACAG | AGGTTGCTCTCCGTGGTGA |
| ObR | AGGAATCGTTCTGCAAATCCA | ATGCCAGGTTAAGTGCAGCTATC |
| PGC-1α | TGAGCGAACCTTAAGTGTGGAA | GGGTTATCTTGGTTGGCTTTATGA |
| SIRT1 | AGCAGGTTGCAGGAATCCAA | CACGAACAGCTTCACAATCAACTT |
| InsR | TTTGTCATGGATGGAGGCTA | CCTCATCTTGGGGTTGAACT |
| IRS1 | CAAGACGCTCCAGTGAGGAT | GGAGGATTTGCTGAGGTCAT |
| GLUT4 | GCATCCGCAACATACTGGAA | CATGGCTGTCGCTGGTTTCT |
| GAPDH | CGTGCCGCCTGGAGAAACC | TGGAAGAGTGGGAGTTGCTGTTG |
| Rps18 | TGGAGCGAGTGATCACCATCA | CCTCACGCAGCTTGTTGTCTA |
2.5 Leptin
Plasma was prepared, after centrifugation, from blood collected into sodium citrate from anesthetized mice by cardiac venipuncture as previously described (Sandrini et al., 2017), and immediately stored at −80°C until leptin analyses. Leptin was measured by ELISA kit (Leptin Mouse ELISA Kit, Invitrogen).
2.6 Glucose tolerance and insulin tolerance tests (GTT and ITT)
GTT: Mice were fasted overnight (12–16 hr), weighed and blood glucose was measured by snipping the tail and using a glucometer (One-Touch Ultra). Glucose solution (2 g/kg body weight) was injected intraperitoneally and glycemia measured before the injection and after 20, 40, 60, 120 min. ITT: Mice were fasted for 4 hr, weighed and blood glucose was measured as previously described (Da Dalt et al., 2019). Insulin solution (0.2 IU/kg body weight) was injected in the intraperitoneal cavity and mice were bled as described above before and after 20, 40, 60, 120 min. The area under the curve (AUC) was calculated for glucose clearance following GTT or ITT.
2.7 Statistical analysis
Statistical analyses were performed using GraphPad Prism 6 (GraphPad Software, La Jolla, CA). Data are presented as mean ± standard error of the mean (SEM). Statistical analyses were made using a two-tail unpaired t-test or a two-way analysis of variance (ANOVA) with genotype and age as main factors. Fischer's LSD post hoc test was used for multiple comparison analysis when appropriate. A value of p < .05 was considered statistically significant.
3 RESULTS
3.1 BDNFMet/Met mice show higher body weight and are hyperphagic
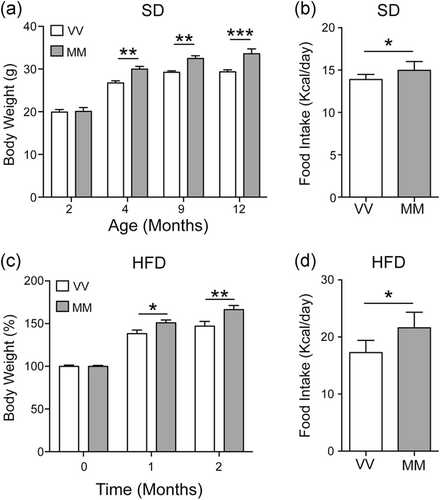
Two months old BDNFVal/Val and BDNFMet/Met mice, feeding with regular chow diet, had similar total body weight (Figure 1a). However, starting from 4 months of age, BDNFMet/Met mice showed a significantly higher body weight compared to BDNFVal/Val mice (p < .05; Figure 1a). BDNFMet/Met mice displayed higher food intake than BDNFVal/Val mice (p < .05; Figure 1b). Moreover, BDNFMet/Met mice fed with HFD gained body weight significantly faster (p < .05; Figure 1c) and consumed also more food than BDNFVal/Val mice (p < .05; Figure 1d).Gene expression of BDNF transcripts and glucose pathway is differentially expressed in the hypothalamus and white adipose tissue of BDNFMet/Met mice.

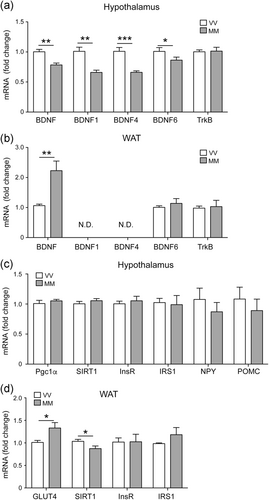
To assess whether the increase of food intake and body weight observed in BDNFMet/Met mice was associated with alteration of hypothalamic and WAT, we measured the mRNA levels of genes involved in food intake and glucose metabolism. The mRNA levels of total BDNF and BDNF1, BDNF4 and BDNF6 transcripts were reduced in the hypothalamus of BDNFMet/Met mice compared to BDNFVal/Val mice, while the expression levels of TrkB was not affected (Figure 2a). In contrast, the expression level of total BDNF was higher in the WAT of BDNFMet/Met mice compared to BDNFVal/Val mice, whereas BDNF6 and TrKB levels were similar in the two genotypes (Figure 2b). In WAT, the expression of BDNF1 and BDNF4 transcripts was very low and not detectable by real-time PCR analysis. In addition, the expression of SIRT1 was reduced in BDNFMet/Met WAT, but not in the hypothalamus, while GLUT4 was increased in the WAT of BDNFMet/Met mice (Figure 2c,d). Hypothalamic levels of NPY, POMC, InsR, IRS1 and WAT levels of InsR, IRS1 were unaltered in BDNFMet/Met mice compared to BDNFVal/Val mice (Figure 2c,d)

3.2 Plasma leptin is reduced in BDNFMet/Met mice
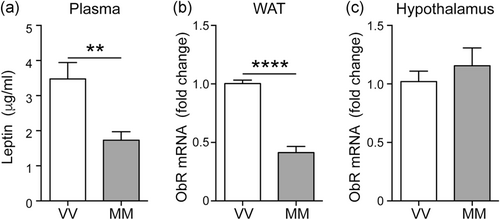
As leptin plays a key role in food intake, we also assessed circulating leptin levels as well as gene expression of its receptor (ObR) in the hypothalamus and WAT. Plasma levels of leptin were decreased in BDNFMet/Met mice as was the case for the ObR mRNA levels in WAT, while ObR expression was unaltered in the hypothalamus of BDNFMet/Met mice (Figure 3a–c).

3.3 Glucose metabolism is not altered in BDNFMet/Met mice
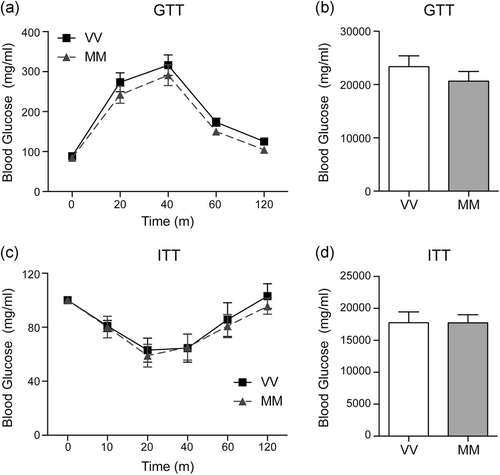
To assess whether BDNF Val66Met polymorphism affects insulin sensitivity, we performed GTT and ITT. The peak glucose levels were reached 40 min following glucose administration and the levels returned to nearly basal level after 120 min in both BDNFVal/Val and BDNFMet/Met mice (Figure 4a). Following insulin injection, the glucose levels rapidly decreased reaching minimum levels after 20 min and returning to basal levels at 120 min in both BDNFVal/Val and BDNFMet/Met mice (Figure 4c). AUC of both GTT and ITT was not affected by BDNF Val66Met polymorphism (Figure 4b,d).

4 DISCUSSION
Although converging evidence has associated the BDNF Val66Met SNP with obesity and eating disorders, in both human and mouse models, the mechanisms underlying the body weight increase in the presence of the BDNF Met homozygosity remain to be clarified. In the current study, we observed that homozygous knock-in BDNFMet/Met mice were hyperphagic and displayed a reduction of total BDNF and specific BDNF transcripts in the hypothalamus compared to wildtype BDNFVal/Val mice. In addition, plasma leptin levels and ObR mRNA levels in the WAT were reduced in BDNFMet/Met mice. In contrast, the expression of total BDNF and Glut4 was augmented, while that of SIRT1 was reduced, in the WAT of BDNFMet/Met mice. Finally, we did not find any significant difference in glucose metabolism dynamics.
BDNF and its receptor TrkB play a key role in the neural circuitry, controlling food intake and body weight. Indeed, previous results have shown that global BDNF haploinsufficiency, brain-specific BDNF depletion, or TrkB hypomorphic expression in mice result in severe hyperphagia and obesity (Camerino et al., 2012; Kernie et al., 2000; Liao et al., 2012; Rios, 2013; Xu et al., 2003). In line with this evidence, we found that the hyperphagic and overweight phenotypes observed in BDNFMet/Met mice are associated with reduction of total BDNF, and specifically BDNF1, BDNF4, and BDNF6 transcripts in the hypothalamus. The BDNF gene has a complex structure of nine different noncoding 5′ exons, each one controlled by its own promoter, alternatively spliced to one 3′ common exon encoding for the pro-BDNF protein. BDNF transcripts are differentially regulated by different stimuli in specific brain regions, cell types, and subcellular compartments (Aid, Kazantseva, Piirsoo, Palm, & Timmusk, 2007; Lyons & West, 2011; Musazzi et al., 2014). In particular, select BDNF transcripts are specifically segregated within the soma (BDNF1 and BDNF4), while others are translocated to distal dendrites (BDNF2 and BDNF6), therefore working as a spatial code for transcript localization (Baj et al., 2013; Baj, Leone, Chao, & Tongiorgi, 2011; Mallei et al., 2015). In line with this, it was shown that the lack of BDNF mRNA in the dendrites of ventral medial hypothalamic neurons, rather than the general decrease of BDNF in neurons, promotes obesity in mice (Liao et al., 2012), thus suggesting that reduction of BDNF6 can play a role in determining the hyperphagic phenotype here described in BDNFMet/Met mice. For this reason, future studies will be necessary to address the contribution of the somatic and dendritic BDNF transcript in food intake. In addition, as TrkB is expressed in the arcuate nucleus, it could act through the regulation of two functionally distinct populations of neurons that contain neuropeptide Y or proopiomelanocortin, thus promoting and inhibiting feeding (Cone et al., 2001; Xu et al., 2003).
In contrast to the reduced levels of BDNF transcripts in the hypothalamus, total BDNF levels were upregulated in the WAT, while BDNF6 transcript levels were unchanged, and BDNF1 and BDNF4 levels were undetectable by real-time PCR analysis. In line with this finding, increased expression of BDNF has been reported in obese mice, although it is currently not well-defined if this upregulation is due to the increased macrophage infiltration in adipose tissue, the hyperplasic immature-like phenotypes of the adipocytes, or both (Nakagomi et al., 2015; Sandrini et al., 2019). Interestingly, although it has been speculated that the BDNF/TrkB signal in the adipose tissue positively regulates the appetite, in contrast to the negative regulation in the hypothalamus, the impact of BDNF in the feeding behavior of the adipose tissue appears to be relatively small compared to its anorexigenic role in the hypothalamus (Nakagomi et al., 2015).
In this complex scenario, the role of leptin, a hormone predominantly produced and secreted from WAT, that is also able to regulate the expression of BDNF, should not be underestimated. Peripheral leptin administration increases the BDNF content in the ventromedial nucleus and the dorsal vagal complex, as well as reduced hypothalamic BDNF expression in db/db leptin receptor mutant mice has been reported (Bariohay, Lebrun, Moyse, & Jean, 2005; Komori, Morikawa, Nanjo, & Senba, 2006). This evidence seems to be in line with our findings showing reduced circulating levels of leptin and reduced expression of hypothalamic BDNF. We have previously reported that changes in adipocyte shape of epididymal WAT in BDNFMet/Met mice might be due to hyperplasia or expansion of the small cell population, a hypothesis also supported by the higher expression of α2-adrenergic receptor in WAT, which associates with both adipose tissue hyperplasia and a drop in the lipolytic activity (Sandrini et al., 2019; Valet et al., 2000). Adipocyte volume, but not percent body fat, is directly proportional to leptin secretion and serum leptin concentrations (Skurk, Alberti-Huber, Herder, & Hauner, 2007). Therefore, small adipocytes in the BDNFMet/Met mice may secrete less leptin, thus explaining the reason why we detected a decrement in leptin levels, although BDNFMet/Met mice were overweight. This phenotype was previously described and confirmed here until the age of 12 months (Chen et al., 2006; Sandrini et al., 2019). The presence of small adipocytes might be traced back to hyperplasia or expansion of the small cell population, which is a mechanism of defense that the adipose tissue can undergo in obesity after a threshold of hypertrophy is reached (Valet et al., 2000). In addition, we found a reduction of ObR mRNA levels in the WAT of overweight BDNFMet/Met mice, a result consistent with previous studies showing a decreased ObR expression in the adipose tissue of both experimental animal models and obese subjects (Priego, Sánchez, Palou, & Picó, 2009; Séron et al., 2006). Selective downregulation of ObR in the adipocytes has been also correlated to obesity and type 2 diabetes (Huan et al., 2003). However, whether these altered expression/releases are due to the presence of the Val66Met polymorphism and/or as an obesity consequence is currently unknown and future studies will be necessary to better clarify these mechanisms.
WAT is an endocrine organ responsible for the synthesis and release of different hormones and factors regulating several processes including food intake, energy expenditure, metabolism homeostasis, immunity, and blood pressure homeostasis (Moraes-Vieira et al., 2016). Here we specifically found that in the WAT, but not in the hypothalamus, the expression of GLUT4 is upregulated while the expression of SIRT1 is reduced in BDNFMet/Met mice. An important role of GLUT4 in the adipocytes is the regulation of lipid and glucose homeostasis. The reduction of GLUT4 expression, one of the earliest events in the pathogenesis of insulin resistance, has been reported in the adipocytes of obese or diabetic humans and rodents (Moraes-Vieira et al., 2016). Our results, showing upregulation of the GLUT4 mRNA in the WAT of BDNFMet/Met mice, is somewhat unexpected, but in line with the increased expression of BDNF in the WAT. Indeed, in the gastrocnemius muscle, GLUT4 protein expression was reported to be significantly raised by BDNF treatment (Suwa et al., 2010). Considering that in the brain, a bidirectional effect between GLUT4 and BDNF has been described (Pearson-Leary & McNay, 2016), our findings deserve further investigation to rule out the role and mechanisms beyond these changes.
Concerning the relationship between BDNF and SIRT1, a tight liaison has been previously reported by our group, that is a reduced BDNF activity in BDNFMet/Met mice was associated with a decrement in the expression of SIRT1 (Amadio et al., 2017). Dysregulation of the SIRT1 pathway has major implications in the development of obesity and related metabolic diseases following a continuous pattern that inversely follows the whole spectrum of adiposity (Mariani et al., 2018). Visceral adiposity negatively correlates with SIRT1 expression and inversely associates with ectopic fat distribution in patients affected by obesity (Mariani et al., 2015, 2016). Looking at food intake, in BDNFMet/Met mice, the role of SIRT1 at the hypothalamic level does not seem to play a central role, that is SIRT1 which regulates food intake through the central melanocortin signaling (Cakir et al., 2009), in our model, is unchanged.
Relative to food intake regulation, despite the low plasma leptin levels, the mRNA levels of NPY and POMC were unaffected in BDNFMet/Met mice. This apparent discrepancy may be accounted for by the fact that as NPY and POMC are expressed only in a subpopulation of hypothalamic neurons, by analyzing the expression levels of NPY and POMC in the whole hypothalamus, we could have missed some possible differences. Future studies will be required to verify this hypothesis. Moreover, it would be even more important to analyze whether in older overweight BDNFMet/Met mice, plasma leptin levels are still lower, or, conversely, increased compared to wildtype BDNFVal/Val mice. It is worth noting that leptin not only controls feeding behavior and metabolism but also regulates hippocampus-dependent learning and memory and lately it has been reported to also have some anti-depressant properties (Harvey, 2007). Remarkably, BDNFMet/Met mice not only are hyperphagic, but also show different types of memory impairments and a depressive-like phenotype (Amadio et al., 2017; Chen et al., 2006; Notaras, Du, Gogos, van den Buuse, & Hill, 2017; Yu et al., 2012). Altogether, these pieces of evidence may suggest that reduced leptin levels may account for some of the behavioral abnormalities reported in BDNFMet/Met mice.
The evidence that GTT and ITT did not differ between genotypes excludes either an impaired glucose secretion or an insulin sensitivity deficit (Da Dalt et al., 2019). Furthermore, baseline levels of glycemia were similar between groups. Of course, the lack of availability of circulating insulin levels represents a limitation of this study.
Although we are not able to unravel the complex scenario linking the overweight phenotype associated with the presence of BDNF Val66Met polymorphism, our data demonstrated that reduction in leptin levels, possibly due to the impact of BDNF on adipogenesis (Sandrini et al., 2019), can reduce the hypothalamic expression of BDNF, finally leading to a rise in food intake and body weight in BDNFMet/Met mice.
ACKNOWLEDGMENTS
We thank Alessandra Mallei for some preliminary experiments. Original BDNF Val66Met mice were provided by Francis S. Lee. This study was supported by grants MIUR (PRIN 2010N8PBAA) to MP, and Fondazione CARIPLO (2015-0552 and 2018-0511) to MR and is part of the collaborative consortium “Italian Network on BDNF” (InBDNF).
CONFLICT OF INTERESTS
The authors declare that there are no conflict of interests.
AUTHOR CONTRIBUTIONS
A. I., S. S. B., and M. R. designed the concept. A. I., S. S. B., C. M., P. A., L. S., and M. R. performed experiments. A. I., S. S. B., and M. R. analyzed the data. A. I. and M. R. prepared and wrote the original draft. S. S. B, P. M. and M. P. critically revised the manuscript. All the authors read and approved the final manuscript.
Open Research
DATA AVAILABILITY STATEMENT
The data that support the findings of this study are available from the corresponding author upon reasonable request.


