Impaired actin filaments decrease cisplatin sensitivity via dysfunction of volume-sensitive Cl− channels in human epidermoid carcinoma cells
Abstract
Cisplatin is a widely used platinum-based anticancer drug in the chemotherapy of numerous human cancers. However, cancer cells acquire resistance to cisplatin. So far, functional loss of volume-sensitive outwardly rectifying (VSOR) Cl− channels has been reported to contribute to cisplatin resistance of cancer cells. Here, we analyzed protein expression patterns of human epidermoid carcinoma KB cells and its cisplatin-resistant KCP-4 cells. Intriguingly, KB cells exhibited higher β-actin expression and clearer actin filaments than KCP-4 cells. The β-actin knockdown in KB cells decreased VSOR Cl− currents and inhibited the regulatory volume decrease (RVD) process after cell swelling. Consistently, KB cells treated with cytochalasin D, which depolymerizes actin filaments, showed smaller VSOR Cl− currents and slower RVD. Cytochalasin D also inhibited cisplatin-triggered apoptosis in KB cells. These results suggest that the disruption of actin filaments cause the dysfunction of VSOR Cl− channels, which elicits resistance to cisplatin in human epidermoid carcinoma cells.
1 INTRODUCTION
Acquired resistance to anticancer drugs is one of the major problems in cancer therapy. So far, a variety of resistance mechanisms have been proposed (Kartalou & Essigmann, 2001; Rabik & Dolan, 2007; Siddik, 2003). Recently, the resistance to cisplatin, a well-known platinum-based chemotherapeutic drug, is suggested to be dependent on volume-sensitive outwardly rectifying (VSOR) Cl− channel activities (Jentsch, Lutter, Planells-Cases, Ullrich, & Voss, 2016; Lee et al., 2007; Shimizu, Lee, Ise, & Okada, 2008) that play pivotal roles in cell volume regulation after cell swelling and initial cell shrinkage during apoptotic induction (Okada et al., 2001; Okada et al., 2019; Pedersen, Okada, & Nilius, 2016; Shimizu, Numata, & Okada, 2004).
Cisplatin-resistant KCP-4 cells established from human epidermoid carcinoma KB cells have been utilized to investigate the mechanism of acquired cisplatin resistance (Fujii et al., 1994). Although KB cells are highly sensitive to cisplatin, KCP-4 cells have low cisplatin sensitivity. We previously found that KCP-4 cells but not KB cells lack VSOR Cl− channel activities and the regulatory volume decrease (RVD) process after cell swelling (Lee et al., 2007; Shimizu et al., 2008). Interestingly, KCP-4 cells become sensitive to cisplatin, when VSOR Cl− currents are partly rescued by treatment with a histone deacetylase inhibitor (Lee et al., 2007). These findings suggest that KCP-4 cells lack expression of some proteins that are associated with VSOR Cl− channel activities.
In the present study, we first examined the expression level of leucine-rich repeat-containing 8A (LRRC8A), an essential subunit of VSOR Cl− channels (Qiu et al., 2014; Voss et al., 2014), in KB and its cisplatin-resistant KCP-4 cells. Next, we compared protein expression patterns between KB and KCP-4 cells using two-dimensional gel electrophoresis and identified β-actin showing lower expression in KCP-4 cells by matrix-assisted laser desorption/ionization-time-of-flight/mass spectrometry (MALDI-TOF/MS) analysis. Furthermore, we investigated whether the expression and distribution of β-actin affect the VSOR Cl− channel function and the cisplatin sensitivity in KB cells.
2 MATERIALS AND METHODS
2.1 Cell culture
Human epidermoid carcinoma KB cells were grown in Eagle's minimum essential medium (Merck, Darmstadt, Germany) supplemented with 10% fetal bovine serum, 100 unit/ml penicillin, and 100 µg/ml streptomycin at 37°C in a CO2 incubator (5% CO2). Cisplatin-resistant KCP-4 cells generated from the KB cells (Fujii et al., 1994) were cultured in the medium additionally containing 23.3 µM cisplatin. When necessary, KB cells were pretreated with 100 nM cytochalasin D that disrupts actin filaments for 12 hr. In some experiments, KCP-4 cells were treated with 400 nM trichostatin A for 30 hr.
2.2 Quantitative polymerase chain reaction analysis
Total RNA was isolated from KB and KCP-4 cells with SV Total RNA Isolation System (Promega, Madison, WI) and transcribed into complementary DNA using random hexamer primers and SuperScript III reverse transcriptase (Thermo Fisher Scientific, Waltham, MA). Quantitative polymerase chain reaction (PCR) experiments were performed by SYBR Premix Ex Taq II (Takara Bio, Kusatsu, Japan) in a real-time PCR system (Mx3000P; Agilent Technologies, Santa Clara, CA). The following thermal conditions were used: an initial denaturation of 95°C for 30 s and the next 45 cycles of 95°C for 5 s and 60°C for 30 s. The designed primer pairs were as follows: for human hLRRC8A: 5′-GGGTTGAACCATGATTCCGGTGAC-3′ and 5′-GAAGACGGCAATCATCAGCATGAC-3′, for hLRRC8B: 5′-CAATATTGAGATGCTACCAG-3′ and 5′-GATGAGTAAGGTTTGACAGC-3′, for hLRRC8C: 5′-TCGGCGTGTTTGGATGTACT-3′ and 5′-TTTAGGTGGAGGCAGTGGAG-3′, for hLRRC8D: 5′-GCTTGGTCCAGAATGTTTAC-3′ and 5′-GTTCCTGCAAAGATGGCTAC-3′, for hLRRC8E: 5′-CTGCGTTCAAGGTGCTCAAA-3′ and 5′-TGGAGCTCATGATTGGGTAG-3′, and for human glyceraldehyde-3-phosphate dehydrogenase: 5′-AACCTGCCAAATATGATGAC-3′ and 5′-ATACCAGGAAATGAGCTTGA-3′.
2.3 Protein sample preparation
To obtain protein samples during cell swelling, each cell was incubated in a hypotonic solution with high K+ concentration (95 mM KCl, 4.5 mM NaCl, 1 mM CaCl2, 1 mM MgCl2, and 5 mM 2-[4-(2-hydroxyethyl)-1-piperazynyl]ethanesulfonic acid (HEPES), pH 7.3 with KOH, 205 mOsmol/kg-H2O) for 5 min. Then, the cells were treated with a low ionic strength buffer (0.5 mM MgCl2 and 10 mM Tris-HCl [pH 7.4]) added with protease inhibitors, such as 10 µg/ml phenylmethylsulfonylfluoride, 1 µg/ml leupeptin, 1 µg/ml pepstatin A, and 20 µg/ml aprotinin for 10 min on ice. After homogenization, they were twice diluted with a Tris-sucrose buffer (500 mM sucrose and 10 mM Tris-HCl [pH 7.4]). The sample was re-homogenized and centrifuged at 800g at 4°C for 10 min. The supernatant was ultra-centrifuged at 100,000g at 4°C for 90 min. The pellet comprising membrane-associated proteins was re-suspended with a twice-diluted Tris-sucrose buffer. The protein concentration of samples was quantified with the BCA Protein Assay Kit (Thermo Fisher Scientific).
2.4 Western blot analysis
The proteins suspended in sodium dodecyl sulfate polyacrylamide gel electrophoresis (SDS-PAGE) sample buffer were electrophoresed in 7.5% polyacrylamide gels and transferred to polyvinylidene fluoride membranes. The membranes were incubated with 4% Block Ace (KAC, Kyoto, Japan) dissolved in Tris-buffered saline (TBS; 150 mM NaCl and 25 mM Tris-HCl [pH 7.4]) at room temperature for 1 hr. After blocking, the membranes were reacted with primary antibodies at 4°C overnight and then with horseradish peroxidase (HRP)-conjugated secondary antibodies at room temperature for 1 hr. The antibodies were diluted with TBS containing 0.8% Block Ace. Chemiluminescent signals were detected using Western Lightning ECL Pro (PerkinElmer, Waltham, MA) with an ImageQuant LAS 4000 system (GE Healthcare, Little Chalfont, UK), and quantified using ImageJ software.
A polyclonal antibody against human LRRC8A (the peptide QRTKSRIEQGIVDRSE) was generated in rabbits according to a previous study (Voss et al., 2014). A rabbit monoclonal anti-SERCA2 ATPase antibody was obtained from Abcam (Cambridge, UK). A mouse monoclonal anti-β-actin antibody and HRP-conjugated secondary antibodies to rabbit immunoglobulin G (IgG) and mouse IgG were from Merck.
2.5 Immunocytochemistry
KB cells cultured on coverslips were fixed in 4% paraformaldehyde at room temperature for 10 min and then in methanol at −20°C for 10 min. After fixation, the cells were permeabilized in phosphate-buffered saline (PBS) with 0.1 mM CaCl2, 1 mM MgCl2, 0.3% Triton X-100%, and 0.1% bovine serum albumin. For blocking, the permeabilized cells were incubated with goat serum dilution buffer (GSDB; PBS supplemented with 300 mM NaCl, 16% goat serum, and 0.3% Triton X-100) at room temperature for 30 min. They were treated with the anti-LRRC8A antibody or the anti-β-actin antibody at room temperature for 1 hr and then reacted with Alexa Fluor 488-conjugated secondary antibodies to rabbit IgG (Abcam) or mouse IgG (Thermo Fisher Scientific) at room temperature for 1 hr, respectively. The antibodies were diluted with GSDB. Immunofluorescent images were visualized using a laser scanning confocal microscope (LSM710; Carl Zeiss, Oberkochen, Germany).
2.6 Two-dimensional electrophoresis analysis
Protein samples suspended in 2-D Rehydration/Sample Buffer (Bio-Rad, Hercules, CA) were applied onto ReadyStrip IPG strips (7 cm, pH 3-10, Bio-Rad). Isoelectric focusing (IEF) was carried out with a PROTEAN IEF cell (Bio-Rad). The strips were incubated in equilibration buffer I and II (Bio-Rad) and transferred to 9% polyacrylamide gels by SDS-PAGE. The electrophoresed gels were stained with a Coomassie Brilliant Blue (CBB) dye solution composed of CBB R-250 (Merck), 50% methanol, and 10% acetic acid for 90 min and destained with a decolorizing buffer containing 25% methanol and 7% acetic acid for 2 hr.
2.7 In-gel digestion and MALDI-TOF/MS analysis
Spots of interest were manually cut from each gel. The spotted gel was incubated in a dehydration solution including 50 mM ammonium hydrogen carbonate and 50% acetonitrile at room temperature for 10 min. The gel was dehydrated in 100% acetonitrile for 30 min and dried in a vacuum centrifuge for 15 min. The dried gel was then rehydrated in an enzyme solution composed of 10 µg/ml trypsin, 50 mM ammonium hydrogen carbonate, and 5% acetonitrile for 45 min on ice, and incubated at 37°C overnight. After digestion, the supernatant was collected by washing each gel in an extract solution including 50% acetonitrile and 5% trifluoroacetic acid and concentrated in vacuum centrifugation. After desalting with the stage tip column (C18), each sample was extracted in an elution buffer with 90% acetonitrile and 0.1% formic acid. MALDI-TOF/MS analysis was performed with a mass spectrometer (Autoflex-T1; Bruker Daltonics, Billerica, MA).
2.8 Gene silencing
Small interfering RNAs (siRNAs) targetted to human β-actin (target sequence: 5′-CCAGGCTGTGCTATCCCTGTA-3′) tagged with Alexa Fluor 488 were bought from QIAGEN (Hilden, Germany). Alexa Fluor 488-conjugated AllStars Negative Control siRNA (QIAGEN) was utilized as a control. Each siRNA was transfected into KB cells using Lipofectamine 2000 reagent (Thermo Fisher Scientific). The experiments were performed 48 hr after the transfection unless otherwise described. In patch-clamp experiments and single-cell volume measurements, transfected cells were distinguished by their fluorescence using an inverted fluorescence microscope (Eclipse TE2000-U; Nikon, Tokyo, Japan).
2.9 Patch-clamp experiments
Patch-clamp recordings were performed in a whole-cell configuration using a patch-clamp amplifier (Axopatch 200B; Molecular Devices, Sunnyvale, CA). Currents were low-pass filtered at 1 kHz and digitized at 10 kHz. Clampex and Clampfit (pClamp9.2; Molecular Devices) were used for data acquisition and data analysis, respectively. The pipette resistance was 2–4 MΩ. Before current recordings, series resistance compensation by 70% was applied. Time-dependent activation of VSOR Cl− currents was monitored every 15 s by repeatedly applying voltage pulses to ±40 mV from a holding potential of 0 mV. The voltage dependence of the currents was examined with step pulses from −100 to +100 mV in 20-mV increments. To fully activate VSOR Cl− channels, a pre-pulse of −100 mV and a post-pulse of −60 mV were combined with the step pulse.
For VSOR Cl− currents, the following solutions were used. The pipette solution (in mM) contained 110 CsCl, 2 MgSO4, 1 ethylene glycol bis(2-aminoethyl ether)-N,N,N′,N′-tetraacetic acid (EGTA), 1 Na2ATP, 10 HEPES, 15 Na-HEPES, and 50 D(−)-mannitol (pH 7.3, 300 mOsmol/kg-H2O). The isotonic bathing solution (in mM) consisted of 110 CsCl, 5 MgCl2, 12 HEPES, 7 Tris, and 110 D(−)-mannitol (pH 7.4, 340 mOsmol/kg-H2O). To prepare the hypotonic solution, D(−)-mannitol was decreased from 110 mM to 40 mM (pH 7.4, 270 mOsmol/kg-H2O).
The solutions for measuring Ca2+-activated K+ currents was as follows: the pipette solution (in mM) consisted of 140 K-gluconate, 2 MgCl2, 0.91 CaCl2, 1 EGTA, 2 Tris-ATP, 5 HEPES, and 10 D(−)-mannitol (pH 7.3 with KOH) and the bathing solution (in mM) contained 6 K-gluconate, 134 Na-gluconate, 1 MgCl2, 2 CaCl2, 5 HEPES, and 40 D(−)-mannitol (pH 7.4 with NaOH). The intracellular free Ca2+ concentration ([Ca2+]i) was set to 1 µM using CaBuf software (Prof. Guy Droogmans, KU Leuven, Belgium).
2.10 Cell volume measurements
Single-cell images were captured every 30 s by using an inverted microscope (Eclipse TE2000-U; Nikon) with a CCD camera (C2741; Hamamatsu Photonics, Hamamatsu, Japan). ImageJ software was utilized to measure the cross-sectional area of each cell. Standardized cell volume was estimated from its cross-sectional area. On the other hand, cisplatin-induced cell shrinkage was quantified with a Coulter-type cell analyzer (CDA-500; Sysmex, Kobe, JAPAN). In some experiments, the cells were pretreated with 100 nM cytochalasin D for 12 hr.
Isotonic bathing solution (in mM) contained 95 NaCl, 4.5 KCl, 1 MgCl2, 1 CaCl2, 5 HEPES, and 105 D(−)-mannitol (pH 7.3 with NaOH, 310 mOsmol/kg-H2O). In hypotonic bathing solution, D(−)-mannitol was removed (pH 7.3 with NaOH, 205 mOsmol/kg-H2O).
2.11 Cell viability assay
Cell viability was evaluated using cell counting kit-8 (Dojindo, Kumamoto, Japan). A total of 5 × 10³ cells were seeded into a 96-well plate and cultured under various conditions. When needed, the cells were pretreated with 100 nM cytochalasin D for 12 hr. The cells were exposed to cisplatin for 24 hr. Three hours after the kit solution was added into each well, the absorbance at 450 nm was measured with a multi-mode microplate reader (Filter Max F5; Molecular Devices).
2.12 Caspase-3/7 assays
Caspase-Glo 3/7 Assay System (Promega) was utilized to measure caspase-3/7 activities. Cells were cultured in a six-well plate under various conditions. As required, the cells were pretreated with 100 nM cytochalasin D for 12 hr. The cells transfected with the β-actin siRNA for 24 hr were treated with 15 µM cisplatin for 10 hr. In the assays, 2 × 10⁴ cells collected from each six-well were seeded into a 96-well plate. After incubation with the Caspase-Glo 3/7 Assay reagent for 1 hr, the luminescence was measured in a microplate reader (Filter Max F5).
2.13 Statistical analysis
Data are expressed as means ± standard error of mean of n observations. Statistical analysis was performed by the paired or unpaired Student's t test and the one-way analysis of variance with Tukey's post hoc test. A p value under .05 was considered significant.
3 RESULTS
3.1 Expression and distribution of β-actin in cisplatin-resistant KCP-4 cells and their parental KB cells
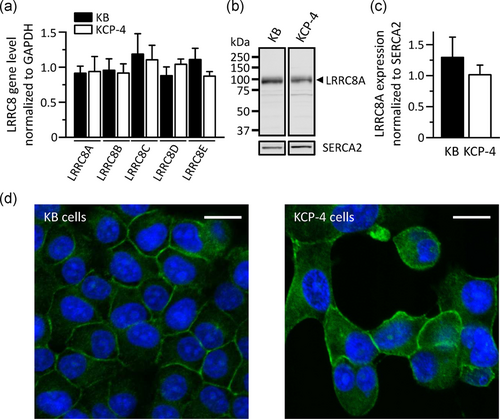
Since LRRC8 are demonstrated to be important for the function of VSOR Cl− channels (Qiu et al., 2014; Voss et al., 2014), we compared the gene expression level of the LRRC8 members between the parental KB and its cisplatin-resistant KCP-4 cells. Quantitative PCR analysis indicated that the expression level of LRRC8A to LRRC8E genes was similar in both cells (Figure 1a). Western blot analysis demonstrated that KCP-4 cells have a comparable amount of the LRRC8A protein, an essential component of VSOR Cl− channels, to KB cells (Figure 1b,c). Moreover, LRRC8A proteins were found to be localized in the plasma membrane of both cells (Figure 1d).
To investigate the differential protein expression between KB and KCP-4 cells, we performed two-dimensional gel electrophoresis analysis. Figure 2a shows representative gel images in KB and KCP-4 cells. We found that the protein in KB cells with a molecular weight of ~40 kDa and isometric point of 5.8 was highly expressed than that in KCP-4 cells, as indicated by arrows in Figure 2a. The following MALDI-TOF/MS analysis revealed that the protein corresponds to β-actin. Western blot analysis showed that KCP-4 cells express a lower level of β-actin compared with KB cells (Figure 2b,c).
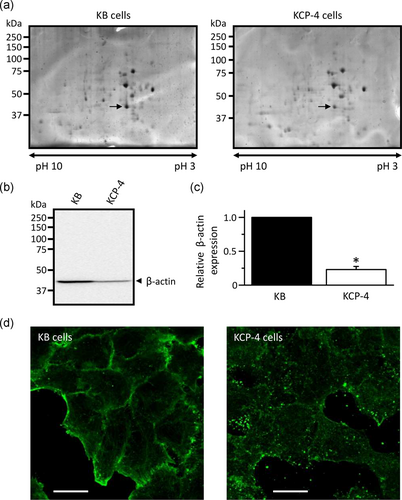
To observe the cellular distribution of β-actin, we performed immunocytochemistry in KB and KCP-4 cells (Figure 2d). KB cells showed clear actin filament networks. In contrast, a dot-like staining pattern of β-actin was surprisingly observed in KCP-4 cells. These results suggest that KCP-4 cells lack actin filament networks due to their lower β-actin expression.
3.2 Knockdown of β-actin decreases the function of VSOR CL− channels in KB cells
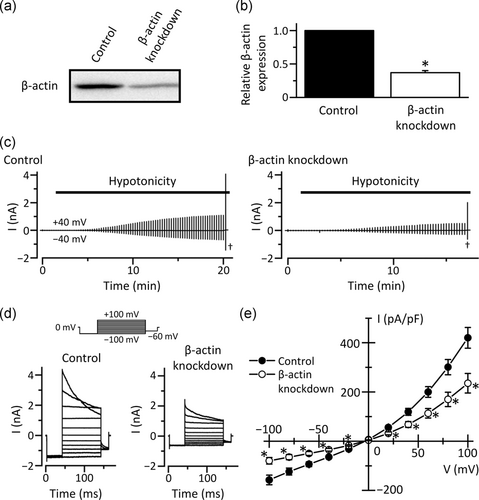
To investigate whether reduced expression of β-actin affects VSOR Cl− channel activities in KCP-4 cells, we conducted whole-cell patch-clamp recordings in KB cells in which β-actin is knocked down. The β-actin protein expression was markedly suppressed in KB cells transfected with β-actin siRNA (Figure 3a,b). In the cells treated with control siRNA, hypotonicity-induced cell swelling triggered membrane currents (Figure 3c). The currents exhibited mild outward rectification and time-dependent inactivation on depolarization, which are electrophysiological characteristics of VSOR Cl− currents (Figure 3d,e). Interestingly, knockdown of β-actin significantly decreased VSOR Cl− currents (Figure 3c–e).
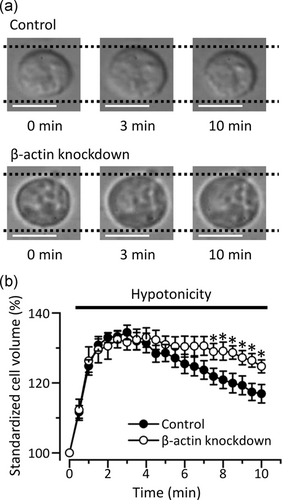
Since the activity of VSOR Cl− channels is involved in the recovery process after cell swelling (called RVD; Okada, 1997), we next measured cross-sectional area in KB cells to estimate its cell volume (Figure 4). Control cells increased its cell volume after exposure to the hypotonic solution, followed by a decrease toward its initial level. In contrast, the RVD process was significantly inhibited in the β-actin-knockdown cells. Recovery from the maximum cell volume in control cells and the β-actin-knockdown cells were 58.4 ± 6.5% (n = 16) and 33.2 ± 4.2% (n = 12), respectively (p < .05). These results suggest that the expression of β-actin regulates the function of VSOR Cl− channels in KB cells.
3.3 Actin filaments are essential for the function of VSOR CL− channels in KB cells
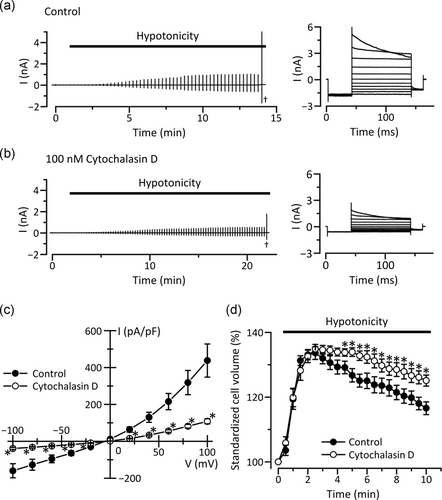
To investigate whether actin filament networks are important for swelling-induced activation of VSOR Cl− channels, we used cytochalasin D, an inhibitor of actin polymerization. In KB cells treated with 100 nM cytochalasin D for 12 hr, VSOR Cl− currents induced by cell swelling were significantly decreased (Figure 5a–c). The treatment of KB cells with cytochalasin D also suppressed the RVD process (Figure 5d). The volume recovery in the cytochalasin D-treated cells (34.6 ± 3.4% [n = 16]) was significantly smaller than that in control cells (55.1 ± 6.5% [n = 15], p < .05). These results suggest that actin filament networks contribute to the VSOR Cl− channel activities.
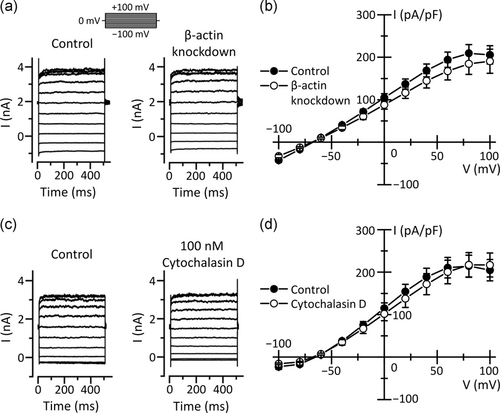
Parallel activation of VSOR Cl− channels and Ca2+-activated K+ channels are known to contribute to the RVD process (Okada et al., 2001). We, therefore, investigated whether actin filament networks affect activities of Ca2+-activated K+ channels in KB cells. In control cells, a rise in intracellular free Ca2+ concentration to 1 µM induced membrane currents saturated at more than +60 mV (Figure 6). The reversal potential of the currents was near the equilibrium potential for K+ (about −80 mV), indicating selective permeability to K+. Interestingly, neither the knockdown of β-actin nor the treatment with 100 nM cytochalasin D for 12 hr affected the Ca2+-activated K+ currents in KB cells (Figure 6). These results suggest that disrupting actin filaments do not affect the K+ currents.
3.4 Actin filament networks modulate cisplatin sensitivity of KB cells
The activation of VSOR Cl− channels is demonstrated to precede apoptosis triggered by cisplatin in KB cells (Ise et al., 2005). We, therefore, investigated the cisplatin sensitivity of KB cells. As shown in Figure 7a, 10 µM cisplatin reduced the cell viability of KB cells. Intriguingly, the decrease in cell viability by cisplatin was significantly inhibited in KB cells co-treatment with 100 nM cytochalasin D. We then measured caspase-3/7 activities in KB cells. The caspase-3/7 activities were time-dependently enhanced in KB cells treated with 15 µM cisplatin, although control cells had no increase in the activities (Figure 7b). In contrast, the treatment of KB cells with 100 nM cytochalasin D significantly inhibited the cisplatin-induced enhancement of caspase-3/7 activities. Consistently, the β-actin-knockdown KB cells exhibited lower caspase-3/7 activities in the presence of cisplatin (Figure 7c). Since VSOR Cl− channel activities are associated with cell shrinkage on apoptosis called apoptotic volume decrease (AVD; Okada et al., 2001), we investigated whether actin filaments regulate cisplatin-induced AVD in KB cells. As shown in Figure 7d, exposure of KB cells to cisplatin caused AVD in a time-dependent manner, which was inhibited in the presence of cytochalasin D. These results suggest that impaired actin filaments suppress cisplatin-induced apoptosis via the dysfunction of the VSOR Cl− channels in KB cells.

3.5 A histone deacetylase inhibitor restores the expression and distribution of β-actin in KCP-4 cells
We previously demonstrated that exposure of KCP-4 cells to trichostatin A, a histone deacetylase inhibitor, partially restored the VSOR Cl− channel function and the cisplatin sensitivity (Lee et al., 2007). We, therefore, investigated the expression and distribution of β-actin in KCP-4 cells treated with 400 nM trichostatin A for 30 hr. As expected, trichostatin A-treated KCP-4 cells exhibit higher expression of β-actin than nontreated KCP-4 cells (Figure 8a). Interestingly, clear actin filaments were observed after exposure of KCP-4 cells to trichostatin A (Figure 8b). These results suggest that actin filament networks modulate the VSOR Cl− channel function and the cisplatin sensitivity in KCP-4 cells.

4 DISCUSSION
The activation of VSOR Cl− channels, which triggers persistent cell shrinkage under isotonic conditions, is known to have an essential role in the induction of apoptosis (Okada et al., 2006; Shimizu et al., 2004). We and others have previously reported that a functional defect of VSOR Cl− channels is associated with acquired cisplatin resistance of cancer cells (Lee et al., 2007; Min et al., 2011; Shimizu et al., 2008). We here used human epidermoid carcinoma KB cells and its cisplatin-resistant KCP-4 cells as a model of acquired cisplatin resistance, because they are demonstrated to exhibit a large difference in the VSOR Cl− channel activities and the RVD process; KB cells with the functional channels show the RVD, while KCP-4 cells lacking the channel activities do not (Shimizu et al., 2008).
VSOR Cl− channels are known to be composed of five LRRC8 members (Voss et al., 2014). In the present study, we observed similar gene expression patterns of LRRC8A to LRRC8E in KB and KCP-4 cells (Figure 1a). Especially, we found that the protein expression of LRRC8A, which is an indispensable component of VSOR Cl− channels, was comparable between KB and KCP-4 cells (Figure 1b,c). It is noted that LRRC8A proteins were similarly expressed in the plasma membrane of both cells (Figure 1d), consistent with a previous report (Okada, Islam, Tsiferova, Okada, & Sabirov, 2017). This suggests that decreased VSOR Cl− channel activities are not dependent on the cell surface expression level of LRRC8A proteins. Further studies might be needed to compare the protein expression of LRRC8B to LRRC8E between KB and KCP-4 cells. On the other hand, we previously reported that VSOR Cl− currents are recovered by treatment of KCP-4 cells with histone deacetylase inhibitors, such as trichostatin A and apicidin (Lee et al., 2007; Shimizu et al., 2008). This suggests that KCP-4 cells lack some proteins associated with the VSOR Cl− channel function.
The present study demonstrated that KCP-4 cells showed lower expression of β-actin than KB cells (Figure 2a–c). Surprisingly, KCP-4 cells exhibited fewer actin filaments (Figure 2d). Not only the knockdown of β-actin but also the disruption of actin filaments in KB cells decreased the VSOR Cl− currents and inhibited the RVD process (Figures 3-5). These results suggest that the disruption of actin filaments triggered by low expression of β-actin contributes to a functional defect of VSOR Cl− channels in KCP-4 cells. So far, the binding of α-actinin 4 (ACTN4), an actin-binding, and -crosslinking protein, with ATP-binding cassette sub-family F member 2 (ABCF2) has been demonstrated to enhance the RVD process (Ando-Akatsuka, Shimizu, Numata, & Okada, 2012). Besides, the ACTN4 expression was suggested to be necessary for intact actin filaments (Tang & Brieher, 2012). These reports are related to our present results: that is, the regulation of VSOR Cl− channels by actin filaments might be dependent on the ABCF2–ACTN4 interaction. However, it should be noted that properties of cytoskeletal actin filaments seem to be diverse in a cell-dependent manner: some reports showed that actin polymerization is required for the activation of VSOR Cl− channels (Burow, Klapperstück, & Markwardt, 2015; Catacuzzeno et al., 2014; Fatherazi, Izutsu, Wellner, & Belton, 1994; Wei, Mei, Sun, Zhou, & Zhang, 2003; Zhang, Larsen, & Lieberman, 1997), whereas others reported that disruption of actin filaments potentiates the activation rate of VSOR Cl− channels (Levitan, Almonte, Mollard, & Garber, 1995; Morishima, Shimizu, Kida, & Okada, 2000; Shen, Chou, Hsu, Hsu, & Wu, 1999). It is worth noting that peripheral actin filaments and perinuclear actin filaments have different roles in the regulation of VSOR Cl− channels (Wang et al., 2005). This suggests that experimental conditions, such as the concentration and the incubation time of actin modulators in these reports might differently affect peripheral and perinuclear actin filaments. Further studies are awaited to clarify this issue.
Actin filaments are reported to regulate cisplatin uptake and/or cisplatin-triggered apoptosis in cancer cells (Liang et al., 2008; Mokady & Meiri, 2015; Shen et al., 2012; Shen, Liang, Gawinowicz, & Gottesman, 2004). We here found the disruption of actin filaments decreased the cisplatin-induced apoptosis in KB cells (Figure 7). Especially, cytochalasin D inhibited AVD triggered by cisplatin in KB cells (Figure 7d). On the other hand, in KCP-4 cells restored the functional expression of VSOR Cl− channels and the cisplatin sensitivity after application with trichostatin A (Lee et al., 2007), actin filaments were observed (Figure 8). These results strengthen that decreased cisplatin sensitivity of KCP-4 cells is due to the impaired VSOR Cl− channel activities by the actin filament disruption. Our findings seems to be related to previous reports in which reactive oxygen spices generated by cisplatin (Dasari & Tchounwou, 2014) changes the cellular distribution of ACTN4 and the ABCF2–ACTN4 interaction (Okada et al., 2019). Interestingly, it has been demonstrated that VSOR Cl− channels mediate cisplatin uptake in a manner dependent on the expression of LRRC8D, which is one of the components of the channels (Jentsch et al., 2016; Planells-Cases et al., 2015). It could be therefore intriguing to examine how actin filaments are arranged in the cells.
Cooperative activation of Ca2+-activated K+ channels and VSOR Cl− channels is known to involve in the RVD process (Okada et al., 2001; Wang, Morishima, & Okada, 2003). We here found that not only the β-actin knockdown and the treatment with cytochalasin D in KB cells decreased the activity of VSOR Cl− channels, but not of Ca2+-activated K+ channels (Figure 6), suggesting that actin filament networks specifically regulate VSOR Cl− channel activities in KB cells. KCP-4 cells are demonstrated to lack both VSOR Cl− channels and Ca2+-activated K+ channels (Lee et al., 2007; Lee, Hasegawa, Shimizu, & Okada, 2008). Therefore, these channels are suggested to be differently modulated in the cisplatin resistance.
In conclusion, the present study revealed that the cisplatin-resistant KCP-4 cells exhibit low expression of β-actin and disrupted actin filaments. Importantly, the dysfunction of VSOR Cl− channels by the disruption of actin filament networks is suggested to be closely associated with acquired resistance to cisplatin. Thus, the VSOR Cl− channel could be a potential molecular target to overcome the cisplatin resistance.
ACKNOWLEDGMENTS
We thank Dr. Tomoharu Gomi for technical advice. We gratefully acknowledge the work of all the members in the department of pharmaceutical physiology at the University of Toyama. This work was supported by JSPS KAKENHI (grant numbers: JP15K15029, JP16K08490, and JP17K08531). A research grant from Takeda Science Foundation is gratefully acknowledged.
CONFLICT OF INTERESTS
The authors declare that there are no conflict of interests.
AUTHOR CONTRIBUTIONS
T. S. and H. S. conceived the experiments. T. S., T. F., H. O., T. T., R. T., and K. K. performed the experiments and analyzed the data. T. S. and H. S. wrote the manuscript. All the authors reviewed the manuscript.
Open Research
DATA AVAILABILITY STATEMENT
The data that support the findings of this study are available from the corresponding author upon reasonable request.


