IGFBP6 regulates vascular smooth muscle cell proliferation and morphology via cyclin E–CDK2
Abstract
Despite the high prevalence of varicose veins, the underlying pathogenesis of this disease remains unclear. The present study aims to explore the role of insulin-like growth factor binding protein 6 (IGFBP6) in vascular smooth muscle cells (VSMCs). Using a protein array approach, we identified several differentially expressed proteins between varicose great saphenous veins and normal great saphenous veins. Bioinformatic analysis showed that IGFBP6 was closely related to cell proliferation. Further validation confirmed that IGFBP6 was one of the most highly expressed proteins in varicose vein tissue. Knocking down IGFBP6 in VSMCs significantly attenuated cell proliferation and induced the S phase arrest during the cell cycle. Further experiments demonstrated that IGFBP6 knockdown increased cyclin E ubiquitination, which reduced expression of cyclin E and phosphorylation of CDK2. Furthermore, IGFBP6 knockdown arrested centrosome replication, which subsequently influenced VSMC morphology. Ultimately, IGFBP6 was validated to be involved in VSMC proliferation in varicose vein tissues. The present study reveals that IGFBP6 is closely correlated with VSMC biological function and provides unprecedented insights into the underlying pathogenesis of varicose veins.
1 INTRODUCTION
Chronic venous disorders (CVDs) cause a series of clinical problems that range from cosmetic abnormalities to severe clinical symptoms. In Western countries, the prevalence of CVD is highest and already consumes up to 2% of healthcare budgets (Davies, 2019). Varicose veins are the most common venous disorders and affect around 25–40% of the adult population (Hamann et al., 2019). Varicose veins severely decrease life quality of patients when they are accompanied with other conditions, including edema, skin changes, and ulceration. Risk factors for varicose veins include female gender, multiple pregnancies, a standing occupation, and obesity (Lim & Davies, 2009; Naoum, Hunter, Woodside, & Chen, 2007). To date, some mechanisms underlying the pathogenesis of varicose veins have been investigated. Haemodynamic factors, hypoxia, remodeling of the extracellular matrix, cellular hyperplasia, downregulated apoptosis, chemotaxis, activation of inflammatory cells, and even the genetic predisposition are believed to be related to the development of varicose veins (Lim & Davies, 2009; Naoum et al., 2007; Shadrina, Sharapov, Shashkova, & Tsepilov, 2019). However, the specific molecular mechanisms during the development of varicose veins remain unknown.
However, the phenotypic transition of vascular smooth muscle cells (VSMCs) and the consequently increased proliferation are common pathophysiological processes in the development of varicose veins (Lim & Davies, 2009; Xu, Bei, Li, & Chu, 2017). Thus, the altered proliferative property of VSMCs is closely related to varicosity progression (Huang et al., 2019; Surendran et al., 2016; Zhang, Li, & Guo, 2019). As reported, IGF-I, IGF-II, and insulin-like growth factor binding proteins (IGFBPs) were closely associated with VSMC proliferation and involved in vascular diseases (Wang et al., 2012; Wu, Zheng, Cheng, Zhang, & Ma, 2020). Evidence has indicated that IGFBP6 was closely correlated with cell proliferation (Bach, 2015; Bach, 2016;; Bach, Fu, & Yang, 2013). Most studies indicated that IGFBP6 expression was lower in malignant cells than in normal cells, which showed the property of IGFBP6 in tumor suppression (Bach, 2015). And IGFBP6 revealed the explicit inhibition of cell proliferation by interacting with IGF-II (Bach et al., 2013; Bach, 2015; Bach, 2016). However, a number of studies demonstrated the IGF-independent action of IGFBP6 on cell proliferation and survival (Bach, 2015; Bach, 2016). For example, IGFBP6 was shown to inhibit fibroblast proliferation by IGF-dependent and IGF-independent mechanism (Raykha et al., 2013). Some mechanisms underlying the IGF-independent effect of IGFBP6 on cell survival have been discussed. IGFBP6 mediated the antiproliferative effect of SEMA3B in lung cancer cells (Koyama et al., 2008). And IGFBP6 bound to Ku80 and impaired its transport into the nucleus, which promoted the proapoptotic effect of IGFBP6 (Iosef et al., 2010). In naso-pharyngeal cancer cells, IGFBP6 increased EGR-1 expression by binding to the promoter, thereby inhibiting cell proliferation (Kuo, Tang, Lu, Wu, & Lin, 2010). The Hh pathway activation increased IGFBP6 expression and promoted cell survival and proliferation (Xu et al., 2009). However, whether IGFBP6 exerts a role in regulating VSMC proliferation in varicose veins has not been reported.
In this study, a protein array was used to investigate the differentially expressed proteins (DEPs) between normal great saphenous vein (NV) and varicose great saphenous vein (VV). We identified IGFBP6 as one of the most highly expressed proteins among the DEPs in varicose vein tissue. Gene Ontology (GO) enrichment methods indicated the close relation of IGFBP6 to cell proliferation. The high expression of IGFBP6 in VV and result from GO analysis demonstrated that IGFBP6 may be involved in the development of varicose veins. The role of IGFBP6 in VSMCs and the underlying mechanisms will be explored.
2 METHODS
The data and analytic methods are available from the corresponding author on reasonable request. All materials used in this study are available commercially from the indicated vendors.
2.1 Sample acquisition
This study was approved by the Research Ethics Committee of the First Affiliated Hospital of Sun Yat-sen University and conformed to the Declaration of Helsinki. VVs were obtained from patients who underwent high ligation and stripping surgery of great saphenous veins, and NVs were obtained from patients who underwent coronary bypass surgery. All samples of great saphenous veins were harvested at the level of the knee. Consent of the donors or their family members was obtained. Statistical analysis of patient characteristics was conducted with regard to age and gender. All specimens were immediately processed following surgical removal. Briefly, perivascular tissue, including adipose tissue, was trimmed, and blood was rinsed using cold phosphate buffered saline (PBS). Segments of vein tissues were either placed in 4% paraformaldehyde and embedded in wax for subsequent histological analysis or stored in liquid nitrogen for future analysis.
2.2 Protein array detection
The relative concentrations of a total of 640 proteins were detected with the cytokine antibody array GSH-CAA-640 (http://www.raybiotech.cn/; RayBiotech, Guangzhou, China) according to the manufacturer's instructions. Briefly, vein tissue samples were cut into pieces and lysed in radioimmunoprecipitation assay (RIPA) lysis buffer with a protease inhibitor cocktail. Sample supernatant was collected, and the protein concentration was determined. The protein array contained 16 glass slides, and each glass slide included 16 parts, each of which contained the same 40 antibody and could detect one sample. Sixteen glass slides were blocked, incubated with tissue lysate, washed, and then incubated with a biotinylated antibody cocktail specific for the different proteins. Glass slides were developed with Cy3-conjugated streptavidin, and the slides were scanned on InnoScan 300 Microarray Scannera (Innopsys, Carbonne, France). Raw fluorescence data were obtained by scanning the glass slides, and data extraction was completed by using the GAL file that is specific for this array, along with the GenePix microarray analysis software. GAL files can be found here: http://www.RayBiotech.com/Gal-Files.html. Local background intensities were subtracted from each spot. The average florescence data of the duplicate spots for each protein were normalized to those of the positive controls on each glass slide.
2.3 Histology, immunohistochemistry (IHC), and immunofluorescence (IF)
For histology, after the samples were obtained from patients, great saphenous vein tissue samples were fixed in 4% paraformaldehyde for 12 hr and embedded in wax. Vein tissue sections (3 µm) were collected on positively charged glass slides, baked for deparaffinization, and stained with hematoxylin and eosin (HE; Solarbio, Beijing, China) to display the morphology of the samples. The glass slides were mounted using neutral balsam (Solarbio) and placed horizontally to dry overnight.
For IHC, after deparaffinization, great saphenous tissue sections (3 µm) were processed with hydrogen peroxide blocker and incubated with appropriate dilutions of primary antibody: anti-α smooth muscle actin antibody (a-SMA, 1:400; Abcam, Cambridge, CA). Following overnight incubation and washing, the great saphenous tissue sections were incubated with horseradish peroxidase (HRP)-conjugated affinipure goat anti-mouse IgG (1:1,000; Proteintech, Rosemont, IL) and developed using 3,3-diaminobenzindine reagent (DAB; Solarbio) according to the manufacturer's instructions. hematoxylin was used for nucleus staining. The vein tissue sections were observed and photographed using an Olympus BX51 microscope (Olympus, Tokyo, Japan).
For IF, VSMCs were seeded into 24-well glass coverslips (14 mm; WHB, Shanghai, China) and grown to a confluency of 60–70% (log-phase growth). Cells were washed with PBS and fixed in 4% paraformaldehyde for 15 min. After the cells were washed with PBS, they were permeabilized and blocked in blocking buffer (PBS with 0.1% Triton X-100; Sigma Aldrich, Missouri; and 1% BSA; Sigma Aldrich) for 5–10 min. Cells were incubated with primary antibody overnight at 4°C. Primary antibodies: anti-a-SMA antibody (Abcam), anti-smooth muscle myosin heavy chain (SM-MHC) II antibody (Abcam), anti-beta (β) tubulin antibody (Proteintech), and anti-pericentrin antibody (Abcam) were diluted to 1:200 in blocking buffer. On the next day, after 3 × 10 min gentle washes with PBS, the cells were incubated for 60 min at room temperature with secondary antibodies. The secondary antibodies donkey anti-rabbit IgG (RD, minneapolis, MN) and donkey anti-mouse IgG (RD) were diluted to 1:400 in blocking buffer. After the samples were washed with PBS, the glass cover slides with cells were left to dry and were mounted and counterstained with ProLong™ Gold Antifade Mountant with 4',6'-diamidino-2-phenylindole (Invitrogen, Carlsbad, CA). As for IF of vein tissues, frozen vein tissue sections (3–5 µm) were collected on positively charged glass slides and were fixed inacetone (4°C) for 30 min, the rest of the steps followed the IF of cells. Primary antibodies: anti-IGFBP6 (1:200; Abcam), anti-Ki-67 (1:200; Abcam). Images were recorded on a Leica DMi8 inverted fluorescence microscope (Leica, Wetzlar, Germany). Images were analyzed for intensities by using Imaging J software (NIH, Bethesda, MD).
2.4 Reverse transcription quantitative polymerase chain reaction (RT-qPCR) assay
For SYBR Green RT-qPCR, total RNA was isolated from great saphenous vein tissue using the RNAprep Pure Tissue Kit (Tiangen, Beijing, China) according to the manufacturer's instructions. For TaqMan RT-qPCR, total RNA was extracted from cultured cells with TRIzol reagent (Invitrogen) according to the manufacturer's instructions. A total of 1000 ng RNA was reverse-transcribed using a PrimeScript™ RT reagent Kit with gDNA Eraser (Takara, Beijing, China) according to the manufacturer's instructions with a S1000 thermal cycler (Bio-Rad, Hercules, CA). The SYBR Green RT-qPCR reaction was conducted using SYBR Green I Master (Roche, Basel, Switzerland) in a 10 µl reaction volume, and the TaqMan RT-qPCR reaction was conducted using TransStart Probe RT-qPCR SuperMix (TransGen Biotech, Beijing, China) in 20 µl reaction volume on a LightCycler 480 instrument (Roche) according to the manufacturer's instructions. Sequences of primer (Genepharma, Suzhou, China) pairs used for SYBR Green RT-qPCR in this study are detailed in Table 1; glyceraldehyde 3-phosphate dehydrogenase (GAPDH) was used as a reference gene. TaqMan probes for IGFBP6 and GAPDH used for gene expression analysis were Hs00181853 m1 and Hs04420698 g1 (Thermo Fisher Scientific, Waltham, MA). The relative expression of each mRNA was calculated by the ΔCt method and normalized to GAPDH. Since a Ct value of 35 represents a single molecule template detection, Ct values ≥35 were considered beyond the limit of detection. mRNAs with a Ct value ≥35 were excluded from the analysis.
| Target | Sense sequence (5′ > 3′) | Antisense sequence (5′ > 3′) |
|---|---|---|
| Activin A | CAACAGGACCAGGACCAAAGT | GAGAGCAACAGTTCACTCCTC |
| AMIGO | CTCAACTGTGGCGAGTACAAG | CCATTGGTCACCTCATCTAGCA |
| B7-H1 | TGGCATTTGCTGAACGCATTT | AGTGCAGCCAGGTCTAATTGT |
| BLC | GCTTGAGGTGTAGATGTGTCC | CCCACGGGGCAAGATTTGAA |
| CD109 | GTCCGGTTACACGTAGCTCA | TCCTGGAAGCAGAAGGAGTC |
| CD34 | AGGAGAAAGGCTGGGCGAAG | GTTGTCTTGCTGAATGGCCG |
| CD48 | AGCTGCAAGTGCTTGACCC | CAGACTCGCCAGGTATCACAC |
| CEACM5 | AAGAAATGACGCAAGAGCCTATG | CCCGAAAGGTAAGACGAGTCTG |
| Chemerin | CCAATGGGAGGAAACGGAAA | CCAGGGAAGTAGAAGCTGTGG |
| ck β 8-1 | CATCTCCTACACCCCACGAAG | GGGTTGGCACAGAAACGTC |
| CPR | GCCAGACAGACATGTCGAGG | GGCACACAGTGAAGGCTTTG |
| CRTAM | ACAGCGACTCTGTAAGCACA | GTTCCACCGGACACTTCCAT |
| CXCL16 | CCCGCCATCGGTTCAGTTC | CCCCGAGTAAGCATGTCCAC |
| Cystatin E M | GCAGCAGGAGAAGCTGCG | TTGTGACAGATACGGCCCAC |
| Eotaxin2 | CTCAAGGCAGGAGTGATCTTCA | CTTGGCGTCCAGGTTCTTCA |
| FLRG | CTCCAGACTGATGTCACCCG | GCACGAATCTTTGCAGGGAA |
| Galectin4 | TCGCCTTCCACTTCAATCCG | ACCACCACCTTGTAGTGCTC |
| GDF15 | ATACTCACGCCAGAAGTGCGG | CTTGCAAGGCTGAGCTGACG |
| Glypican1 | TGAAGCTGGTCTACTGTGCTC | CCCAGAACTTGTCGGTGATGA |
| HGFR | GCTGCAAAGCTGTGGTAAACT | CTCCAGCATTTTTACGGACC |
| HTRA2 | AGCTTGGTTCTCGAAGCTGT | ATTCCTCCTCCGGAATCAGT |
| IGF1R | AGTGGAGAAATCTGCGGGC | ACTCGGTAATGACCGTGAGC |
| IGFBP6 | CCTGCTGTTGCAGAGGAGAATC | GTCTTGGACACCCGCAGAAT |
| IL27 | AGACGGCAGGCGACCTT | GAGATGCAGGCTGACTGTGA |
| LAIR1 | GGCCTAGTGCTCTGCCTG | ACACGAAAGTCACATGGCTC |
| LAMP1 | CACCATAAACATGGCTGCTG | CTCTCCGCACCGTACCC |
| LIFRα | TGGAACGACAGGGGTTCAGT | GAGTTGTGTTGTGGGTCACTAA |
| Nogo receptor | AATGAGCCCAAGGTGACGAC | CAATTCGGGCCAGCACATTC |
| p27 | CATTCCATGAAGTCAGCGAT | CGTCAAACGTAAACAGCTCG |
| PARC | CTCCTGTGCACAAGTTGGTA | AGGAGGATGACACCTGGCTT |
| PF4 | CTGCTGTTCCTGGGGTTG | GACCTGGGAGGTGGTCTTC |
| PYY | TAATCTGCTGCCAAGAGGAAAC | CATGCAGTTCTGAGGGTGGC |
| RET | GAGGAGAGACTACTTGGACCTTG | GGGGACAGCGGTGCTAGAAT |
| sFRP3 | CGGAGCTGATTTTCCTATGG | TCCGGAAATAGGTCTTCTGTGT |
| Siglec5 | GCTGCAAGGGAGATCGAACC | AGGCACAGACAGATACAGAGC |
| SOX2 | GCGAACCATCTCTGTGGTCT | GGAAAGTTGGGATCGAACAA |
| SREC I | CCGATCAGACCTCAAGGACA | GGTAGCTTGTGGGAGCTGAG |
| SREC II | GCCTCAGGAACTGAACCCT | TCTCTGAGCACGTGGAGTTG |
| Tie2 | GGAGTCAGCTTGCTCCTTTC | AGGCAATGCAGGTGAGAGAT |
| TLR2 | CATTCTATGCCTGAAACTTGTCA | CCAGTGTCTTGGGAATGCAG |
| TLR3 | AGGAAAGGCTAGCAGTCATCC | GCTGCAGTCAGCAACTTCAT |
| Transferrin | AACGTAACTGACTGCTCGGG | CAGGAGTGATGAGGTGGAGC |
| ULBP1 | TAAGTCCAGACCTGAACCACA | TCCACCACGTCTCTTAGTGTT |
- Abbreviations: DEP, differentially expressed protein; RT-qPCR, reverse transcription quantitative polymerase chain reaction.
2.5 Immunoblotting assay
For tissue immunoblotting, great saphenous vein tissue samples were partially thawed. A total of 50–100 mg of tissue per sample was immediately placed in RIPA lysis buffer (Beyotime, Shanghai, China) with three additives: PMSF (Thermo Fisher Scientific), ProteinSafe Protease Inhibitor Cocktail (TransGen Biotech), and ProteinSafe Phosphatase Inhibitor Cocktail (TransGen Biotech). For cell immunoblotting, cells cultured in six-well plates were washed with PBS and were processed with RIPA lysis buffer with the three abovementioned additives. The protein extraction process was conducted for tissues and cultured cells. Protein extracts were resolved by sodium dodecyl sulfate polyacrylamide gel electrophoresis (SDS-PAGE), transferred to polyvinylidene fluoride membranes (Millipore, Bedford, MA), and incubated with primary antibodies. The primary antibodies, anti-IGFBP6 (Abcam), anti-Activin A (Abcam), anti-FLRG (Abcam), anti-glypican1 (Proteintech), anti-HGFR (Abcam), anti-cyclin A (Proteintech), anti-CDK2 (Proteintech), anti-cyclin D (Proteintech), anti-CDK2 (phospho T160; Abcam), anti-cyclin E (phospho T77; Abcam), anti-cyclin E (Abcam), anti-cyclin E (phosphoT395; ABclonal, Shanghai, China), anti-nucleophosmin (phospho T199; Abcam), anti-nucleophosmin (Abcam), and anti-GAPDH (Proteintech) antibodies were used. HRP-conjugated Affinipure goat anti-mouse IgG (Proteintech), and HRP-conjugated Affinipure goat anti-rabbit IgG (Proteintech) were used as secondary antibodies. Protein bands were visualized on an Amersham Imager 600 instrument (GE, Fairfield, CT).
2.6 Cell culture
Primary VSMCs from NV were cultured in vitro. Normal vein specimens were washed with sterile PBS with penicillin-streptomycin added. Vein segments were cleaned of adventitia, cut longitudinally, and stripped of endothelium with sterile microsurgical instruments. Then, the tissue samples were cut into small pieces (1 × 1 mm), placed into T25 flasks and maintained in medium 231 with smooth muscle growth supplement (Gibco, Grand Island, NY), 10% fetal bovine serum (Gibco), and 1% penicillin/streptomycin at 37°C in a humidified 5% CO2 incubator. Once confluent, subcultured cells were digested with 0.25% trypsin and passaged at a 1:2 ratio. VSMC were characterized using IF assay and used at passage 2–10.
2.7 Transduction of siRNA
For knockdown of IGFBP6 gene expression, VSMCs were cultured in six-well plates at 1.8 × 10⁵ cells/well. Cells were cultured overnight and then were transfected with small-interfering RNA (siRNA) by using the Lipofectamine RNAiMAX Transfection Reagent (Invitrogen). Cells were transfected initially the day following plating and then were transfected a second time 12 hr later. For satisfactory transfection efficiency, 150 nmol siRNA was used in each transfection experiment. The specific and control siRNAs included siG10114114045 (siRNA1), siG10114114057 (siRNA2), siG10114114108 (siRNA3), and si-h-GAPDH (NC siRNA; (RiboBio, Guangzhou, China). Knockdown of IGFBP6 gene expression was confirmed 48 hr after the second transfection by TaqMan RT-qPCR and immunoblotting.
2.8 Analyses of VSMC proliferation and the cell cycle
For cell proliferation analysis, VSMCs were cultured in 96-well plates (6 × 10³ cells/well) overnight and were transfected with siRNA (at a 12 hr interval) the following day. Cell proliferation was determined 60 hr after the second siRNA transfection using the cell counting kit-8 (CCK-8) reagent (Dojindo, Japan). For the CCK-8 assay, 10 μl of CCK-8 was dispensed into each well of the 96-well culture plate, and the absorbance was measured at 450 nm after a 2-hr culture period.
For cell cycle analysis, VSMCs were cultured in six-well plates (15–20 × 104 cells/well) overnight and were transfected with siRNA (at a 12 hr interval) the following day. Cells were harvested 60 hr after the second siRNA transfection and were fixed overnight in 70% ethanol (vol/vol). VSMCs were stained using a cell cycle analysis kit—propidium iodide staining solution (Leagene, Beijing, China) according to the manufacturer's instructions. Sample were counted and analyzed using a CytoFLEX flow cytometer (Beckman Coulter, Brea, CA). Cellular DNA content ratios were analyzed using ModFit LT 4.1 (Verity Software House, Topsham, ME).
2.9 Co-immunoprecipitation (Co-IP) and IP assay
For Co-IP assay, VSMCs were handled with Pierce IP lysis buffer (Thermo Fisher Scientific) for protein extraction. Cell lysate was then mixed with anti-IGFBP6 antibody and isotype control lgG (CST) respectively overnight. Magnetic beads labeled by streptavidin was added into the mixture and incubated for another 1 hr at room temperature. After incubation, the whole mixture was placed on a magnetic rack for interacting complex purification, and the complex harvested in the last step was boiled with protein loading buffer at 95°C for 10 min and analyzed through SDS-PAGE. The target band was used for mass spectrometry analysis.
For IP assay, cells were transfected with control and IGFBP6 siRNAs for 48 hr as described above and then were treated with 20 μM MG132 (MCE, NJ) for 8 hr before harvest in Pierce IP lysis buffer. The anti-cyclin E (Abcam) antibody was used to specially combinate cyclin E antigen, and isotype control lgG (CST) as the control. The anti-ubiquitination antibody (Thermo Fisher Scientific) was used to detect the ubiquitinated level of cyclin E protein in immunoblotting assay. Pierce Classic Magnetic IP/Co-IP Kit (Thermo Fisher Scientific) was used to fish the IP/Co-IP assays according to the manufacturer's instructions.
2.10 Statistical analysis
Bioinformatic data analysis of DEPs was performed using online databases, including WebGestalt (http://www.webgestalt.org/option.php, Version 2019) and KOBAS 3.0 (http://kobas.cbi.pku.edu.cn/annoiden.php). The numerical values were expressed as the mean± SD (standard deviation), and the categorical data were expressed as the numbers (percentage, %). The difference between two groups was analyzed by independent sample t-test and statistical analyses for categorical data were performed using the Χ2-test and Fisher's exact test to identify significant differences. SPSS 19.0 (SPSS, Chicago, IL) was used and a p value <.05 was accepted as statistically significant.
3 RESULTS
3.1 DEPs, including IGFBP6, were identified by a protein array and shown to be enriched through bioinformatic analysis
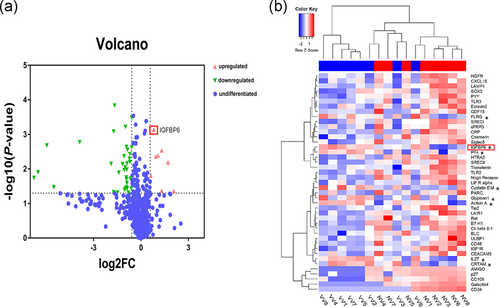
To identify the DEPs between NV and VV, we performed protein array analysis of 16 samples (NV, n = 8; VV, n = 8). Age and gender of the two cohorts of patients were comparable (Table 2). Then, 43 DEPs were identified between the NV and VV by protein array detection (p value < .05, log FC > 1.5, and fluorescence value > 150). Among the DEPs (Table 3), 8 proteins were upregulated and 35 proteins were downregulated in VV compared with NV; these proteins are shown in the volcano plot and the cluster heatmap (Figure 1a,b). To further explore the biological functions of these DEPs in varicose veins, we conducted bioinformatic analysis by GO enrichment and pathway analyses.
| Protein array | RT-qPCR validation | Immunoblotting validation | |||||||
|---|---|---|---|---|---|---|---|---|---|
| NV | VV | NV | VV | NV | VV | ||||
| (n = 8) | (n = 8) | p Value | (n = 15) | (n = 39) | p Value | (n = 12) | (n = 24) | p Value | |
| Sex, no. | |||||||||
| Male | 5 (31.2%) | 5 (31.2%) | 10 (18.5) | 22 (40.7%) | 8 (22.2%) | 9 (25%) | |||
| Female | 3 (18.8%) | 3 (18.8%) | 1.00a | 5 (9.3%) | 17 (31.5%) | 0.55b | 4 (11.1%) | 15 (41.7%) | 0.16a |
| Age, mean (SD) | 35.9 (11.0) | 35.0 (11.0) | 0.88c | 41.3 (15.7) | 47.7 (14.2) | 0.16c | 42.3 (14.5) | 44.5 (12.9) | 0.65c |
| CEAP classification | |||||||||
| C2EpAsPr, no. | – | 8 | – | 39 | – | 24 | – | ||
| GSV harvest site | Knee | Knee | Knee | Knee | Knee | Knee | |||
- Abbreviations: CEAP, Clinical class, Etiology, Anatomy, and Pathophysiology classification; GSV, great saphenous vein; no., numbers; NV, normal great saphenous veins; SD, standard deviation; VV, varicose great saphenous veins.
- a Fisher's exact test.
- b Χ2 test.
- c t text.
| Protein indicator | Gene symbol | Mean value | Mean value | P value | log 2 FC | fv | Trend |
|---|---|---|---|---|---|---|---|
| (VV) | (NV) | ||||||
| Activin A | INHBA | 1,420.16 | 3,550.41 | 6.43E−03 | 1.71 | 2,485.28 | Upregulated |
| AMIGO | AMIGO1 | 863.13 | 287.38 | 2.09E−03 | −5.95 | 575.25 | Downregulated |
| B7-H1 | CD274 | 1,762.25 | 647.63 | 1.46E−04 | −1.67 | 1,204.94 | Downregulated |
| BLC | CXCL13 | 1,013.75 | 487.75 | 3.98E−02 | −1.03 | 750.75 | Downregulated |
| CD109 | CD109 | 3,040.63 | 183.88 | 1.82E−02 | −6.77 | 1,612.25 | Downregulated |
| CD34 | CD34 | 1,052.13 | 54.25 | 3.37E−02 | −5.51 | 553.19 | Downregulated |
| CD48 | CD48 | 458.88 | 213.25 | 8.94E−03 | −1.00 | 336.06 | Downregulated |
| CEACM5 | CEACAM5 | 635.88 | 284.25 | 1.07E−02 | −1.06 | 460.06 | Downregulated |
| Chemerin | RARRES2 | 12,442.88 | 6,608.38 | 3.71E−02 | −0.99 | 9,525.63 | Downregulated |
| ck β8-1 | CCL23 | 1,814.88 | 522.25 | 8.27E−04 | −1.73 | 1,168.56 | Downregulated |
| CPR | CRP | 24,688.13 | 5,877.88 | 7.15E−03 | −1.89 | 15,283.00 | Downregulated |
| CRTAM | CRTAM | 132.38 | 278.75 | 4.06E−03 | 1.08 | 205.56 | Upregulated |
| CXCL16 | CXCL16 | 5,600.13 | 2,791.52 | 4.29E−03 | −1.07 | 4,195.82 | Downregulated |
| Cystatin E M | CST6 | 875.75 | 1,673.50 | 4.41E−03 | 0.93 | 1,274.63 | Upregulated |
| Eotaxin2 | CCL24 | 9,405.25 | 5,214.50 | 1.05E−02 | −0.90 | 7,309.88 | Downregulated |
| FLRG | FSTL3 | 297.13 | 743.13 | 4.33E−02 | 2.08 | 7,888.19 | Upregulated |
| Galectin4 | LGALS4 | 1,248.00 | 101.00 | 1.25E−02 | −6.50 | 674.50 | Downregulated |
| GDF15 | GDF15 | 9,460.75 | 4,468.38 | 3.72E−02 | −0.87 | 6,964.56 | Downregulated |
| Glypican1 | GPC1 | 2,026.63 | 3,112.75 | 1.56E−02 | 0.63 | 2,569.69 | Upregulated |
| HGFR | MET | 5,986.25 | 3,295.63 | 6.92E−03 | −0.88 | 4,640.94 | Downregulated |
| HTRA2 | HTRA2 | 47,307.63 | 29,001.00 | 3.73E−03 | −0.71 | 38,154.31 | Downregulated |
| IGF1R | IGF1R | 453.13 | 234.25 | 2.30E−03 | −0.92 | 343.69 | Downregulated |
| IGFBP6 | IGFBP6 | 26,303.88 | 44,417.50 | 7.25E−04 | 0.81 | 35,360.69 | Upregulated |
| IL27 | IL27 | 174.75 | 400.88 | 2.90E−03 | 1.31 | 287.81 | Upregulated |
| LAIR1 | LAIR1 | 1,452.25 | 724.25 | 3.42E−02 | −0.91 | 1,088.25 | Downregulated |
| LAMP1 | LAMP1 | 7,846.13 | 3,311.00 | 7.29E−03 | −1.17 | 5,578.56 | Downregulated |
| LIFRα | LIFR | 2,196.38 | 1,155.25 | 2.57E−02 | −0.89 | 1,675.81 | Downregulated |
| Nogo Receptor | RTN4R | 1,923.38 | 968.63 | 6.08E−04 | −0.99 | 1,446.00 | Downregulated |
| p27 | CDKN1B | 422.63 | 130.25 | 1.68E−03 | −3.88 | 276.44 | Downregulated |
| PARC | CCL18 | 3,212.72 | 2,133.86 | 3.31E−04 | −0.59 | 2,673.29 | Downregulated |
| PF4 | PF4 | 27,522.25 | 51,458.43 | 4.28E−02 | 1.31 | 39,490.34 | Upregulated |
| PYY | PYY | 4,746.63 | 3,157.75 | 2.37E−03 | −0.59 | 3,952.19 | Downregulated |
| RET | RET | 1,142.50 | 605.13 | 4.83E−02 | −0.80 | 873.81 | Downregulated |
| sFRP3 | FRZB | 15,082.63 | 8,127.50 | 1.77E−02 | −0.93 | 11,605.06 | Downregulated |
| Siglec5 | SIGLEC5 | 28,753.09 | 7,958.78 | 4.70E−02 | −1.72 | 18,355.94 | Downregulated |
| SOX2 | SOX2 | 5,795.88 | 3,781.63 | 6.31E−03 | −0.70 | 4,788.75 | Downregulated |
| SREC I | SCARF1 | 21,170.75 | 8,755.50 | 1.28E−02 | −1.40 | 14,963.13 | Downregulated |
| SREC II | SCARF2 | 36,288.63 | 19,888.25 | 2.79E−03 | −0.86 | 28,088.44 | Downregulated |
| Tie2 | TEK | 1,381.81 | 707.31 | 2.01E−02 | −0.92 | 1,044.56 | Downregulated |
| TLR2 | TLR2 | 2,129.50 | 1,294.25 | 5.06E−03 | −0.73 | 1,711.88 | Downregulated |
| TLR3 | TLR3 | 8,842.63 | 5,459.75 | 1.91E−02 | −0.67 | 7,151.19 | Downregulated |
| Transferrin | TF | 20,5982.50 | 72,319.50 | 4.82E−02 | −1.49 | 13,9151.00 | Downregulated |
| ULBP1 | ULBP1 | 483.50 | 303.25 | 3.68E−02 | −0.61 | 393.38 | Downregulated |
- Abbreviations: DEP, differentially expressed protein; FC, fold change; fv, fluorescence value; NV, normal great saphenous veins; VV, varicose great saphenous veins.
In GO analysis, we assessed the biological functions of the 43 DEPs, including IGFBP6, using the Webgestalt online analysis database (Figure 2a,b). In the biological process classification, the DEPs were mainly enriched in leukocyte and lymphocyte migration, inflammatory response, and cell proliferation processes. We found that IGFBP6 was enriched in GO:0008283, which was related to cell proliferation.
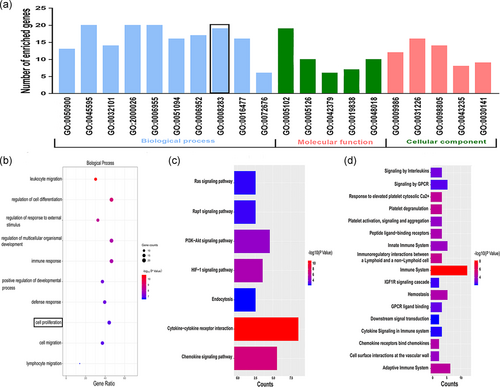
To clarify the related biological pathways involving the DEPs, we performed Kyoto Encyclopedia of Genes and Genomes and Reactome pathway analyses in the KOBAS database. Results indicated that HIF-1a, chemokine, and immune-related pathways were enriched (Figure 2c,d).
Through GO and pathway analyses, we found that the DEPs were mainly enriched in leukocyte and lymphocyte migration, inflammatory response, and cell proliferation, which were previously shown to be involved in the pathogenesis of varicose veins (Lim & Davies, 2009; Naoum et al., 2007; Raffetto, 2013). Therefore, the DEPs, including IGFBP6, identified by a protein array may be closely related to varicose vein development and should be researched further.
3.2 DEPs, including IGFBP6, were validated by RT-qPCR and immunoblotting assays
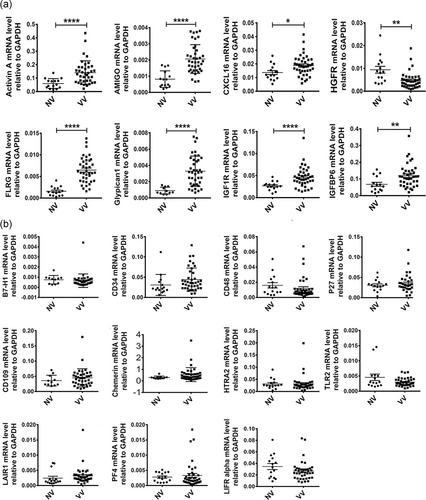
To further validate the DEPs from the protein array, we analyzed the mRNA expression of the DEPs in 15 NV samples and 39 VV samples by RT-qPCR assays. Age and gender of the two cohorts of patients were comparable (Table 2). We found that 8 genes were significantly differentially expressed in VV compared with NV (Figure 3a). Four genes, including Activin A, FLRG, Glypican1, and IGFBP6, were upregulated, while HGFR was downregulated, which was concordant with the results of the protein array. However, we found that 11 genes were not significantly different in VV compared with NV (Figure 3b). The 11 genes include B7-H1, CD34, CD48, CD109, Chemerin, HTRA2, LAIR1, LIFR, p27, PF4, and TLR2. In the protein array detection, PF4 was upregulated, while other 10 corresponding proteins were downregulated in VV compared with NV with a statistical significance (Table 3).
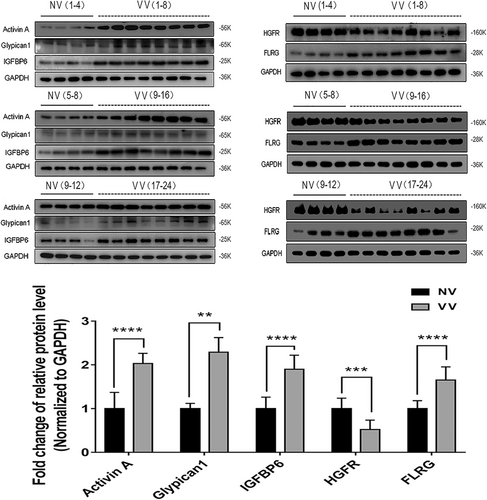
The five proteins, which has the same variation trend in protein array detection, were subsequently validated by immunoblotting assays in 12 NV samples and 24 VV samples. Age and gender of the two cohorts of patients were comparable (Table 2). The protein levels of Activin A, FLRG, Glypican1, and IGFBP6 were significantly higher in VV than NV, and the HGFR level was significantly lower in VV than NV (Figure 4).
After protein array detection with the validation by RT-qPCR and immunoblotting assays, we confirmed that IGFBP6 was upregulated in varicose veins. However, little is known about the role of IGFBP6 in varicose veins. As reported, increased VSMC proliferation promotes varicosity progression (Lim & Davies, 2009; Xu et al., 2017), and IGFBP6 can regulate cell proliferation (Bach et al., 2013; Bach, 2015, 2016). Thus, we further researched whether IGFBP6 was involved in VSMC proliferation.
3.3 IGFBP6 knockdown reduced VSMC proliferation
VSMCs cultured from normal great saphenous veins were used to explore the function of IGFBP6 (Figure 5a). We knocked down IGFBP6 in VSMCs by using three different siRNA sequences, which reduced IGFPB6 gene expression to different degrees, and siRNA3 had the most significant knockdown efficiency (Figure 5b). Immunoblotting assays revealed that siRNA3 significantly reduced the protein expression of IGFBP6 compared with siRNA1 and siRNA2 (Figure 5c).
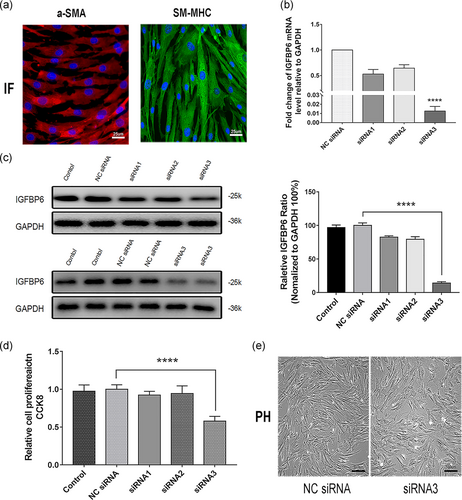
We further conducted CCK-8 cell proliferation assays and found that VSMCs transfected with siRNA3 had a significantly weaker proliferative ability than those transfected with NC siRNA. However, siRNA1 and siRNA2 had almost no inhibitory effect on proliferation of VSMCs (Figure 5d), the result from phase-contrast microscope in Figure 5e also confirmed that siRNA3 declined the proliferation of VSMCs. Thus, siRNA3 was the most efficient siRNA for silencing IGFBP6 and was selected for further research. These results demonstrated that IGFBP6 knockdown inhibits VSMC proliferation in vitro.
3.4 IGFBP6 knockdown induced VSMC cell cycle arrest by downregulating cyclin E–CDK2
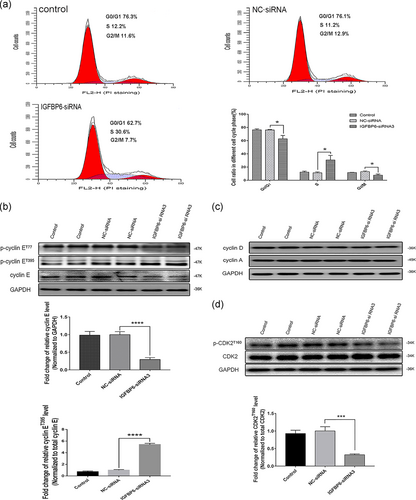
To elucidate the mechanism of IGFBP6 knockdown-mediated inhibition of VSMC proliferation, our cell cycle analysis indicated that IGFBP6 knockdown significantly increased the proportion of VSMCs in the S phase compared with that of the negative control. Furthermore, IGFBP6 knockdown reduced the proportions of VSMCs in the G0/G1 and G2/M phases (Figure 6a). These findings indicated that IGFBP6 knockdown induces VSMC cell cycle arrest in the S phase.
Further, we explored the expression of cell cycle-related proteins in IGFBP6 knockdown VSMCs. The expression of p-cyclin ET395 was significantly increased while the expression of total cyclin E was significantly decreased in IGFBP6-silenced VSMCs compared with those of the negative control (Figure 6b). However, the expression levels of p-cyclin ET77, cyclin D, and cyclin A were not different between IGFBP6-silenced VSMCs and negative control cells (Figure 6b,c). Likewise, the expression of p-CDK2T160 was significantly decreased in the IGFBP6-silenced VSMCs compared with the negative control cells, but the expression of CDK2 exhibited nearly no differences (Figure 6d).
CDK2 is phosphorylated after binding to cyclin E and then numerous downstream molecules were phosphorylated to promote cell cycle processes (Siu, Rosner, & Minella, 2012). On the contrary, after phosphorylation, cyclin E can be degraded through ubiquitin-proteasome system, which is mediated by the SCF complex (Daub et al., 2008; Hao, Oehlmann, Sowa, Harper, & Pavletich, 2007; Koepp et al., 2001). Thus, our results, combined with those related studies, indicated that CDK2 phosphorylation reductions mediated by increased cyclin E degradation induced cell cycle arrest in IGFBP6-silenced VSMCs.
3.5 IGFBP6 knockdown increased cyclin E ubiquitination in VSMC
As reported, cyclin E turnover is controlled by phosphorylation at different sites (Welcker et al., 2003; Ye et al., 2004). Our results indicated that cyclin E may be degraded after being phosphorylated. After phosphorylation, cyclin E can be degraded by SCF (Skp1-Cul1-F-box) complex (Daub et al., 2008; Hao et al., 2007; Koepp et al., 2001). Our results further indicated that S-phase kinase associated protein 1 (Skp1), one substrate of SCF complex, was one interacting protein of IGFBP6 through Co-IP and mass spectrometry analyses (Figure 7a). Thus, IGFBP6 knockdown may be involved in the ubiquitination-mediated degradation of cyclin E.
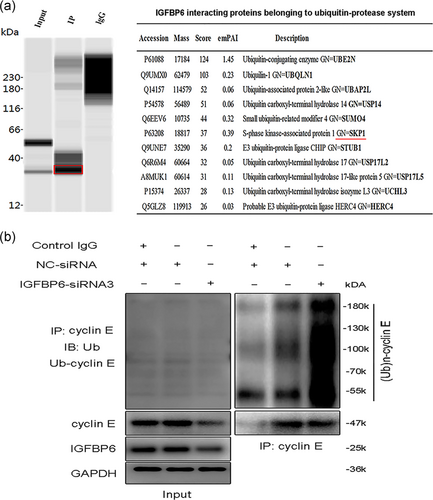
To test the endogenous ubiquitination level of cyclin E, IGFBP6 knockdown was performed in VSMCs. As shown in Figure 7b, IGFBP6 knockdown remarkably increased the endogenous cyclin E protein polyubiquitination levels compared with the control cells. Thus, IGFBP6 knockdown increased cyclin E ubiquitination in VSMCs, which resulted in the reduced expression of cyclin E and cell cycle arrest.
3.6 IGFBP6 knockdown in VSMCs inhibited centrosome replication and affected cell morphology
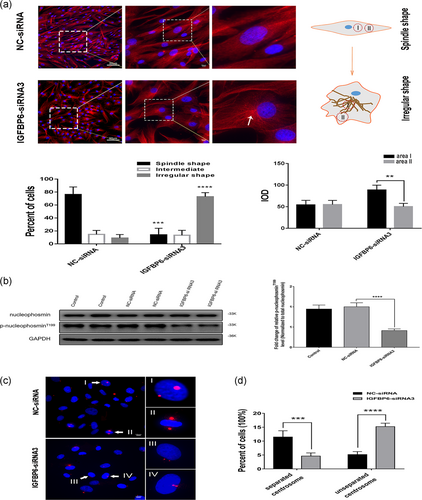
We already showed that IGFBP6 knockdown in VSMCs arrested cell proliferation by reducing the expression levels of cyclin E and p-CDK2T160. In addition, we observed the morphological change in IGFBP6-silenced VSMCs. Most IGFBP6-silenced VSMCs lost the spindle morphology (Figure 5e). Furthermore, we performed IF assay to investigate the VSMC morphology. Most IGFBP6-silenced VSMCs lost the spindle shape and got the irregular shape, as shown by β-tubulin IF staining (Figure 8a). Results also indicated that β-tubulin was concentrated on one side of the nucleus in most IGFBP6-silenced VSMCs, while in the negative control cells, β-tubulin was equally distributed (Figure 8a). The result of cell counting indicated that there were more irregular-shaped cells than spindle-shaped cells in IGFBP6-silenced group, while there were more spindle-shaped cells than irregular-shaped cells in the negative control group. Meanwhile, integrated option density (IOD) of area being close to cell nucleus (area I) and area being far from cell nucleus (area II) were analyzed in IGFBP6-silenced VSMCs and negative control cells (Figure 8a). The result indicated that IOD of the two areas in IGFBP6-silenced VSMCs had significant difference, while IOD of the two areas in negative control cells had no significant difference, which represented the cytoskeletal changes in IGFBP6 knockdown VSMCs.
The mechanism involved in the alteration of cytoskeletal morphology in IGFBP6-silenced VSMCs was unclear. As reported, the centrosome is the major microtubule-organizing center (MTOC) in cells and plays important roles in intracellular transport, cellular morphology, and motility (Fu, Hagan, & Glover, 2015; Sanchez & Feldman, 2017). Our results indicated that IGFBP6 knockdown in VSMCs decreased the activity of cyclin E–CDK2. As reported, several CDK2 substrates could initiate centrosome replication (Meraldi, Lukas, Fry, Bartek, & Nigg, 1999). Thus, the role of IGFBP6 in centrosome replication was further investigated.
One CDK2 substrate, nucleophosmin, initiates centrosome replication (Meraldi et al., 1999). Therefore, we detected the expression levels of nucleophosmin and p-nucleophosminT199 in IGFBP6-silenced VSMCs. Expression of p-nucleophosminT199 was significantly decreased in IGFBP6-silenced VSMC, while expression of total nucleophosmin showed no changes (Figure 8b). These results indicate that IGFBP6 knockdown in VSMCs declines the activity of cyclin E–CDK2 complex, which arrests centrosome replication at the initial stage.
We further stained pericentrin to observe centrosome duplication and location (Figure 8c). Centrosomes that moved to the opposite sides of the nucleus were separated centrosomes (Figure 8c, I and II), and centrosomes that were located on the same side of the nucleus were unseparated centrosomes (Figure 8c, III and IV). The proportion of unseparated centrosomes in IGFBP6-silenced VSMCs was significantly higher than that in the negative control. Furthermore, the proportion of separated centrosomes in IGFBP6-silenced VSMC was significantly lower than that of the negative control (Figure 8d). Therefore, IGFBP6 knockdown could affect the process of centrosome duplication in VSMC.
These results indicated that IGFBP6 knockdown arrests the centrosome replication in VSMCs and the arrest of centrosome replication further changes the cytoskeletal morphology of VSMCs.
3.7 IGFBP6 was involved in VSMC proliferation in varicose vein tissues
As we explored above, IGFBP6 knockdown increased cyclin E ubiquitination, which resulted in the arrest of cell cycle and centrosome replication. We conclude that IGFBP6 knockdown impairs the proliferation and changes the morphology of VSMCs. IGFBP6 was significantly upregulated in varicose vein tissues in our protein array detection with the validation by RT-qPCR and immunoblotting assays. Thus, we speculated that IGFBP6 promote VSMC proliferation in varicose vein disease.
To conform our inference, we researched proliferation-related alterations in varicose vein compared with normal vein. As reported, VSMCs in varicose vein disease have a transition from a contractile phenotype to a synthetic phenotype and express less a-SMA (Huang et al., 2019). We found that the expression of a-SMA was significantly downregulated in the neointima of VV compared with NV, which indicated VSMC hyperplasia in the neointima area (Figure 9a,b). We further explored the expression of IGFBP6 and the proliferative marker, Ki-67. IGFBP6 was highly expressed in VV compared with NV, and meanwhile IGFBP6 expression in the neointima area was higher than the media area of VV (Figure 9c–f). And Ki-67 was also significantly highly expressed in VV, especially in the neointima area of VV (Figure 9c–f).
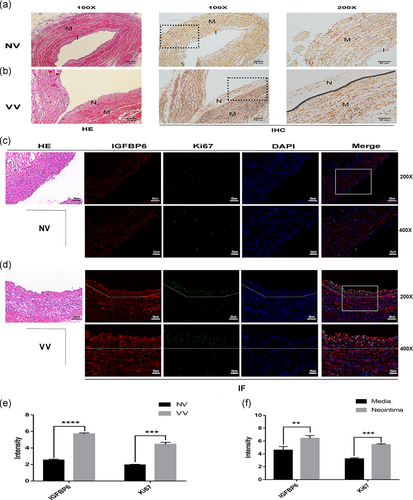
These results contribute to our conclusion that the upregulation of IGFBP6 in varicose vein is closely related to VSMC proliferation and involved in varicosity progression.
4 DISCUSSION
In this study, to clarify the mechanism involved in the development of varicose veins, we used a protein array to identify the DEPs. IGFBP6 was upregulated among the DEPs in varicose vein tissue. Furthermore, RT-qPCR and immunoblotting assays also verified the IGFBP6 alteration in varicose veins. The IGFBP6 upregulation in varicose vein contributed to our hypothesis that IGFBP6 was involved in the development of varicose veins. As reported, IGFBP6 could regulate various biological activities, including cell proliferation, in IGF-independent and IGF-dependent manners (Bach et al., 2013; Bach, 2015; Bach, 2016). And IGFBP6 was closely related to cell proliferation in our GO enrichment analysis.
VSMC proliferation are often noted in varicose veins (Lim & Davies, 2009). As an important factor in the venous wall structure, VSMC hyperplasia is vital to the development of varicose veins (Lim & Davies, 2009; Naoum et al., 2007). Therefore, we explored the correlation between IGFBP6 and VSMC proliferation. IGFBP6 knockdown significantly inhibited VSMC proliferation, which was consistent with our hypothesis. Furthermore, the cell cycle analysis indicated that the cell cycle was arrested in the S phase in IGFBP6-silenced VSMCs.
As the cell cycle was arrested in IGFBP6-silenced VSMC, we further explored the expression levels of cyclin E, cyclin A, and CDK2, which were closely related to the S phase entry and progression (Bertoli, Skotheim, & de Bruin, 2013; Cobrinik, 2005). CDK2 can bind cyclin E to form the cyclin E/CDK2 complex and to induce subsequent cascade reactions, which contribute to the G1/S transition and the onset of DNA synthesis (Caldon & Musgrove, 2010; Hwang & Clurman, 2005; Siu et al., 2012). We observed that the total cyclin E expression and the p-CDK2T16 expression significantly decreased in IGFBP6-silenced VSMCs. Cyclin D and cyclin A can bind to CDK2 to regulate the G1/S transition and the S phase progression (Bertoli et al., 2013; Copeland, Sercombe, Wilson, & Coverley, 2015; Gopinathan et al., 2014; Kanakkanthara et al., 2016; Oakes et al., 2014; Willmer, Peres, Mowla, Abrahams, & Prince, 2015). However, our results indicated that cyclin D and cyclin A were not consistent with the S phase arrest. Thus, we conclude that reduced total cyclin E and subsequently reduced p-CDK2T160 were responsible for the S phase arrest in IGFBP6-silenced VSMCs.
Cyclin E can be phosphorylated at several positions and then be degraded through ubiquitin-proteasome system system, which is mediated by SCF complex (Daub et al., 2008; Hao et al., 2007; Koepp et al., 2001; Welcker et al., 2003; Ye et al., 2004). We evaluated the phosphorylated forms of cyclin E to clarify the mechanism underlying the reduced cyclin E expression. We found p-cyclin ET395 expression significantly increased in IGFBP6 knockdown VSMCs, which promoted cyclin E destruction via ubiquitination. Thus, we speculated that IGFBP6 knockdown may participate in the protein ubiquitination degradation process. From the results of Co-IP and mass spectrometry analyses, Skp1, one substrate of SCF complex, was found to be one interacting protein of IGFBP6. Meanwhile, the endogenous cyclin E ubiquitination remarkably increased after IGFBP6 knockdown in VSMCs. In conclusion, IGFBP6 knockdown increased cycle E ubiquitination and impaired VSMC proliferation.
Meanwhile, we found that centrosome replication was arrested and cytoskeletal morphology was significantly changed in IGFBP6-silenced VSMCs. VSMCs lost their spindle shape and the distribution of β-tubulin significantly changed in IGFBP6-silenced VSMCs. These changes might be related to centrosome due to its role in regulating cytoskeletal morphology. CDK2 plays a positive role in centrosome duplication (Fu et al., 2015), and nucleophosmin, one of the centrosome-associated CDK2 substrates, could activate centrosome duplication (Ye et al., 2004). In this study, the p-nucleophosminT199 expression was notably decreased in IGFBP6 knockdown VSMCs. These findings indicated that IGFBP6 knockdown downregulated the activity of cyclin E–CDK2 and further inhibited the centrosomes by reducing phosphorylation of nucleophosmin, which altered the morphology of VSMCs.
However, there may be a controversial issue about the effect of IGFBP6 on cell proliferation. IGFBP6 was reported to negatively regulate cell proliferation (Bach et al., 2013; Bach, 2015; Bach, 2016; Raykha et al., 2013). However, IGFBP6 knockdown in our research impairs VSMC proliferation, which shows the difference between previous studies and our research. IGFBP6 showed mitogenic and antiapoptotic effects in human osteosarcoma cell line and could interact with Ku80 to promote the proapoptotic effect (Iosef et al., 2010; Schmid, Keller, Gosteli-Peter, & Zapf, 1999). And, IGFBP6 was reported to participate in the Shh-Gli1 signaling pathway to maintain pancreatic cancer cell survival (Xu et al., 2009). These studies seem to support our research but the mechanism was obscure. For the reason that IGFBP6 can exert regulating effect through IGF-independent mechanism except for IGF-dependent, impaired VSMC proliferation after IGFBP6 knockdown may be independent of IGF-II. According to the previous studies, IGFBP6 regulates other biological functions such as cell migration and angiogenesis more than cell proliferation through IGF-independent mechanism (Bach, 2015, 2016). Meanwhile, the high IGFBP6 expression can also be seen in some cancers (Bach, 2015; Bach et al., 2013). Thus, the complicated expression and regulation of IGFBP6 need more research.
On the basis of our results that IGFBP6 knockdown impairs VSMC proliferation, we explored the proliferation promoting effect of IGFBP6 in varicose vein disease. We found significant VSMC hyperplasia in varicose vein tissues and our results showed the high expression of IGFBP6 in neointima of VV, which was the same as the expression of Ki-67. Thus, we conclude that IGFBP6 is involved in VSMC hyperplasia and the development of varicose vein disease. Our research will provide unprecedented insights into the underlying pathogenesis of varicose veins.
ACKNOWLEDGMENTS
The authors gratefully acknowledge financial support from the National Natural Sciences Foundation of China (Nos. 81070258, 81270378, 81370368 and 81670439).
CONFLICT OF INTERESTS
The authors declare that there are no conflict of interests.
AUTHOR CONTRIBUTIONS
Z. W., W. L., and S. W. participated in the conception and design of the study. Y. Q., R. W., and W. W. were involved in data collection. M. W., Z. L., and R. L. performed the statistical analysis and preparation of figures. Z. W. and Y. Q. drafted the paper. S. W., W. L., and C. Z. contributed substantially to its revision. All authors read and approved the final manuscript.
Open Research
DATA AVAILABILITY STATEMENT
The data that support the findings of this study are available from the corresponding author upon reasonable request.


