MicroRNA-145 induces the senescence of activated hepatic stellate cells through the activation of p53 pathway by ZEB2
Abstract
Activation of quiescent hepatic stellate cells (HSCs) is the major event in liver fibrosis, along with enhancement of cell proliferation and overproduction of extracellular matrix. Recent findings suggest that senescence of activated HSCs might limit the development of liver fibrosis. The p53, a guardian of the genome is associated with liver fibrosis, has been shown to regulate HSCs senescence. In this study, we report that microRNA-145 (miR-145) and p53 were downregulated in vivo and in vitro, concomitant with the enhanced expression of zinc finger E-box binding homeobox 2 (ZEB2). In addition, overexpression of miR-145 and p53 led to upregulation of the number of senescence-associated β-galactosidase-positive HSCs and the expression of senescence markers p16 and p21, along with the reduced abundance of HSC activation markers α-smooth muscle actin and type I collagen in activated HSCs. Furthermore, silencing of ZEB2 promoted senescence of activated HSCs. Moreover, we also demonstrated that miR-145 specifically targeted the 3′-untranslated regions of ZEB2. In vitro promoter regulation studies show that ZEB2 could bind to the E-box of the p53 promoter as well as inhibit its promoter activity and thus suppress the expression of p53, which in turn repressed activated HSCs senescence. Taken together, our results describe a novel miR-145-ZEB2-p53 regulatory line might participate in the senescence of activated HSCs and might carry potential therapeutic targets for restraining liver fibrosis.
1 INTRODUCTION
Liver fibrosis is known as a common wound-healing event responding to various chronic liver diseases, which characterizes accumulation of the extracellular matrix (ECM; Chen et al., 2016; Wang et al., 2014; Zhou et al., 2016). Activation of hepatic stellate cells (HSCs) is recognized as a vital step in liver fibrosis and results in the acquisition of multiple functions including contraction, chemotaxis, and matrix remodeling (Kawada, Klein, & Decker, 1992; Rockey, 1995; Soon & Yee, 2008). The activated of HSCs is the most important process in the development of liver fibrosis. Typically, inhibition of cell proliferation and induction of apoptosis are potential strategies to block the activation of HSCs (Lee & Friedman, 2011; Roderburg et al., 2013; Yin, Evason, Asahina, & Stainier, 2013). Recent evidence has revealed that the senescence of activated HSCs was also an important step in limiting the fibrogenic response to liver tissues damage (Jin et al., 2016; Krizhanovsky et al., 2008; Li et al., 2012; Schrader, Fallowfield, & Iredale, 2009).
Senescence is a cellular response triggered by various types of stimulations. Once cells become senescent, it undergoes morphologic changes, loses the ability to progress through the cell cycle, and gets arrested at the G0/G1 phase. The proliferation capacity of senescent cells reduced remarkably compared with nonsenescent cells that leads to permanent growth arrest in the cell (Krizhanovsky et al., 2008; Kuilman, Michaloglou, Mooi, & Peeper, 2010). After becoming senescence, activated HSCs stop proliferation and express reduced levels of ECM components but increased levels of ECM-degrading enzymes (Krizhanovsky et al., 2008; Schnabl, Purbeck, Choi, Hagedorn, & Brenner, 2003). The p53, a tumor suppressor gene, has been shown to regulate HSCs senescence. Deletion of the important cell cycle regulator p53 reduces HSCs senescence leading to extensive liver fibrosis (Krizhanovsky et al., 2008). One central role of the p53 is to promote senescence via arresting the cell cycle (Elmore et al., 2002). Recently, accumulating evidence has shown that p53 can lead to cell cycle arrest, DNA repair, and apoptosis predominantly when it becomes transcriptionally active in response to DNA damage, oncogene activation, and hypoxia (Adamovich, Adler, Meltser, Reuven, & Shaul, 2014; Tyner et al., 2002). The p53 can downregulate the expression of many genes which are essential for the progression through the cell division cycle (Adamovich et al., 2014). Deletion of p53 is found to reduce HSC senescence leading to extensive liver fibrosis (Krizhanovsky et al., 2008). Therefore, p53 may play a potential role in liver fibrosis, which could regulate HSCs senescence.
MicroRNA (miRNA) are small noncoding RNAs that base-pair with the 3′-untranslated regions (UTRs) of protein-encoding messenger RNAs (mRNAs), resulting in mRNA destabilization and/or translational inhibition (Bartel, 2004; Peng & Croce, 2016; Zhang, Liu, & Wang, 2014). MiRNAs function as regulatory molecules of gene expression with multifaceted activities that exhibit direct or indirect oncogenic properties (Bartel, 2004; Drusco & Croce, 2017; He & Hannon, 2004). It has demonstrated that several miRNAs could regulate the activation and senescence of HSCs through regulating antifibrotic and profibrotic gene expression (He et al., 2012; Noetel, Kwiecinski, Elfimova, Huang, & Odenthal, 2012; Roderburg et al., 2013). Increasingly study results have demonstrated that miR-145 is downregulated in various types of cancer, including colorectal cancer, hepatocellular cancer, and so on (Men et al., 2017; Wei, Wen-Ming, & Jun-Bo, 2017). Additionally, our previous study indicated that miR-145 plays a role in limiting the development of liver fibrosis by markedly blocking the activation and proliferation of HSCs (Yang et al., 2017; Zhou et al., 2016). Our previous studies have also demonstrated that downregulation of zinc finger E-box binding homeobox 2 (ZEB2) negatively regulated transforming growth factor β-1 (TGF-β1)-induced HSCs activation, proliferation, and apoptosis. Moreover, miR-145 specifically targeted the 3′-UTR regions of ZEB2 (Yang et al., 2017; Zhou et al., 2016). Interestingly, one recent study reported that p53 promoter enhancer box (E-box) could be regulated by ZEB1/2 (Deshpande et al., 2013; Roy, Beamon, Balint, & Reisman, 1994). Attractively, it is interesting to explore the mechanism underlying the induction of HSCs senescence in liver fibrosis.
In the current study, we found that miR-145 expression is highly decreased in liver fibrosis tissues and activated HSCs and that the upregulation of miR-145 and downregulation of ZEB2 exacerbated senescence of activated HSCs. Mechanistic studies suggest that miR-145 promoted the senescence of activated HSCs in a p53-dependent manner by ZEB2.
2 MATERIALS AND METHODS
2.1 Animal studies
Adult (8-week-old) male C57BL/6J mice from the Experimental Animal Center of Anhui Medical University were used for carbon tetrachloride (CCl4) liver fibrosis model mice. All experimental procedures were approved by the institutional and local committee on the care and use of animals of Anhui Medical University. Liver fibrosis was generated by the biweekly intraperitoneal dose of a 20% solution of CCl4 in olive oil (0.02 ml/g for a mouse) for the first 6 weeks and then twice a week as previously described. After 8 weeks, the liver was fixed in 4% buffered paraformaldehyde for histological analysis of liver fibrosis and immunostaining analysis or HSCs were isolated for western blot analysis. Serum was harvested for the further analysis.
All experiments were performed according to the institutional ethical guidelines for laboratory animal care and use of Anhui Medical University. Procedures involve animals and their cares were conducted in conformity with NIH guidelines and was approved by the Animal Care and Use Committee (number: LLSC20150348).
2.2 Cell culture
Rat HSC cell line HSC-T6 was purchased from Cell Bank of Chinese Academy of Sciences (Shanghai, Chinese). The human HSC line (LX-2) was purchased from Xiang Ya Central Experiment Laboratory (China). HSC-T6 cells were cultured in Dulbecco's Modified Eagle's Medium (DMEM; Invitrogen, Grand Island, NY) with 10% fetal bovine serum (FBS; Sijiqing Biological Engineering Materials, Hang Zhou, China) and 1% antibiotics. LX-2 cells were cultured in DMEM (Gibco, Cambridge, MA) supplemented with 10% FBS (Termo). Cells were grown in a 95% air and 5% CO2 humidified atmosphere at 37°C.
2.3 Immunofluorescence analysis
Immunofluorescence staining with liver tissues or treated cells were performed as we had previously reported, the cells were incubated with the primary antibodies against p53 (Santa Cruz Biotechnology, Dallas, TX), α-smooth muscle actin (α-SMA; Santa Cruz Biotechnology), or ZEB2 (Santa Cruz Biotechnology) and then incubated with the second antibodies. 4′,6-Diamidino-2-phenylindole (DAPI) was used to stain the nucleus in liver tissues. Hoechst reagent was used to stain the nucleus of HSCs in vitro. All the images were captured with the fluorescence microscope (Olympus, Tokyo, Japan) and representative images were shown. The red represents ZEB2 or p53 and α-SMA as green fluorescence.
2.4 Primary HSCs isolation
Primary HSCs were extracted via pronase/collagenase perfusion and differential centrifugation. The mice were treated with hydrolyzed trichloroacetaldehyde (Aladdin, Beijing, China). After placing a line around the portal vein, a special needle was inserted into the vein. Then perfusion buffer perfused liver via the portal vein. After the liver swelled, the cannula in the inferior vena cava was opened to allow draining. Subsequently, the liver was perfused in turn with enzymes fix after the blood was washed away and then the liver turns white. Finally, the liver was gently removed from the abdominal cavity and placed in a sterile dish. Then the livers were disrupted to prepare cells suspension which was filtered to remove residual debris. After cell suspension centrifugation by several times, the cell suspension density was adjusted with Nycodenz (Doobio, Beijing) mixture. The primary HSCs were acquired from the gradient centrifugation.
2.5 Analysis of HSC senescence
The senescence-associated β-galactosidase (SA-β-Gal) assay was performed using a senescence staining kit (Beyotime, Shanghai, China). Briefly, cells were plated onto 6-well culture plates, transfected with small interfering RNA (siRNA) or plasmid and inhibitor or mimics, then washed once with cleaning solution, and fixed with a fixation solution for 5 min at room temperature. Cells were washed three times with an acidic solution and incubated with the staining solution overnight at 37°C before microscopic analysis. All the images were captured with a light microscope and representative images were shown. Results were from triplicate experiments.
2.6 Cell cycle analysis by flow cytometry
Distribution of cell cycle was determined by propidium iodide (PI) staining and flow cytometry analysis. HSCs were seeded in 6-well plates. Cells were collected into flow cytometry tubes and centrifuged at 2,000 rpm for 5 min to obtain cell pellets. For cell cycle analysis, collected cells were washed with cold PBS and fixed in 70% ethanol at 4°C for 1 hour or at −20°C overnight. The fixed cells were washed with PBS and incubated with RNAase A (0.1 mg/ml) for 30 min followed by incubation with PI (50 mg/ml) for 30 min at room temperature. Cell cycle analysis was performed with a Coulter Epics XL Flow Cytometry System (Beckman-Coulter, Miami, FL). Cell cycle phases were determined using the Modfit software (Verity Software House, Topsham, ME).
2.7 Liver histopathology
Harvested liver tissues were fixed in 4% neutral-buffered formalin and embedded in paraffin. Liver slices of 50-μm thick were prepared and stained with hematoxylin and eosin stain (H&E) and Masson's trichrome stain by using standard methods. For Sirius red collagen staining, thin sections were deparaffinized and stained with picrosirius red for 1 hr at room temperature. After washes, sections on the slides were dehydrated in 100% ethanol and in xylene, and then they were mounted in permount. Photographs were taken in a blinded fashion at random fields. Representative views of liver sections are shown.
2.8 Serum measurements
Serum was collected and assayed for alanine aminotransferase (ALT), aspartate aminotransferase (AST), total bilirubin (TBIL), and albumin (ALB) and was measured by using VetTest Chemistry analyzer (IDEXX Laboratories, Westbrook, ME) according to the manufacturer's instruction.
2.9 Luciferase reporter assay
The luciferase reporter plasmid P53 (pYr-PromDetect-TP53) was purchased from Changsha Yingrun Biotechnology Co. Ltd. (Hunan, China). Cells were seeded into a 24-well plate and collected after cotransfecting luciferase report vectors (pYr-ZEB2–3U and pYr-TP53p) with either miR-145 mimics, ZEB2-siRNA, or control vector by using Lipofectamine™ 2000 (Invitrogen, Carlsbad, CA). Luciferase activity was detected by using a Dual-Luciferase Reporter Assay Kit (Beyotime Biotechnology, Shanghai, China) according to the manufacturer's protocol. Luciferase activity was normalized by cotransfecting with pRL-TK (Promega, Madison, WI). All experiments were repeated three times.
2.10 Cell transfection
To downregulate or upregulate the expression of miR-145, ZEB2, and p53, miR-145 mimics, inhibitor, ZEB2 and p53-siRNA, or corresponding control RNA were used. The transfection was performed by using Lipofectamine™ 2000 (Invitrogen) according to the manufacture's protocols. Transfection after 6 hr, the culture medium was changed and TGF-β1 was added. Cells were reincubated in complete medium at 37°C for an additional 24 hr. After 3 days, cells were collected for quantitative real-time polymerase chain reaction (qRT-PCR) or western blot analysis. MiR-145 mimics, miR-145 inhibitor, ZEB2-siRNA, and p53-siRNA were purchased from GenePharma (Shanghai, China). The sequences are as following:
miR-145 inhibitor: 5′-AGGGAUUCCUGGGAAAACUGGAC-3′,
miR-145 mimics: 5′-GUCCAGUUUUCCCAGGAAUCCCU
GGAUUCCUGGGAAAACUGGACUU-3′; p53-siRNA (sense): 5′-CCACCAUCCACUACAACUATT-3′, p53-siRNA (antisense): 5′-UAGUUGUAGUGGAUGGUGGTT-3′; ZEB2-siRNA: 5′-CCAUCUCUGCUCAGAGUCCAATT-3′, 5′-UUGGACUCUGAGCAGCAGAGCAGAUGGTT-3′; negative control: 5′-UUCUCCGAACGUGUCACGUTT-3′, 5′-ACGUGACACGUUCGGAGAATT-3′.
2.11 Plasmid transfection
Overexpression plasmid of ZEB2 (ZEB2-OE) was obtained by amplifying complementary DNA (cDNA) coding for ZEB2 cDNA and inserting cDNA coding for ZEB2 into destination vectors by Gateway cloning (Invitrogen). The N-terminal region of ZEB2 coding region containing the predicted CARD domain was cloned into pEGFP-C2 vector by using restriction sites XbaI and BamHI. In addition, the p53 plasmid (p53-OE) was purchased from GenePharma (Shanghai, China). ZEB2 and p53 plasmid were transfected by using Lipofectamine™ 2000 (Invitrogen) in accordance with the manufacturer's instructions.
2.12 RNA extraction and qRT-PCR
Total cellular RNAs in cells were isolated with TRIzol Reagent (Invitrogen) according to the manufacturer's protocol. Reverse transcription was conducted with a PrimeScript RT Reagent Kit with gDNA eraser (TaKaRa, Dalian, China). The qRT-PCR was performed using the ABI Prism 7500 Sequence Detection System (Applied Biosystems, Foster City, CA). PCR was catalyzed by SYBR Green Master (TAKARA BIO Inc, Shiga, Japan). Glyceraldehyde phosphate dehydrogenase (GAPDH) was used as the invariant control. Fold changes in the mRNA levels of target genes related to the invariant control GAPDH were calculated according to the suggested method. U6 was used as the internal control for the expression of miRNA. The relative expression of each gene was calculated using the method. The following primers of genes were used:
ZEB2 (human) (forward: 5′-CCCTTCTGCGACATAAATACGA-3′,
reverse: 5′-TGTGATTCATGTGCTGCGAGT-3′);
P53 (human) (forward: 5′-CGAAAGAAGACAGGCAGACTTTTCG-3′,
reverse: 5′-GAAGGTAAGGATAGGTCGGCGGTTC-3′);
GAPDH (human) (forward: 5′-ACCACAGTCCATGCCATCAC-3′,
reverse: 5′-TCCACCACCCTGTTGCTGTA-3′).
2.13 Western blot analysis
Protein extraction and subsequent analysis was performed as previously described (Yang et al., 2017; Zhou et al., 2016). Densitometric analysis of individual bands was performed using Image J software (National Institutes of Health, Bethesda, MD). Primary antibodies were as follows: ZEB2 (Santa Cruz Biotechnology), p16, p21, p53, Col. I (Abcam), α-SMA (Sigma, St. Louis, MO), and β-actin (Bio world, Beijing, China).
2.14 Statistical analysis
PRISM Software (Graphpad, San Diego, CA) was used for data analysis. Results are expressed as mean ± SD from multiple experiments. Student t tests were used to compare two groups. Variables with values of p < 0.05 by univariate analysis were used in subsequent multivariate analysis based on the Cox proportional hazards model. The differences were considered statistically significant at p < 0.05.
3 RESULTS
3.1 MiR-145 was downregulated in CCl4-treated liver tissues, primary HSCs, and TGF-β1-induced HSCs
Mice treated with CCl4 by using intraperitoneal injection were characterized by steatosis, expansion of cytoplasm, gradual conversion to myofibroblasts, and inflammatory infiltration. The pathological change of liver fibrosis tissues was detected by H&E staining, Masson staining, and picrosirius red staining. Histopathological analysis results showed that CCl4 treatment resulted in serious hepatic steatosis, necrosis, and formation of regenerative nodules and fibrotic septa compared to normal groups (Figure 1a). In addition, serum AST and ALT activities, ALB and TBIL levels were detected by using kits. The results demonstrated that serum AST and ALT activities as well as TBIL levels were significantly increased in liver fibrosis induced by CCl4 compared with normal groups. However, the serum ALB was decreased in CCl4-induced liver fibrosis compared with normal groups (Figure 1b). We also examined the protein expression of α-SMA and Col. I by using western blot analysis, which are widely accepted as fibrosis markers in liver fibrosis. As shown in Figure 1c, expression of α-SMA and Col. I was noticeably increased in liver fibrosis induced by CCl4 compared with normal groups. Based on these observations, the liver fibrosis models were established successfully. Thus we examined the expression of miR-145 in liver fibrosis tissues, primary HSCs, and TGF-β1-induced (10 ng/ml) HSCs. The qRT-PCR results showed that the expression of miR-145 was significantly lower in CCl4-induced liver fibrosis compared with normal groups. Additionally, HSC-T6 cells and LX-2 cells were treated with TGF-β1 (10 ng/ml) for 24 hr. The results showed that the expression level of miR-145 was downregulated in HSC-T6 cells and LX-2 cells treated with TGF-β1 compared with not treated with TGF-β1 (10 ng/ml; Figure 1d). Next, we further measured whether there is any change in senescence between nonactivated HSCs and activated HSCs, particularly in the development of liver fibrosis. We found that the protein level of p16 and p21 were decreased in primary HSCs compared with the normal groups (Supplementary Information Figure 1a). In general, the finding revealed that miR-145 was decreased in activated HSCs.
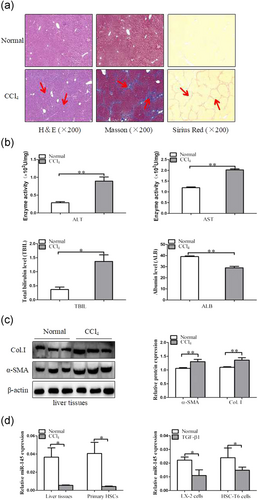
The expression of miR-145, α-SMA, and Col. I during liver fibrosis. (a) Pathology observation of the human liver fibrotic tissues sections stained with H&E, Masson's trichrome staining and sirius staining (×200). (b) Serum level of ALT, AST, ALB, and TBIL were measured (n = 6). (c) Western blot analysis of α-SMA and Col. I with β-actin as the loading control. The assays were performed at least three times with similar results. (d) The qRT-PCR analysis of miR-145 mRNA levels in CCl4-treated liver tissues, primary HSCs, activated LX-2 cells, and activated HSC-T6 cells by TGF-β1 (10 ng/ml). Data are shown as the mean ± SD (n = 3) of one representative experiment; *p < 0.05 and **p < 0.01 versus normal groups. ALT: alanine aminotransferases; AST: aspartate aminotransferases; ALB: albumin; miR-145: microRNA-145; α-SMA: α-smooth muscle actin; Col. I: type I collagen; H&E: hematoxylin and eosin staining; HSCs: hepatic stellate cells; TBIL: total bilirubin; TGF-β1: transforming growth factor β-1 [Color figure can be viewed at wileyonlinelibrary.com]
3.2 MiR-145 inhibits fibrosis by promoting senescence in activated LX-2 cells
To investigate the effect of miR-145 on activated HSCs, we established stably downexpression or overexpression of miR-145 by using miR-145 inhibitor and miR-145 mimics in LX-2 cells treated with TGF-β1 (10 ng/ml). The flow cytometry results showed that ectopic expression of miR-145 in LX-2 cells significantly increased the number of cells in the G1 phase but decreased the number in LX-2 cells in the S phase compared with the negative control-transfected cells (Figure 2a). To further investigate the impact of miR-145 on senescence, SA-β-gal, a senescence-associated marker, was used to examine senescence in LX-2 cells after miR-145 inhibitor or miR-145 mimics treatment. As anticipated, we observed high numbers of SA-β-Gal-positive cells treatment with miR-145 mimics (Figure 2b). Western blot analyses of senescence-associated genes consistently showed that miR-145 mimics treatment upregulated the expression of senescence markers p16 and p21. Interestingly, silencing of miR-145 remarkably decreased the protein level of p16 and p21 in activated LX-2 cells (Figures 2c,d).
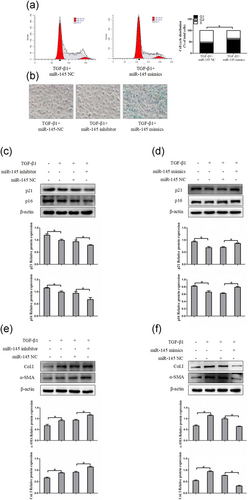
MiR-145 induces G1/S cell cycle arrest and promote cellular senescence of HSCs in vitro. (a) Cell cycle distribution was measured by flow cytometry analysis. (b) MiR-145-induced senescence as indicated by SA-β-Gal activities. Representative images of SA-β-Gal staining are presented. (c) The protein expression of p16 and p21 were measured by western blot analyses in activated LX-2 cells transfected with miR-145 inhibitor. (d) The protein expression of p16 and p21 were assessed by western blot analyses in activated LX-2 cells transfected with miR-145 mimics. (e, f) The expression of α-SMA and Col. I protein was determined by western blot analyses in activated LX-2 cells. The assays were performed at least three times with similar results. Data are shown as the mean ± SD (n = 3) of one representative experiment; ∗p < 0.05 and ∗∗p < 0.01 versus normal groups. α-SMA: α-smooth muscle actin; Col. I: type I collagen; HSCs: hepatic stellate cells; MiR-145: microRNA-145; NC: negative control; SA-β-Gal: senescence-associated β-galactosidase; TGF-β1: transforming growth factor β-1 [Color figure can be viewed at wileyonlinelibrary.com]
As modulation of senescence of activated HSCs could be an important complementary pathway in preventing liver fibrosis, we examined whether the expression level of miR-145 was associated with the severity of liver fibrosis. As shown in Figure 3e, the miR-145 inhibitor increased the levels of α-SMA and Col. I protein compared with normal cells without inhibitor transfection in activated LX-2 cells. Whereas, overexpression of miR-145 suppressed the expressions of α-SMA and Col. I (Figure 2f). Collectively, these data demonstrated that miR-145 may be inducing senescence in activated HSCs, thereby, potentially slowing down liver fibrogenesis.
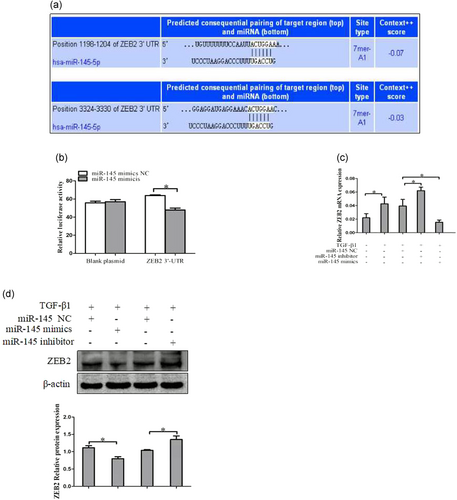
ZEB2 is a direct target of miR-145 in activated HSCs cells. (a) The target genes of miR-145 were predicted by using bioinformatics tools (TargetScan, CLIP-Seq, miRDB, and miRanda). (b) A miR-145 mimic or negative control and a luciferase vector encoding the wild-type or mutant ZEB2 3′-UTR region were cotransfected into LX-2 cells, and the relative luciferase activity was measured. (c) Quantitative real-time polymerase chain reaction analysis for mRNA expression of ZEB2 after transfected with miR-145 mimics, miR-145 inhibitor, or miR-145 NC. (d) Western blot analysis for protein expression of ZEB2 after transfected with miR-145 mimics, miR-145 inhibitor, or miR-145 NC. The assays were performed at least three times with similar results. Data are shown as the mean ± SD (n = 3) of one representative experiment; ∗p < 0.05 and ∗∗p < 0.01 versus normal groups. HSCs: hepatic stellate cells; miR-145: microRNA-145; NC: negative control; TGF-β1: transforming growth factor β-1; 3′-UTR: 3′-untranslated region; ZEB2: zinc finger E-box binding homeobox 2 [Color figure can be viewed at wileyonlinelibrary.com]
3.3 ZEB2 is a direct target of miR-145 in HSC cells
To understand the potential mechanisms by which miR-145 regulates HSCs senescence, we used bioinformatics tools (TargetScan, miRDB, and miRanda) to predict the target genes of miR-145. The miRNA target prediction-algorithm predicted that the 3′-UTR of ZEB2 mRNA contains putative miR-145 binding sites (Figure 3a). To determine whether miR-145 regulates ZEB2 by binding to the corresponding 3′-UTRs, we cloned the 3′-UTR from ZEB2 into the pmirGLO luciferase reporter vector and cotransfected these vectors with miR-145 or control mimics into LX-2 cells, and evaluate ZEB2 response to miR-145 by using double luciferase reporter assay. The results showed that miR-145 could significantly reduce ZEB2 luciferase activity in LX-2 cells (Figure 3b). Furthermore, we found that overexpression of miR-145 decreased the level of ZEB2 mRNA in LX-2 cells, whereas transfection with miR-145 inhibitor increased the level of ZEB2 mRNA in LX-2 cells (Figure 3c). There results were confirmed by western blot analysis (Figure 3d). Next, we further measured whether manipulation of ZEB2 influences the induction of senescence by microRNA-145 (miR-145) in HSCs, the protein expression of p16 and p21 were detected by using western blot in activated LX-2 cells that was cotransfection of miR-145 inhibitor and ZEB2-siRNA, compared with miR-145 inhibitor. We found that the protein level of p16 and p21 was increased compare with miR-145 NC or miR-145 inhibitor (Supplementary Information Figure 1B). Taken together, these results provided evidence that miR-145 specifically targets the 3′-UTR regions of ZEB2 and thus inhibits the expression of genes.
3.4 ZEB2 suppresses HSCs senescence in liver fibrosis
3.4.1 Increased ZEB2 expression in vivo and in vitro
We examined expression of ZEB2 in liver fibrosis tissues. The colabeling ZEB2 and α-SMA was performed for colocalization. CCl4-induced liver fibrosis showed a significant increase in ZEB2 compared with normal liver tissues, as examined by immunofluorescence (Figure 4a) and western blot analysis (Figure 4c). Importantly, the double immunofluorescence staining showed that the expression of ZEB2 was primarily colocalized with α-SMA, indicating that HSCs can be considered as one of the main sources of the ZEB2 levels present in CCl4-induced liver fibrosis (Figure 4a). We further confirmed the expression of ZEB2 in TGF-β1-induced LX-2 cells and HSC-T6 cells. Interestingly, TGF-β1 could simultaneously increase the level of ZEB2 in LX-2 cells and HSC-T6 cells, as examined by using immunofluorescence (Figure 4b) and western blot analysis (Figure 4d). Collectively, these data suggested that ZEB2 is significantly increased in liver fibrosis tissues, LX-2 cells, and HSC-T6 cells.
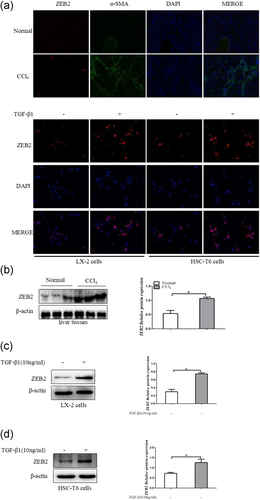
The expression of ZEB2 in vivo and in vitro. (a) Immunofluorescence staining with ZEB2 and α-SMA were performed to detect the colocalization of ZEB2 (red) and α-SMA (green) in liver fibrosis tissues. Representative images of Immunofluorescence staining are presented (×100). (b) Immunofluorescence with ZEB2 (red) in LX-2 cells and HSC-T6 cells after TGF-β1 (10 ng/ml) treatment of 24 hr. (c) The protein expression of ZEB2 was analyzed by using western blot analysis in CCl4-treated liver tissues. (d) The protein expression of ZEB2 was analyzed by western blot analysis in LX-2 cells and HSC-T6 cells treated with TGF-β1 (10 ng/ml) for 24 hr. The assays were performed at least three times with similar results. Data are shown as the mean ± SD (n = 3) of one representative experiment. ∗p < 0.05 and ∗∗p < 0.01 versus normal groups. α-SMA: α-smooth muscle actin; DAPI: 4′,6-diamidino-2-phenylindole; HSCs: hepatic stellate cells; TGF-β1: transforming growth factor β-1; ZEB2: zinc finger E-box binding homeobox 2 [Color figure can be viewed at wileyonlinelibrary.com]
3.4.2 ZEB2 suppresses cell senescence in activated LX-2 cells
To analyze the role of ZEB2 in the progression of liver fibrosis, we further assessed the effects of ZEB2 silence and overexpression on HSCs senescence in vitro. ZEB2-siRNA and ZEB2-plasmid were transfected into activated LX-2 cells. We found that downregulation of ZEB2 significantly increased the proportion of cells in the G1 phase of the cell cycle by using flow cytometry (Figure 5a). Moreover, SA-β-Gal staining showed that the SA-β-Gal activities induced by ZEB2-siRNA and inhibited by ZEB2-OE (Figure 5b). To further confirm the above results, HSCs were activated by TGF-β1 (10 ng/ml) and directly used for western blot analyses of p16 and p21. The results indicated that ZEB2-siRNA markedly increased the expression of p16 and p21 in activated LX-2 cells (Figure 5c). Opposite results were obtained by western blot analysis of p16 and p21 in LX-2 cells treated with ZEB2 plasmid (Figure 5d).Then we further examined the expression of α-SMA and Col. I at protein levels. Results of western blot analysis showed that ZEB2 plasmid resulted in increased protein levels of α-SMA and Col. I (Figure 5e). Whereas, the protein levels of α-SMA and Col. I were markedly decreased by ZEB2-siRNA treatment (Figure 5f). These data collectively suggested that ZEB2 may be regulating the senescence of activated LX-2 cells.
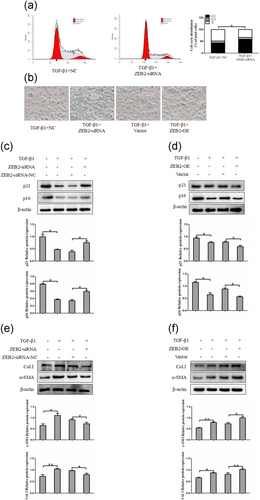
ZEB2 inhibits cellular senescence of HSCs in vitro. (a) Cell cycle analysis showed the effect of ZEB2-siRNA on TGF-β1 (10 ng/ml) treated LX-2 cells by using flow cytometry. (b) Knockdown of ZEB2 increased the number of SA-β-gal-positive cells in activated LX-2 cells. (c) The protein expression of p16 and p21 were measured by western blot analysis in activated LX-2 cells transfected with ZEB2-siRNA. (d) The protein expression of p16 and p21 were assessed by western blot analysis in activated LX-2 cells transfected with ZEB2-OE. (e, f) The expression of α-SMA and Col. I protein was determined by western blot analysis in activated LX-2 cells. The assays were performed at least three times with similar results. Data are shown as the mean ± SD (n = 3) of one representative experiment. ∗p < 0.05 and ∗∗p < 0.01 versus normal groups. α-SMA: α-smooth muscle actin; Col. I: type I collagen; HSCs: hepatic stellate cells; siRNA: small interfering RNA; TGF-β1: transforming growth factor β-1; ZEB2: zinc finger E-box binding homeobox 2; ZEB2-OE: overexpression plasmid of ZEB2 [Color figure can be viewed at wileyonlinelibrary.com]
3.5 ZEB2 attenuates activities of p53 promoter via binding to E-box in LX-2 cells
To further characterize the mechanism by which ZEB2 acted on HSCs senescence. We used luciferase reporter assays to identify the role of ZEB2 in the activities of the p53 promoter. The p53 promoter has an E-box and can be potentially repressed by E-box binding transcriptional repressors like ZEB2. Interestingly, the results showed that an increase of luciferase activity in the p53 promoter was observed upon downregulation of ZEB2 in LX-2 cells compared with the empty vector (Figure 6a). In contrast, ZEB2 overexpression suppressed p53 promoter activity in activated LX-2 cells (Figure 6b). At the same time, the results from qRT-PCR showed that the p53 mRNA level was significantly inhibited in cells transfected with ZEB2 plasmid than in the cells in the negative control group, whereas transfection with ZEB2-siRNA increased the levels of p53 mRNA in cells (Figure 6c). There results were confirmed by using western blot analysis (Figure 6d). Altogether, the results supported that ZEB2 suppresses p53 promoter activity and thus inhibit the expression of p53.
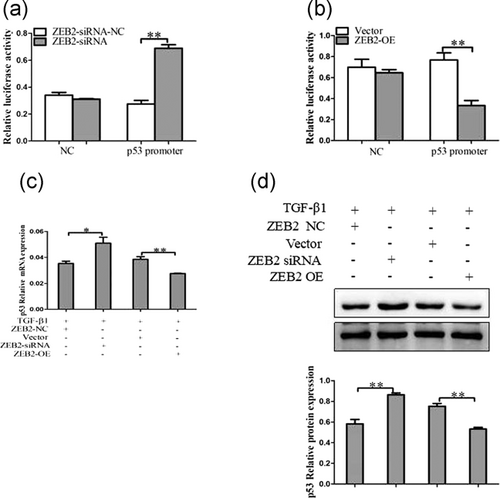
ZEB2 regulated p53 promoter activities. (a) Effect of ZEB2 overexpression on p53 promoters. Luciferase reporter vectors were cotransfected with ZEB2-OE in LX-2 cells. Plasmid HSV-TK was cotransfected to normalize transfection efficiency. (b) Effect of ZEB2 knockdown on p53 promoters. Luciferase reporter vectors were cotransfected with ZEB2-siRNA in LX-2 cells. Plasmid HSV-TK was cotransfected to normalize transfection effciency. (c) Quantitative real-time PCR analysis for mRNA expression of p53 after transfected with ZEB2-siRNA, ZEB2-OE, or corresponding NC. (d) Western blot analysis for protein expression of p53 after transfected with ZEB2-siRNA, ZEB2-OE, or corresponding NC. The assays were performed at least three times with similar results. Data are shown as the mean ± SD (n = 3) of one representative experiment. ∗p < 0.05 and ∗∗p < 0.01 versus normal groups. NC: negative control; siRNA: small interfering RNA; TGF-β1: transforming growth factor β-1; ZEB2: zinc finger E-box binding homeobox 2; ZEB2-OE: overexpression plasmid of ZEB2
3.6 P53 promotes the senescence of activated HSCs in liver fibrosis
3.6.1 The expression of p53 was downregulated in vivo and in vitro
To identify a potential relationship between liver fibrosis and the transcription factor p53, we first examined expression of p53 in CCl4-induced liver fibrosis. Immunofluorescence double staining showed chronic CCl4 intoxication reduced the production of p53 in mouse fibrotic liver (Figure 7a). In addition, results from western blot analysis indicated that the level of p53 was also decreased in liver fibrosis induced by CCl4 (Figure 7c). Apart from these observations, we examined the expression of p53 in activated HSCs. Fluorescence staining showed that p53 was reduced in the nuclear upon TGF-β1 stimulation in HSCs (Figure 7b). In agreement with the observed protein changes, the p53 protein levels were downregulated upon TGF-β1 stimulation in HSCs (Figure 7d). Taken together, the results revealed that p53 was significantly downregulated by HSCs activation, suggesting that transcription factor p53 might play a role in HSCs activation.
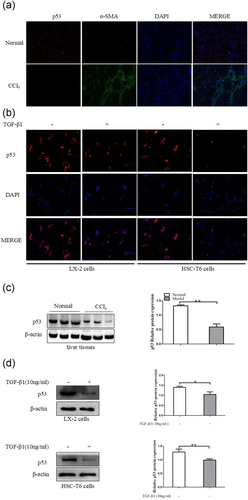
P53 expression in vivo and in vitro. (a) Immunofluorescence staining with p53 and α-SMA were performed to detect the colocalization of p53 (red) and α-SMA (green) in liver fibrosis tissues. Representative images of immunofluorescence staining are presented (×100). (b) Immunofluorescence with p53 (red) in LX-2 cells and HSC-T6 cells after TGF-β1 (10 ng/ml) treatment of 24 hr. (c) The protein expression of p53 was analyzed with western blot in CCl4-treated liver tissues. (d) The protein expression of p53 was analyzed with western blot analysis in LX-2 cells and HSC-T6 cells treated with TGF-β1 (10 ng/ml) for 24 hr. The assays were performed at least three times with similar results. Data are shown as the mean ± SD (n = 3) of one representative experiment. ∗p < 0.05 and ∗∗p < 0.01 versus normal groups. α-SMA: α-smooth muscle actin; DAPI: 4′,6-diamidino-2-phenylindole; HSC: hepatic stellate cells; TGF-β1: transforming growth factor β-1 [Color figure can be viewed at wileyonlinelibrary.com]
3.6.2 P53 promotes activated HSCs senescence in vitro
P53 is the major mediator of cell cycle arrest and senescence in response to a series of cellular damage. Next, we examined whether disruption of p53 could affect the senescence of activated HSCs in vitro. The p53 overexpression and knockdown were introduced into LX-2 cells with p53-siRNA or p53-OE by lipidosome. As expected, flow cytometer indicated that the overexpression of p53 increased the ratio of cells in G1 phase in LX-2 cells compared with the vector (Figure 8a). We further examined the senescence marker SA-β-gal activity. As shown in Figure 8b, treatment with p53-OE significantly increased the number of SA-β-gal-positive cells in LX-2 cells compared with by vector treatment. In contrast, knockdown of p53 did not appear to enhance SA-β-gal activity. To further confirm the above results, LX-2 cells used for western blot analyses of p16 and p21. The results indicated that overexpression of p53 markedly increased the number of senescence marker-positive HSCs. Intriguingly, in contrast to the p53-OE-treated LX-2 cells, silencing of p53 inhibited the expression of p16 and p21 (Figure 8c,d). Finally, we analyzed the effect of p53 on HSCs activation. The results demonstrated that interference of p53 significantly elevated the α-SMA and Col. I in activated LX-2 cells. In contrast, the overexpression of p53 led to inhibition of expression of α-SMA and Col. I (Figure 8e,f). Overall, these results indicated that p53 promotes senescence in activated HSCs and thus potentially slowing down liver fibrosis.
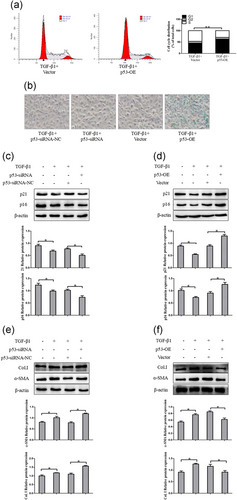
P53 induces G1/S cell cycle arrest and promote cellular senescence of HSCs in vitro. (a) Cell cycle analysis showed the effect of p53-OE on TGF-β1-treated LX-2 cells by using flow cytometry. (b) P53-induced senescence as indicated by SA-β-Gal activities. Representative images of SA-β-Gal staining are presented. (c) The protein expression of p16 and p21 were measured by western blot analysis in activated LX-2 cells transfected with p53-siRNA. (d) The protein expression of p16 and p21 were assessed by western blot analysis in activated LX-2 cells transfected with p53-OE. (e, f) The expression of α-SMA and Col. I protein was determined by western blot analysis in activated LX-2 cells. The assays were performed at least three times with similar results. Data are shown as the mean ± SD (n = 3) of one representative experiment. ∗p < 0.05 and ∗∗p < 0.01 versus normal groups. α-SMA: α-smooth muscle actin; Col. I: type I collagen; TGF-β1: transforming growth factor β-1 [Color figure can be viewed at wileyonlinelibrary.com]
4 DISCUSSION
Therapies using miRNA are a promising means of regulating the pathways involved in liver fibrosis. The major findings of the current study are that miR-145 and p53 were significantly reduced in liver fibrosis tissues and activated HSCs. Our results further showed that overexpression of miR-145 or p53 and silence of ZEB2 can promote HSCs senescence in activated LX-2 cells. In addition, we clearly demonstrate that ZEB2 repressed p53 promoter by binding E-box of promoter and thus expression of p53 is upregulated by miR-145 via targeting of ZEB2. Interestingly, our data suggested that miR-145 regulated the senescence of activated HSCs through the activation of p53 pathway by ZEB2. Therefore, we deduced that the upregulation of miR-145 contributed to the senescence of activated HSCs (Figure 9).
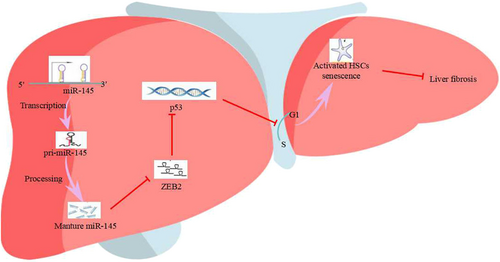
MiR-145 exerts its functions by targeting ZEB2 depended on p53 manner. Schematic representation of the proposed mechanism. Transcription of miR-145 gene increases the expression of mature miR-145 which targets the 3′-UTR of ZEB2 to suppress its translation. Reduced expression of ZEB2 can no longer effectively inhibit p53 transcription factors, thereby accelerating the expression of p53. Ultimately, the increased level of p53 inhibits cell cycle progression and promotes the senescence of activated HSCs, thereby inhibiting liver fibrosis. HSCs: hepatic stellate cells; MiR-145: microRNA-145; ZEB2: zinc finger E-box binding homeobox 2; 3′-UTR: 3′-untranslated region [Color figure can be viewed at wileyonlinelibrary.com]
Liver fibrosis is a precursor to liver cirrhosis, which is considered as a major health problem worldwide. It was historically considered to be a passive and irreversible process due to the collapse of the hepatic parenchyma and its replacement with a collagen-rich tissue (Duan et al., 2014; Troeger et al., 2012). Nevertheless, accumulating evidence has demonstrated that fibrosis, and even cirrhosis, can be potentially reversed (Elsharkawy, Oakley, & Mann, 2005). Activation of resident HSCs to produce the network of ECM remains as the dominant driving force of liver fibrosis (Xu et al., 2005). Therefore, approaches that can limit HSCs activation could contribute significantly to the resolution of liver fibrosis. The phenotype of senescent cells is characterized by a terminal cell cycle arrest (Hayflick, 1965), expression of SA-β-gal and induction of p16 and p21. Previous studies have discovered the existence of senescent-activated HSCs during the development of fibrosis. It is considered that the senescence of activated HSCs is a spontaneous phenomenon and limits the fibrogenic response to acute tissue damage. Senescent-activated HSCs reduced the secretion of ECM components, increased the secretion of ECM-degrading enzymes, and enhanced immunity (Schnabl et al., 2003; Schrader et al., 2009). Therefore, the senescence of activated HSCs induced may be an effective method for liver fibrosis treatment.
MiRNAs are a class of small, noncoding RNAs with 21–23 nt in length, whose seed sequences are partially or completely complementary to target sequences within the 3′-UTR of mRNAs, resulting in protein translation repression or target mRNA destabilization (Bartel, 2004; Valencia-Sanchez, Liu, Hannon, & Parker, 2006). Increasing evidence demonstrate that miRNAs play pivotal role in various physiological and pathological processes, including fibrosis and carcinogenesis (Brown & Naldini, 2009), such as miR-145 (Men et al., 2017). In previous studies, we have studied the mechanism of miR-145 underlying its antifibrotic efficacy in depth. Growing evidence have shown that miR-145 regulates HSC apoptosis and inhibits HSC activation and proliferation (Yang et al., 2017; Zhou et al., 2016). However, there is no direct experiment verifying the regulating effect of miR-145 on senescence of HSCs. In our study, we focus on the role of miR-145 on the cellular senescence in HSCs and the associated cell pathway triggered by miR-145. Our results suggested that miR-145 could regulate the senescence of activated HSCs. On the one hand, our present animal experiments demonstrated that miR-145 was downregulated in CCl4-induced liver fibrosis compared with normal liver tissues. In previous studies, miR-145 was described as a fibrosis promoter and overexpression of miR-145 increased α-SMA expression through inactivation of dedifferentiation mediator Kruppel-like factor-4 (KLF4), while other studies reported that miR-145 could specially attenuated expression of matrix genes and be used to alleviate fibrosis. To further elucidate the potential function of miR-145 in the progression of hepatic fibrosis, we activated HSC-T6 cells and LX-2 cells with TGF-β1 in vitro. The data showed that miR-145 was significantly downregulated after TGF-β1 stimulation both in HSC-T6 cells and LX-2 cells. On the other hand, SA-β-gal staining provided the evidence that senescent HSCs could be detected in HSCs tansfected with miR-145 mimics in vitro. Although p16 and p21 serve as the regulators of cell cycle, increasing evidence has demonstrated that p16 and p21 are upregulated in senescent cells. Herein, we used them as the markers of cellular senescence. In this report, overexpression of miR-145 increased the gene expression of senescence markers p16 and p21 in activated HSCs. However, the protein level of α-SMA and Col. I was significantly decreased by the miR-145 overexpression. These discoveries supported the possibility that induction of HSC senescence could treat liver fibrosis. Cell cycle arrest is the critical feature of cellular senescence. We herein found that miR-145 blocked cell cycle arrest at the G0/G1 checkpoint. Therefore, our results strengthened the observation of induction of HSC senescence by upregulation of miR-145, which could be a strategy for cell-fate regulation in HSCs.
ZEB2, which belongs to the zinc finger E-box binding homeobox transcription factor family, function as an inducer of epithelial-to-mesenchymal transition in many types of liver diseases (Goossens et al., 2015; Verschueren et al., 1999). High expression of ZEB2 is associated with radiation-induced pulmonary fibrosis and drug-induced lung fibrosis, suggesting ZEB2 may be a regulator in fibrosis diseases (Balli et al., 2013; Song et al., 2013). Recently, Cunnington et al. (2014) showed that ZEB2 could regulate fibroblast-to-myofibroblast differentiation in cardiac fibrosis. However, the role of ZEB2 in liver fibrosis is still obscure. In our current study, we found that ZEB2 was significantly increased in mice fibrotic liver tissues as well as TGF-β1-treated HSC-T6 cells and LX-2 cells. Interestingly, this study observed that knocking down ZEB2 significantly promoted HSCs senescence. More important, flow cytometry demonstrated that silence of ZEB2 blocked cell cycle arrest at the G0/G1 checkpoint. In addition, target screening and previous luciferase assays have linked the miR-145 and ZEB2. Our results demonstrated that miR-145 could directly target ZEB2 mRNA through binding to the 3′-UTR regions of ZEB2, and thus mRNA and protein expression of ZEB2 in LX-2 cells were negatively regulated by alteration of miR-145. It suggests that miR-145 plays an essential role in liver fibrosis partly through directly targeting ZEB2. The underlying mechanism through which miR-145 and ZEB2 regulate senescence of HSCs was examined in the subsequent experiment.
Accumulated evidence indicated that cellular senescence of activated HSCs limits liver fibrosis (Chen et al., 2016; Krizhanovsky et al., 2008). More important, emerging evidence shows that p53 is a key mediator of cell cycle arrest in response to cellular stress and thus promote cellular senescence (Pant et al., 2013; Vousden & Lu, 2002). In many cell types, p53 has been found to regulate the cell cycle arrest and cellular senescence (Li et al., 2012; Vigneron & Vousden, 2010). For example, inhibition of the senescence pathway by deleting p53 results in fewer senescent HSC, a greater number of HSC, increased liver fibrosis, and slower resolution of fibrosis (Chen et al., 2016). In the current study, we found that the expression of p53 was significantly downregulated in liver fibrosis tissues and HSC cell lines. We next confirmed that p53 overexpression could promote senescence of activated HSCs in vitro. We demonstrated that enhanced levels of p53 lead to induction of cell cycle arrest at the G1 phase. Overexpression of p53 could enhance SA-β-gal activity. More important, upregulation of p53 can increase the protein of p16 and p21 and decrease the protein of α-SMA and Col. I. Whereas, opposite results were obtained by transfecting with p53-siRNA. Therefore, the finding that the activation of p53 critically led to the cell growth arrest and senescence of activated HSCs.
Taken together, our findings shed light on the function of miR-145 as a fibrosis-suppressive miRNA in liver fibrosis, revealing that this suppression is mediated, at least partly, through the induction of p53 expression via ZEB2 repression. Moreover, we found that miR-145 is a direct transcriptional target of ZEB2, and ZEB2 can suppress the expression of p53 by binding E-box of p53 promoter. Therefore, our study revealed indicating that induction of cellular senescence could be a new strategy for inhibiting fibrogenic properties in activated HSCs by miR-145 and p53. These findings provided novel molecular basis for the development of miR-145 as a promising antifibrotic agent for liver fibrosis.
ACKNOWLEDGMENTS
This study was supported by the Intercollegiate Key Projects of Nature Science of Anhui Province (KJ2014A124 and KJ2017A169), the Anhui Natural Science Foundation (1608085MH234) and Key Research Foundation of Higher Education of Anhui Province (gxfx2017011).
CONFLICTS OF INTEREST
The authors declare that there are no conflicts of interest.


