SP1, MYC, CTNNB1, CREB1, JUN genes as potential therapy targets for neuropathic pain of brain
Abstract
Neuropathic pain (NP) may cause serious brain diseases, but the genes associated with the metabolic pathway and transcript factors of NP remain unclear. This study is aimed to identify the therapy target genes for NP and to investigate the metabolic pathways and transcript factors associated with NP. The differentially expressed genes of three brain tissues (nucleus accumbens, periaqueductal gray, and prefrontal cortex) dealt with NP stimulation were analyzed. Besides, The Database for Annotation, Visualization, and Integrated Discovery and Tfacts datasets were used in the analysis of the genes related to the metabolic pathway and transcript factors of the brain. Eight genes were found to coexpress in all three tissues. A functional enrichment analysis showed that the upregulated genes were mostly enriched in pathways as inflammatory response, calcium-mediated signaling, cytokine-cytokine receptor interaction, and extracellular matrix (ECM)-receptor interaction, whereas the downregulated genes were mostly enriched in pathways as phospholipid metabolic processes, positive regulation of protein kinase B signaling, and metabolism of xenobiotics by cytochrome P450. Finally, 135 and 98 transcript factors genes were upregulated and downregulated, among which SP1, MYC, CTNNB1, CREB1, JUN were identified as the most critical genes because the number of up- and downregulated gene ranked at the top. In conclusion, the pathways of immune response and cytokine-cytokine receptor interaction were determined as the main metabolic pathways of NP affecting the brain, and SP1, MYC, CTNNB1, CREB1, JUN genes were recognized as the most enriched genes in this process, which may provide evidence for the diagnosis and treatment research of neuropathic pain.
1 INTRODUCTION
Neuropathic pain (NP) is a kind of spontaneous pain without external stimuli, which usually occurs after nerve injury. Approximately 10% people suffer from this disease, causing a great economic burden on the society (Jones, Lawson, & Backonja, 2016). It has been recognized that neuroimmune disorder, immunosuppression, as well as blockade of the reciprocal signaling pathways, often accompanied with the occurrence of NP, provide an insight into and a new opportunity for the clinical management of NP (Scholz & Woolf, 2007).
NP is a syndrome caused by a range of different diseases. Multiple symptoms and signs can occur, and patients usually lack response, which makes the research on the mechanisms underlying quite difficult and urgent (Benarroch, 2016). Besides, there has not been much research on the metabolic pathways and the corresponding transcript factors affecting the brain with NP (Masuda, Tsuda, & Inoue, 2016). Therefore, it is urgent to put emphasis on this study to develop new prognostic tools and treatment that may be beneficial for the clinical management of NP. Signaling pathways in the cell can provide quite important information about cell growth or development. Therefore, the research focusing on the pathway changes by comparing normal tissues and tissues treated with NP may provide insights into figuring out the new prognostic or predictive markers for patients with NP. In this study, we aim to identify the differentially expressed genes (DEGs) of NP via the expression data affecting the brain, and then take a deep look into the corresponding metabolic pathways and transcription factor by the Gene Ontology (GO) and Kyoto Encyclopedia of Genes and Genomes (KEGG) functional enrichment analysis, in the hope to provide new evidence for the improvement of prognostic and therapeutic tools in clinical management of NP.
RNA-Seq data, which is now widely used as a powerful and reliable research tool, can provide a better understanding of a vast range of organisms. Besides, unlike the traditional microarray analysis, it has the advantage to identify both known and novel transcripts as well as assembling a transcriptome de novo (Mortazavi, Williams, McCue, Schaeffer, & Wold, 2008; Trapnell et al., 2010). In this study, RNA-Seq data with the accession number of GSE91396 from Gene Expression Omnibus (GEO) data set was therefore used in the DEGs analysis between samples in the control group and treated samples in different parts of the brain by NP stimulus. Furthermore, functional enrichment analysis was then performed on these identified DEGs. Functional enrichment analysis is recognized as a powerful and traditional method to reveal the metabolic pathways and biological processes that the DEGs were involved in. By the corresponding analysis, we aimed to find the potential biomarkers that can function as prognostic and predictive markers for patients with NP in clinical management.
2 MATERIAL AND METHODS
2.1 DEGs identification and principal component analysis of brain tissues with NP
RNA-Seq data was downloaded from the GEO data set (https://www.ncbi.nlm.nih.gov/geo/) on NCBI with the keyword “Neuropathic Pain” and “Brain.” The expression data of genes associated with data set samples were extracted out. The expression data of genes in the different location of the brain was identified with the NP with the threshold of 1.5 fold change. The distribution of up- and downregulated genes in different tissues of the brain was analyzed, and the coexpression genes in these tissues were extracted out. Furthermore, Princomp function in R language was used to perform the principal component analysis (PCA) based on the expression situation of these coexpression genes.
2.2 Functional enrichment analysis of DEGs of brain samples after NP stimulation
The information of DEGs in every brain tissue dealt with NP stimulation was mapped to the DAVID (The Database for Annotation, Visualization, and Integrated Discovery) data set (https://david.ncifcrf.gov/summary.jsp; Dennis et al., 2003). GO (Ashburner et al., 2000) was used to analyze the biological processes, and KEGG (Kanehisa & Goto, 2000; Kanehisa, Goto, Kawashima, Okuno, & Hattori, 2004) was used to analyze the metabolic pathways, which was based on the condition that the p-value after correction was less than 0.05. If the number of records was more than five, the top five would be selected for the analysis. String software (https://string-db.org/; Jensen et al., 2008) was then used to perform the PPI network analysis on the genes in the identified important metabolic pathways.
2.3 Transcript factors analysis of DEGs of brain samples after NP stimulation
The information of DEGs in each brain tissue was mapped to Tfacts data set (Essaghir et al., 2010) (http://www.tfacts.org/). The transcript factor genes that affected the DEGs were analyzed. The distribution of transcript factors in different tissues was analyzed. Besides, the number of genes that each transcription factor gene regulated was calculated to determine the most critical transcript factor gene.
3 RESULTS
3.1 Identification of DEGs and PCA of brain tissues dealt with NP stimulation
An available RNA-seq data set (GSE91396) (Descalzi et al., 2017) in NCBI was selected in this study to analyze the association between NP and brain disease, as well as the effect of NP on the metabolic pathway of brain genes. The DEGs of three parts of the brain (nucleus accumbens [NAc] , periaqueductal gray [PAG], and prefrontal cortex [PFC]) dealt with NP stimulation were identified. Furthermore, the main metabolic pathways and transcript factors were identified based on the analysis of the result of functional enrichment analysis and transcript factors of these DEGs. The specific analysis protocol flow is shown in Figure 1.
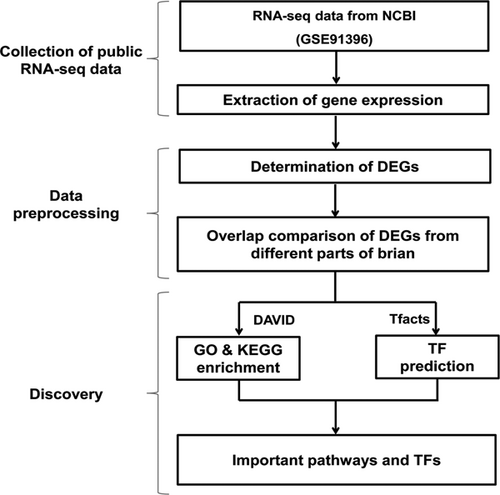
Flow chart of the analysis process gene expression data of GSE91936 data set was extracted to analyze the differentially expressed genes (DEGs) in three parts of the brain dealt with neuropathic pain stimulation. DAVID data set and Tfacts data set were used further to analyze the enrichment result of these DEGs and the transcript factors regulating these DEGs. DAVID: The Database for Annotation, Visualization, and Integrated Discovery; GO: Gene Ontology; KEGG: Kyoto Encyclopedia of Genes and Genomes
The RNA-Seq data set GSE91396 (https://www.ncbi.nlm.nih.gov/geo/query/acc.cgi?acc=GSE91396; Descalzi et al., 2017) was determined after the exploration using the keywords “Neuropathic Pain” and “Brain.” A total of 36 samples were included in the data set. RNA-seq samples were generated from three brain regions (NAc, medial PFC, and PAG) of adult male mice, 2.5 months after sham or spared nerve injury to the sciatic nerve. The platform of sequencing was GPL13112 (IlluminaHiSeq. 2000; Mus musculus).
The fold change of expression value equal to 1.5 was determined as the threshold of the determination of DEGs. A total of 1,341 genes were found to be upregulated in brain tissue and seven genes, Plin4, Lrg1, Mslnl, Ch25h, Bcl3, Capn11, and n-R5s197, were found to be all upregulated in three parts of the brain (Figure 2a). Meanwhile, a total of 1,006 genes were found to be downregulated in the brain tissue, and among these, one gene, Gm26583, was found to be downregulated in all three parts of the brain (Figure 2b). The PCA of the above eight coexpression genes showed that they could clearly separate the samples treated with NP from those untreated (Figure 2c). The distribution rate of the first principal component was 47.0%, whereas that of the second principal component was 20.1%, which meant that the cumulative rate was 67.1%.
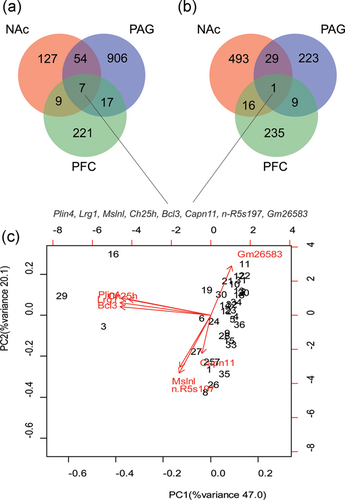
Identification of differentially expressed genes (DEGs) and principal component analysis (PCA) of the brain dealt with neuropathic pain stimulation. (a) The number of upregulated genes of the brain dealt with neuropathic pain stimulation. (b) The number of downregulated genes of the brain dealt with neuropathic pain stimulation. (c) The PCA analysis of the coexpression DEGs in all three parts of the brain dealt with neuropathic pain stimulation. Note: The three parts of the brain: NAc: nucleus accumbens; PAG: periaqueductal gray; PFC: prefrontal cortex [Color figure can be viewed at wileyonlinelibrary.com]
3.2 Functional enrichment analysis of the DEGs
GO ontology enrichment analysis was performed on these DEGs of the brain dealt with NP stimulation (Figure 3 and Table 1). There was an obvious difference in the biological effect of NP on different parts of the brain (Figure 3). The upregulated genes were mainly enriched in pathways as GO:0006954–inflammatory response and GO:0019722–calcium-mediated signaling, whereas the downregulated genes were mainly enriched in pathways as GO:0030199–collagen fibril organization, GO:0002376–immune system process, and GO:0006955–immune response. In PAG tissue, the upregulated genes were mainly enriched in GO:0030154–cell differentiation and GO:0038083–peptidyl-tyrosine autophosphorylate biological processes dealt with NP stimulation, whereas the downregulated genes were mainly enriched in pathways as GO:0032496–response to lipopolysaccharide, the GO:0006644–phospholipid metabolic process, and GO:0006644–phospholipid metabolic process.
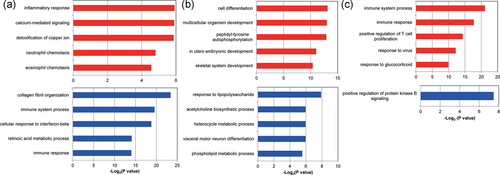
GO enrichment analysis of the DEGs of the brain dealt with neuropathic pain stimulation. (a) The GO enrichment analysis of DEGs of NAc part in the brain dealt with neuropathic pain stimulation. (b) The GO enrichment analysis of DEGs of PAG part in the brain dealt with neuropathic pain stimulation. (c) The GO enrichment analysis of DEGs of PFC part in the brain dealt with neuropathic pain stimulation. The red color represents the GO enrichment situation of the upregulated genes whereas the blue color represented that of the downregulated genes. DEGs: differentially expressed genes; GO: Gene Ontology; NAc: nucleus accumbens; PAG: periaqueductal gray; PFC: prefrontal cortex [Color figure can be viewed at wileyonlinelibrary.com]
| Part | Category | Term | Count | Percentage (%) | p-value |
|---|---|---|---|---|---|
| Upregulated | |||||
| NAc | GOTERM_BP_DIRECT | GO:0006954–inflammatory response | 6 | 5.217391 | 0.016494 |
| GOTERM_BP_DIRECT | GO:0019722–calcium-mediated signaling | 3 | 2.608696 | 0.016819 | |
| GOTERM_BP_DIRECT | GO:0010273–detoxification of copper ion | 2 | 1.73913 | 0.017145 | |
| GOTERM_BP_DIRECT | GO:0030593–neutrophil chemotaxis | 3 | 2.608696 | 0.03578 | |
| GOTERM_BP_DIRECT | GO:0048245–eosinophil chemotaxis | 2 | 1.73913 | 0.042319 | |
| PAG | GOTERM_BP_DIRECT | GO:0030154–cell differentiation | 52 | 6.227545 | 1.11E−04 |
| GOTERM_BP_DIRECT | GO:0007275–multicellular organism development | 64 | 7.664671 | 1.22E−04 | |
| GOTERM_BP_DIRECT | GO:0038083–peptidyl-tyrosine autophosphorylation | 9 | 1.077844 | 1.30E−04 | |
| GOTERM_BP_DIRECT | GO:0001701–in utero embryonic development | 25 | 2.994012 | 4.74E−04 | |
| GOTERM_BP_DIRECT | GO:0001501–skeletal system development | 13 | 1.556886 | 7.43E−04 | |
| PFC | GOTERM_BP_DIRECT | GO:0002376–immune system process | 18 | 8.071749 | 4.38E−07 |
| GOTERM_BP_DIRECT | GO:0006955–immune response | 14 | 6.278027 | 4.70E−06 | |
| GOTERM_BP_DIRECT | GO:0042102–positive regulation of T cell proliferation | 7 | 3.139013 | 4.85E−05 | |
| GOTERM_BP_DIRECT | GO:0009615–response to virus | 7 | 3.139013 | 2.22E−04 | |
| GOTERM_BP_DIRECT | GO:0051384–response to glucocorticoid | 6 | 2.690583 | 0.001027 | |
| Downregulated | |||||
| NAc | GOTERM_BP_DIRECT | GO:0030199–collagen fibril organization | 9 | 2.486188 | 8.92E−08 |
| GOTERM_BP_DIRECT | GO:0002376–immune system process | 21 | 5.801105 | 1.28E−06 | |
| GOTERM_BP_DIRECT | GO:0035458–cellular response to interferon-beta | 8 | 2.209945 | 2.18E−06 | |
| GOTERM_BP_DIRECT | GO:0042573–retinoic acid metabolic process | 5 | 1.381215 | 5.75E−05 | |
| GOTERM_BP_DIRECT | GO:0006955–immune response | 15 | 4.143646 | 6.02E−05 | |
| PAG | GOTERM_BP_DIRECT | GO:0032496–response to lipopolysaccharide | 6 | 4.195804 | 0.004185 |
| GOTERM_BP_DIRECT | GO:0021524–visceral motor neuron differentiation | 2 | 1.398601 | 0.016008 | |
| GOTERM_BP_DIRECT | GO:0046483–heterocycle metabolic process | 2 | 1.398601 | 0.016008 | |
| GOTERM_BP_DIRECT | GO:0008292–acetylcholine biosynthetic process | 2 | 1.398601 | 0.016008 | |
| GOTERM_BP_DIRECT | GO:0006644–phospholipid metabolic process | 3 | 2.097902 | 0.021335 | |
| PFC | GOTERM_BP_DIRECT | GO:0051897–positive regulation of protein kinase B signaling | 3 | 4.615385 | 5.60E−03 |
- Note. DEGs: differentially expressed genes; GO: Gene Ontology; NAc: nucleus accumbens; PAG: periaqueductal gray; PFC: prefrontal cortex.
In PFC tissue, the upregulated genes were mainly enriched in the GO:0002376–immune system process, the GO:0006955–immune response, the GO:0009615–response to the virus, and the GO:0051384–response to glucocorticoid dealt with NP stimulation, whereas the downregulated genes were just mainly enriched in the GO:0051897–positive regulation of protein kinase B signaling.
KEGG enrichment analysis was further performed on these DEGs (Figure 4 and Table 2). There was an obvious difference in the effect of NP on different parts of the brain. In Nac part, the upregulated genes dealt with NP stimulation were mainly enriched in pathways as mmu04060: Cytokine-cytokine receptor interaction whereas the downregulated genes were mainly enriched in pathways as mmu04514: Cell adhesion molecules (CAMs), mmu04145: Phagosome and mmu00980: Metabolism of xenobiotics by cytochrome P450.

KEGG enrichment analyses of the DEGs of the brain dealt with neuropathic pain stimulation. (a) The KEGG enrichment analysis of DEGs of NAc part in the brain dealt with neuropathic pain stimulation. (b) The KEGG enrichment analysis of DEGs of PAG part in the brain dealt with neuropathic pain stimulation. (c) The KEGG enrichment analysis of DEGs of PFC part in the brain dealt with neuropathic pain stimulation. The red color represents the KEGG enrichment situation of the upregulated genes whereas the blue color represents that of the downregulated genes. DEGs: differentially expressed genes; KEGG: Kyoto Encyclopedia of Genes and Genomes NAc: nucleus accumbens; PAG: periaqueductal gray; PFC: prefrontal cortex [Color figure can be viewed at wileyonlinelibrary.com]
| Part | Category | Term | Count | Percentage (%) | p-value |
|---|---|---|---|---|---|
| Upregulated | |||||
| NAc | KEGG_PATHWAY | mmu04060: Cytokine-cytokine receptor interaction | 6 | 5.217391 | 0.001669 |
| KEGG_PATHWAY | mmu05323: Rheumatoid arthritis | 3 | 2.608696 | 0.035244 | |
| PAG | KEGG_PATHWAY | mmu04974: Protein digestion and absorption | 11 | 1.317365 | 0.001311 |
| KEGG_PATHWAY | mmu04512: ECM-receptor interaction | 11 | 1.317365 | 0.001311 | |
| KEGG_PATHWAY | mmu04151: PI3K-Akt signaling pathway | 24 | 2.874251 | 0.004593 | |
| KEGG_PATHWAY | mmu04611: Platelet activation | 12 | 1.437126 | 0.008277 | |
| KEGG_PATHWAY | mmu04330: Notch signaling pathway | 7 | 0.838323 | 0.008411 | |
| PFC | KEGG_PATHWAY | mmu04060: Cytokine-cytokine receptor interaction | 11 | 4.932735 | 1.63E−04 |
| KEGG_PATHWAY | mmu04080: Neuroactive ligand-receptor interaction | 11 | 4.932735 | 5.47E−04 | |
| KEGG_PATHWAY | mmu04668: TNF signaling pathway | 6 | 2.690583 | 0.004771 | |
| KEGG_PATHWAY | mmu04062: Chemokine signaling pathway | 7 | 3.139013 | 0.014024 | |
| KEGG_PATHWAY | mmu05020: Prion diseases | 3 | 1.345291 | 0.041115 | |
| Downregulated | |||||
| Nac | KEGG_PATHWAY | mmu04514: Cell adhesion molecules (CAMs) | 12 | 3.314917 | 2.91E−05 |
| KEGG_PATHWAY | mmu04145: Phagosome | 11 | 3.038674 | 2.71E−04 | |
| KEGG_PATHWAY | mmu00980: Metabolism of xenobiotics by cytochrome P450 | 7 | 1.933702 | 3.73E−04 | |
| KEGG_PATHWAY | mmu05320: Autoimmune thyroid disease | 7 | 1.933702 | 6.54E−04 | |
| KEGG_PATHWAY | mmu05144: Malaria | 6 | 1.657459 | 7.18E−04 | |
| PAG | KEGG_PATHWAY | mmu00591: Linoleic acid metabolism | 4 | 2.797203 | 0.003393 |
| KEGG_PATHWAY | mmu00590: Arachidonic acid metabolism | 4 | 2.797203 | 0.016668 | |
- Note. DEGs: differentially expressed genes; ECM: extracellular matrix; KEGG: Kyoto Encyclopedia of Genes and Genomes; NAc: nucleus accumbens; PAG: periaqueductal gray; PFC: prefrontal cortex; TNF: tumor necrosis factor.
In the PAG part, the upregulated genes dealt with NP stimulation were mainly enriched in pathways as mmu04974: Protein digestion and absorption, mmu04512: extracellular matrix (ECM)-receptor interaction, and mmu04151: PI3K-Akt signaling pathway, whereas the downregulated genes were mainly enriched in pathways as mmu00591: Linoleic acid metabolism and mmu00590: Arachidonic acid metabolism.
In the PFC part, the upregulated genes dealt with NP stimulation were mainly enriched in pathways as mmu04060: Cytokine-cytokine receptor interaction, mmu04080: Neuroactive ligand-receptor interaction, mmu04668: tumor necrosis factor (TNF) signaling pathway and mmu04062: Chemokine signaling pathway whereas the downregulated genes were not found to be enriched in any metabolic pathways (Figure 5).
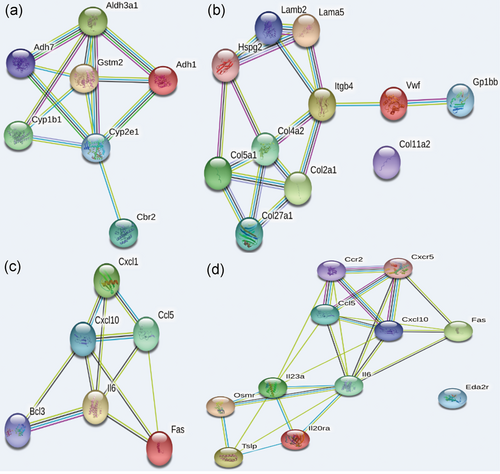
The protein-protein interaction network analysis of the neuropathic pain-related genes that affected the metabolic pathways of the brain (a) NAc, mmu04514: Cell adhesion molecules (CAMs), (b) PAG, mmu00980: Metabolism of xenobiotics by cytochrome P450, (c) PFC, mmu04668: TNF signaling pathway, (d) PFC, mmu04060: Cytokine-cytokine receptor interaction. NAc: nucleus accumbens; PAG: periaqueductal gray; PFC: prefrontal cortex; TNF: tumor necrosis factor [Color figure can be viewed at wileyonlinelibrary.com]
The result of the protein-protein interaction network (PPI) analysis showed that there were strong interactions among these DEGs enriched in the above pathways, indicating their potential impact on the molecular mechanism of the brain dealt with NP stimulation. (Figure 5)
3.3 Transcript factors analysis
The transcript factors of the DEGs of the brain dealt with NP stimulation were analyzed (Figure 6). There were 135 transcript factors for the upregulated genes, among which 27 transcript factor genes were found to play regulatory roles in all three parts of the brain (Figure 6a). For the downregulated genes, there were 98 transcript factors and among which one gene, SMAD4, was found to play regulatory roles in all three parts of the brain (Figure 6b).
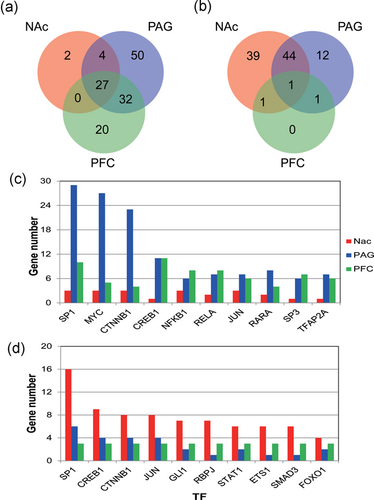
The transcript factor genes that affected the gene expression in different parts of the brain after the treatment of the neuropathic pain. (a) The number of transcript factor genes that regulated the upregulated genes of the brain dealt with neuropathic pain stimulation. (b) The number of transcript factor genes that regulated the downregulated genes of the brain dealt with neuropathic pain stimulation, (c) The number of transcript factor genes that regulated the upregulated genes. (d) The number of transcript factor genes that regulated the downregulated genes. NAc: nucleus accumbens; PAG: periaqueductal gray; PFC: prefrontal cortex [Color figure can be viewed at wileyonlinelibrary.com]
The number of the genes that were regulated by corresponding transcript factors was further analyzed. Among the upregulated genes of the brain dealt with NP stimulation, SP1, MYC, CTNNB1, CREB1, and NFKB1 were found to have a stronger effect and the number of the genes they regulated was larger (Figure 6c), whereas SP1, CREB1, CTNNB1, JUN, and GLI1 genes were found to regulate a larger number of genes among the downregulated genes (Figure 6d). Therefore, it can be concluded that SP1, MYC, CTNNB1, CREB1, and JUN were the most important transcript factors in the regulation of brain genes dealt with NP stimulation.
4 DISCUSSION
In this study, we identified the most DEGs from three parts of the brain dealt with NP stimulation using RNA-seq data from the GSE91396 data set. The DAVID data set and GO and KEGG enrichment analysis revealed the main metabolic pathways in the NP that affected the occurrence of brain disease and the corresponding transcript factors that were involved. More important, the rationality of these pathways was verified by further coexpression analysis in three parts of the brain, NAc, PAG, and PFC. The functional enrichment analysis showed that these DEGs were mainly enriched in pathways as GO:0006954–inflammatory response, GO:0019722–calcium-mediated signaling, GO:0030199–collagen fibril organization, GO:0002376–immune system process, GO:0006955–immune response, GO:0032496–response to lipopolysaccharide, GO:0006644–phospholipid metabolic process, GO:0009615–response to virus, GO:0051384–response to glucocorticoid, GO:0051897–positive regulation of protein kinase B signaling, and so forth. The KEGG enrichment analysis showed that the DEGs were mainly enriched in pathways as mmu04060: Cytokine-cytokine receptor interaction, mmu04514: CAMs, mmu04145: Phagosome, mmu00980: Metabolism of xenobiotics by cytochrome P450, mmu04512: ECM-receptor interaction, mmu04151: PI3K-Akt signaling pathway, mmu04080: Neuroactive ligand-receptor interaction, mmu04668: TNF signaling pathway, mmu04062: Chemokine signaling pathway, and so forth.
Early studies showed that the SCN9A gene plays an important role in human genetic pain disorders by encoding Nav1.7 production, an important substance in affecting pain sensation in humans (Drenth & Waxman, 2007). It was also reported that Nav1.7 protein expression was upregulated in the neuron that projects their axons to the inflamed area, suggesting that Nav1.7 were related to the pain associated with the inflammation. In our study, we found that the immune response and receptor action were the main metabolic pathways affecting the brain dealt with NP stimulation. Therefore, earlier studies of the association between inflammation somewhat, at least in part, confirmed our result because the immune response was usually activated and accompanied by inflammation (Black, Liu, Tanaka, Cummins, & Waxman, 2004). But other relating studies were quite rare, which made the studies quite necessary and meaningful.
More important, in this study, SP1, MYC, CTNNB1, CREB1, and JUN genes were found to regulate a large number of genes among the DEGs of brain tissue dealt with NP stimulation, and they were recognized as the most important transcript factor genes.
It was reported that protein encoding by SP1 gene was involved in many biological processes, among which immune response process was included (Kadonaga, Carner, Masiarz, & Tjian, 1987). The association of this gene with NP can somehow support by the result of the functional enrichment analysis on these DEGs, which found that the immune response was the most significantly enriched pathway in brain tissues dealt with NP stimulation. The MYC gene is a widely known transcription factor, which can activate the expression of many genes. Besides, it was found upregulated in many types of cancer (Bouillez et al., 2016). But its association with NP was not figured out. In this study, immune reaction was found to be the mostly enriched pathway and the Myc genes regulated most of the upregulated genes, which was recognized as the transcript factor with a strong effect. Because the major effect of Myc is the proliferation of B cell, an important functional cell in immune reactions, we had reason to believe that the result was quite reliable. The CTNNB1 was reported to be involved in the regulation of cell adhesion, and we assumed that it may be in associated with the most enriched pathway, receptor action, which affected the brain most dealt with NP stimulation.
CREB1 gene can stimulate the transcription by binding to the cyclic adenosine monophosphate (cAMP) response element (Bartsch, Casadio, Karl, Serodio, & Kandel, 1998). The cAMP was recognized as the second messenger, which is often used for intracellular signal transduction and plays an important role in many biological processes in many different organisms. Therefore, the CREB1 may be in response to exposure to extracellular signaling molecules, which also supported the rationality of the most significantly enriched receptor reaction pathway. The JUN gene expression was related to the stimulation of the cAMP signaling pathway, and we assumed that the mechanism was similar to that of the CREB1 gene.
In conclusion, our results suggested a potential application of SP1, MYC, CTNNB1, CREB1, and JUN genes as the prognostic biomarker in the clinical management of NP, and two most important signaling pathways, immune response and reception reactions, were found to be closely related to the occurrence and development of NP. The more specific mechanism of these genes with the brain tissue dealt with NP stimulation needs further research.


