Integrative proteomics and immunochemistry analysis of the factors in the necrosis and repair in acetaminophen-induced acute liver injury in mice
Abstract
Acetaminophen (APAP) overdose-induced acute liver injury (AILI) is a significant clinical problem worldwide, the hepatotoxicity mechanisms are well elucidated, but the factors involved in the necrosis and repair still remain to be investigated. APAP was injected intraperitoneally in male Institute of Cancer Research (ICR) mice. Quantitative proteome analysis of liver tissues was performed by 2-nitrobenzenesulfenyl tagging, two-dimensional-nano high-performance liquid chromatography separation, and matrix-assisted laser desorption/ionization–time of flight mass spectrometry analysis. Diffrenetial proteins were verified by the immunochemistry method. 36 and 44 differentially expressed proteins were identified, respectively, at 24 hr after APAP (200 or 300 mg·kg −1) administration. The decrease in the mitochondrial protective proteins Prdx6, Prdx3, and Aldh2 accounted for the accumulation of excessive reactive oxygen species (ROS) and aldehydes, impairing mitochondria structure and function. The Gzmf combined with Bax and Apaf-1 jointly contributed to the necrosis. The blockage of Stat3 activation led to the overexpression of unphosphorylated Stat3 and the overproduction of Bax. The overexpression of unphosphorylated Stat3 represented necrosis; the alternation from Stat3 to p-Stat3 in necrotic regions represented hepatocytes from death to renewal. The high expressions of P4hα1, Ncam, α-SMA, and Cygb were involved in the liver repair, they were not only the markers of activated HSC but also represented an intermediate stage of hepatocytes from damage or necrosis to renewal. Our data provided a comprehensive report on the profile and dynamic changes of the liver proteins in AILI; the involvement of Gzmf and the role of Stat3 in necrosis were revealed; and the role of hepatocyte in liver self-repair was well clarified.
1 INTRODUCTION
The liver is believed to be unique among adult mammalian organs due to its ability of rapid repair or regeneration after tissue injuries, such as intoxication or partial hepatectomy. However, the origins of the new hepatocytes evoke a long-standing debate for less special markers. Some investigations suggested that all residual parenchymal cells had stem cell-like proliferative capabilities (George & Michalopoulos, 2007; Overturf, Al-Dhalimy, Finegold, & Grompe, 1999; Overturf, al-Dhalimy, Ou, Finegold, & Grompe, 1997), other evidence believed that the liver stem cells resting in the biliary ducts could give rise to hepatocytes and biliary epithelial cells in response to liver injury (Fausto, 2004; Shin et al., 2011). However, recent evidence showed that the contributions of hepatic progenitor cells (HPCs) are minimal, in terms of regeneration, in cases of acute injury (Malato et al., 2011). Nonparenchymal cells, such as hepatic stellate cells (HSCs) could transform into new hepatocytes (Kordes, Sawitza, Götze, Herebian, & Häussinger, 2014). Further, hematopoietic stem cells, mesenchymal stem cells (MSCs), and bone marrow cells also had potential to transform into hepatocytes (Lagasse et al., 2000; K. D. Lee et al., 2004; Theise et al., 2000). Kordes et al. (2014) presumed that HPCs seemed to represent an intermediate stage of differentiating HSCs and other MSC populations, in other words, the markers of HSC or HPC might also represent an intermediate stage of hepatocytes from death to renewal, which is proven in this study.
The mode of cell death in mice models in APAP-induced acute liver failure (ALF) is oncotic necrosis, which is similar to humans (Jaeschke, Xie, & McGill, 2014). In mice model, APAP-induced liver injury (AILI) involves oxidative stress, mitochondrial damage, nuclear DNA fragmentation, and c-jun N-terminal kinase (JNK) activation. The persistent oxidant stress leads to superoxide and peroxynitrite formation in mitochondria. Mitochondria permeability transition (MPT) is inducted, and the ATP synthesis is ceased (Bajt, Farhood, Lemasters, & Jaeschke, 2008; Kon, Kim, Jaeschke, & Lemasters, 2004). In the absence of ATP, cytochrome c binding to Apaf triggers its inactive aggregation that prevents apoptosome assembly and leads to necrosis (Shi, Wu, Wang, & Fan, 2009). Deletion of ATP plays a key role in cell necrosis, but ATP level is also important for the liver regeneration (Nakagawa et al., 2012; Taurino et al., 2016; Toshima et al., 2014). The regeneration pathway might also be interrupted due to the lack of ATP, such as the activation of Stat3 (Sun et al., 2013). Previous findings showed the inhibition of Stat3 activation promoted cancer cell apoptosis by increasing the expression of Bax (Ilisso et al., 2016; T. L. Lee et al., 2008). The Bax could not only mediate apoptosis but also initiate necrosis (Whelan et al., 2012). Previous genomic analysis showed that hepatic messenger RNA (mRNA) level of Stat3 was upregulated dramatically (Ruepp, Tonge, Shaw, Wallis, & Pognan, 2002). Here, the high protein level of Stat3 in APAP-induced ALF would be discovered by proteomics analysis; and the relationship of Stat3 upregulation with necrosis would be verified by the IHC method. Activation of Stat3 by IL-6 or IL-22 is believed to play a protective role for liver repair or regeneration; recombinant Stat3-activated cytokines might evolve as novel proregenerative therapeutic option for hard-to-treat patients induced by APAP overdose (H. Li et al., 2015; Mühl, 2016; Scheiermann et al., 2013). But the repair or regeneration mechanisms were much more complicated. The current study made an effort to explore the hidden mechanism behind the pathology on the basis of the proteomic result.
A growing number of studies demonstrated that proteomic methods were extremely valuable to study drug toxicology and to explore potential therapeutic targets by monitoring the changes in protein expressions toward different stimuli like the APAP. It is a protein, not a gene that can represent the metabolical activities of the tissue. So, proteomic investigations can reveal more precise information about drug activity and toxicity (Thome-Kromer et al., 2003). The quantitative proteome analysis using stable isotope labeling combined with MALDI mass spectrometric analysis have dramatically increased the scope and accuracy of mass spectrometry-based proteomics studies (Sandberg, Branca, Lehtiö, & Forshed, 2014). The 2-nitrobenzenesulfenyl (NBS) labeling method has been shown superior for good reproducibility and reliability (Kuyama et al., 2003; Matsuo, Watanabe, Kuyama, & Nishimura, 2009). It is based on the specific binding reaction of tryptophan residues in a protein with the NBS reagent. The NBS-labeled digests were enriched and then subjected to analysis by MALDI-TOF MS. The 6-Da mass difference between [12C]-NBS-labeled and [13C]-NBS-labeled peptides could be identified by MS/MS. The labeled peptides were separated by nanoliquid chromatography first and then spotted on the MALDI target. The combination of nano-LC and MALDI-MS minimized the errors in peptide quantification (Leng et al., 2012). Using a combination of techniques based on NBS labeling of peptides and nano-LC/MALDI-TOF MS in this study, we have rapidly and efficiently identified 36 and 44 differentially expressed proteins. Complementary to the proteomic analysis, more intuitive understanding of the distribution and significance of these proteins were achieved by immunohistochemical (IHC) technique. A combination of proteomics and IHC techniques displayed a complex and exact picture of damage, necrosis, and recovery, which provided new insights into the pathogenesis of AILI.
2 EXPERIMENTAL SECTION
2.1 Materials and reagents
APAP were purchased from Nanjing SenBeijia Biological Technology (Nanjing, Jiangsu, China). Anti-Hsp70 antibody (EPR16892; ab181606), anti-P4hα1 antibody (ab59497), and anti-Ncam antibody (RNL-1) ab9018 were purchased from Abcam (Cambridge, UK). PCNA (FL-261) antibody (sc-7907) and C-kit (sc-168) were purchased from Santa Cruz Biotechnology (Delaware Ave Santa Cruz, CA). The α-SMA antibody (55135-1-AP) and Cygb (13317-1 AP) antibody were purchased from Proteintech Group (Wuhan, Hubei, China). Stat3 antibody (T4443) and phospho-Stat3 (Y705) (P0251) were purchased from ImmunoWay (Plano, TX). Rabbit anti-GFAP polyclonal antibody was purchased from ZSGB-Bio, (Beijing, China).
2.2 Animals
Male ICR mice weighing between 28 and 30 g (8-weeks old) were purchased from Vital River Laboratory Animal Co. Ltd. (Beijing, China). The mice were housed in a clean room at 23 ± 2°C (humidity: 50 ± 5%). They were permitted free access to food and water. All animal experiments were performed according to the National Institutes of Health Guidelines for the Care and Use of Laboratory Animals and were approved by the Animal Care and Use Committee of Nanjing University, China.
2.3 Animal treatment
Mice were randomly assigned according to their weight. They were fasted overnight and then were exposed to APAP (i.p., 200 or 300 mg·kg−1, dissolved in saline). The mice were weighed and killed at different time points after APAP administration. Blood was taken from the abdominal main vein. The serum was separated from the blood samples by centrifugation at 1,000 g for 10 min at 4°C and stored at −80°C until further analysis. The right lobe of the liver was fixed in 10% formalin for morphological analysis; and the remaining liver tissue was divided into small portions and stored at −80°C for further analysis.
2.4 Blood chemistry
Serum alanine aminotransferase (ALT) and aspartate aminotransferase (AST) levels were analyzed using an automatic blood chemistry analyzer (BS-800 automatic biochemistry analyzer, Shenzhen Mindray Bio-Medical Electronics Co., Ltd., Shenzhen, Guangdong, China).
2.5 Cytokine measurements
Cytokine measurements were carried out using the CBA kit (BD Biosciences, NJ) for simultaneous detection of three serum cytokines (IL-6, IFN-γ, IL-10) according to the manufacturer’s instructions. The samples were measured with the CytoFLEX flow cytometer (Beckman Coulter Life Sciences, IN), and the CytExpert software (Beckman Coulter Life Sciences, IN) was used for the data analysis.
2.6 Histopathology
Liver injury was assessed by light microscopy. Fixed liver tissue slices were processed and embedded in the tissue embedding rings (Tissue-Tek® TEC™ 5., Sakura Finetek Japan, Co., Ltd., Tokyo, Japan). Sections of 4 μm in thickness were processed in vacuum infiltration processor (Tissue-Tek® VIP™ 5 Jr., Sakura Finetek Japan, Co., Ltd.). Sections were subjected to hematoxylin and eosin staining by automatic staining machine (Leica ST5020, Leica Biosystems Inc., Nussloch, Germany), and viewed through Pannoramic Viewer1.15.4 (3DHISTECH, Ltd., Budapest, Hungary) for histological examination.
2.7 Preparation of protein samples
The liver samples were subjected to proteomic analysis. First, liver samples were prepared using Ready Prep Protein Extraction kit (Bio-Rad, CA). Extracted protein concentration was determined by BioSpec-nano (Shimadzu Biotech, Kyoto, Japan). Approximately, 4 mg of protein/group was used for quantitative proteomic profiling. The 2-nitrobenzenesulfenyl (NBS) tagging was performed according to the manufacturer’s protocol (13CNBS stable isotope labeling kit-N; Shimadzu Biotech, Kyoto, Japan). In brief, each solution (each containing 400 μg of protein) was labeled with isotopical 12C6NBS or 13C6NBS reagent. NBS-tagged proteins were then mixed, reduced, alkylated, and digested by trypsin. NBS-tagged peptides were enriched and separated by 2D-nano high-performance liquid chromatography (Prominence HPLC, Shimadzu) as described previously (Matsuo et al., 2009). Eluates were automatically deposited onto MALDI target plates by the LC spotting system (AccuSpot; Shimadzu Biotech, Kyoto, Japan). These spotted samples were automatically analyzed by MALDI-TOF/TOF MS (MALDI-7090; Shimadzu Kratos, Manchester, UK).
2.8 Relative quantification and identification of the liver tissue proteome
Relative quantification between 12C6NBS- or 13C6NBS-tagged peptides was performed using the proteome analysis assistant software for relative quantification, TWIP version 1.0 (DYNACOM, Chiba, Japan), referring to a monoisotopic mass list from MASCOT Distiller Version 1.1.2 (Matrix Science, London, UK). Threshold values of 13C6/12C6 ratios in NBS-tagged peptide pairs were set to either larger than 1.25 or less than 0.8. Candidate peptides having a significant difference in peptide pair ratios were selected and further subjected to MS/MS analysis. Proteins were identified by MASCOT MS/MS Ion Search algorithm (Version 2.0; Matrix Science) using mass list generated by the MASCOT Distiller. The Mascot search parameters were as follows: trypsin digestion allowing up to 1 missed cleavages, fixed modifications of 12C6NBS (or 13C6NBS; W) and carbamidomethyl (C), variable modifications of oxidation (M), peptide tolerance of 0.2 Da, and MS/MS tolerance of 0.8 Da. Search results with p values less than 0.05 were judged as positive identifications.
2.9 Construction of AILI-related protein–protein interaction network (PPIN)
AILI-related PPIN and the functional analysis were executed using STRING online and software Cytoscape version 2.8.3 (The Cytoscape Consortium, NY). The construction procedure of PPIN using software Cytoscape was followed. Forty-four differential proteins expressed in AILI were gathered as the primary protein related to AILI. On the basis of the UniProt database (released on March 12, 2015), we searched the proteins interacting with the primary protein as the secondary proteins in IntAct of UniProt. Finally, using Cytoscape’s Merge module, constructed the AILI-related PPIN and displayed it in a graphic format using software Cytoscape version 2.8.3. For each of these proteins, we retrieved the PRO IDs from the UniProt database. The two files were further converted into visualized protein networks with the Cytoscape functions “Import- > Network from table,” where “Source Interaction” and “Target Interaction” correspond to the primary proteins and the secondary proteins. The mean connected degree was given by “Network Analyzer” of Cytoscape.
2.10 Immunohistochemistry
Paraffin-embedded liver sections (4 μm) were used for detection of prolyl 4-hydroxylase α (P4hα1), Neural cell adhesion molecule (Ncam), smooth muscle actin α (α-SMA), cytoglobin (Cygb), glial fibrillary acidic protein (GFAP), Stat3, P-Stat3, heat shock 70 kDa protein (Hsp70), proliferating cell nuclear antigen (PCNA), and C-kit in the liver. In brief, sections were deparaffinized and rehydrated using the automatic staining machine (Leica ST5020). For Ncam, P-Stat3 antigen retrieval was performed by Tris-EDTA (pH 9.0) in microwave plus saponin (10 μg·ml−1); for GFAP, antigen retrieval was performed with saponin (10 μg·ml−1); for others, citric acid buffer (pH 6.0) in high pressure was used. Peroxidase blocking was performed using 3% hydrogen peroxide for 10 min. Sections were incubated with P4hα1 (1:100), Ncam (1:100), α-SMA (1:100), Cygb (1:100), Hsp70 (1:1,000), PCNA (1:100), C-kit (1:100), Stat3 (1:100), and P-Stat3 (1:100) antibodies, respectively, for 12 hr at 4°C. Thereafter, for P4hα1, sections were incubated with UltraSensitive™ SAP (goat) IHC Kit (Fuzhou Maixin Biotech, China); for others, anti-murine/rabbit Universal Immunoperoxidase Polymer kit (Proteintech Group) was used. Sections were counterstained with hematoxylin. Slides were Viewed by Pannoramic Viewer 1.15.4 and analyzed with QuantCenter 2.0 (3DHISTECH Ltd.).
2.11 Statistical analysis
All experimental data obtained from mice were expressed as mean ± SD. Statistical significance was determined by Student’s unpaired two-tailed t test. p < 0.05 was considered statistically significant. IHC quantitative analysis data was obtained by correlation analysis by Origin 8 (OriginLab Corp., MA).
3 RESULTS
3.1 Pathological, blood chemical, and cytokine changes in AILI
The blood biochemical measurements showed that serum ALT and AST levels were elevated from 2 hr after the APAP (300 mg·kg−1) administration, got the peak at 24 hr, and declined at 48 hr (Figure 1b,c). The level of IL-6 in the model group was increased from 2 to 6 hr and returned to normal at 24 hr (Figure 1d). IFN-γ was not changed at three time points (Figure 1e). IL-10 did not change at 2 and 6 hr, but declined at 24 hr (Figure 1f). Histological analysis was performed to display the pathological changes during the APAP-induced hepatotoxicity. Hematoxylin and eosin (HE)-stained hepatic sections from the control group were microscopically normal. The model group taken at different time points displayed the progression of lesions. At 2 hr after APAP challenge, moderate congestion occurred in hepatic sinusoid, a large number of vesicles on behalf of the lipid droplets were found in hepatocytes. The congestion became more serious in hepatic sinusoid and central vein at 6 hr. The red blood cells entered the Disse space by the hepatic sinus cavity, forming a sac filled with red blood cells. At 24 hr, severe hemorrhage and necrosis occurred around the central vein region, the inflammatory cells appeared in the necrosis area, but the portal areas were still normal. At 48 hr, a large number of inflammatory cells accumulated in the original site of necrosis, but the lesions were alleviated (Figure 1a).
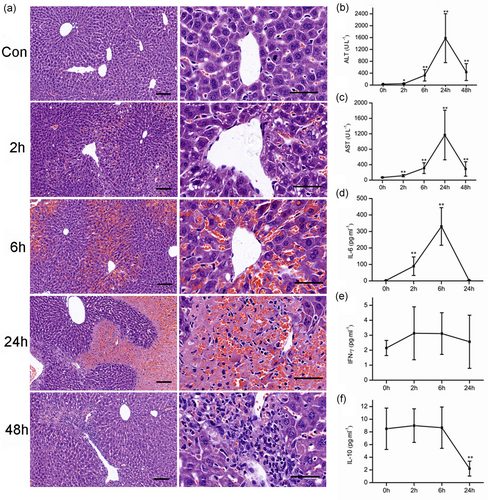
The time course of pathological, blood chemical, and cytokine changes in APAP-induced acute liver failure (300 mg·kg−1). (a) The pathological changes after APAP administration. Representative micrographs depicting HE-stained hepatic sections observed under ×10 (left), ×40 (right) objectives. Scale bar = 50 μm. The serum ALT (b) and AST (c) levels. The changes of serum IL-6 (d), IFN-γ (e), and IL-10 (f) levels after APAP administration. Mice were administered with a single intraperitoneal injection of saline containing APAP (300 mg·kg−1). The mice treated with intraperitoneal injection of saline only were used as control (time 0 hr). Error bars indicate mean ± SD, derived from each assay in six mice. **P < 0.01 compared with the control group [Color figure can be viewed at wileyonlinelibrary.com]
3.2 Comparative proteomic analysis results
APAP overdose is the main reason for the APAP hepatotoxicity, but the damage degree is quite different depending on the dose of APAP. At 24 hr after the APAP administration, the higher dose (300 mg·kg−1) led to ALF, and the necrosis occurred with the nuclear fragmentation and plasma-red staining (Figure 2b); the lower dose (200 mg·kg−1) only induced mild damage, when the hepatocytes were swelling, the nucleus kept integrity, and the cytoplasm was not dyed red (Figure 2a). The blood chemistries in the lower dose were much lower than in higher dose (Figure 2c). To get the exact information, we selected typical liver tissues from the two dose-administered groups for proteomic analysis according to their HE staining results: six necrotic liver tissues and six mild damaged tissues. The overall pattern change of proteins were similar for 200 and 300 mg·kg−1 groups. The differences were in the extent of changes, with more significant changes seen at a higher dose. After administration with APAP, the proteomic analysis highlighted 44 differentially expressed proteins, including 32 upregulated ones and 12 downregulated ones between 300 mg·kg−1 group and the control group; 36 differentially expressed proteins, including 24 upregulated ones; and 12 downregulated ones between 200 mg·kg−1 group and the control group (Table 1). The current interaction network built from the differential proteins between 300 mg·kg−1 group and the control group based on STRING was shown in Figure 3. The analysis of this generated network showed 19 proteins, functionally enriched, in the pathway of response to a chemical (ID Go: 0042221). Among them, the downregulated proteins contained several antioxidant activity proteins and detoxifying enzymes like thioredoxin-dependent peroxide reductase (Ppdx3), aldehyde dehydrogenase (Aldh2), glutathione-S-transferase P1 (Gstp1), glutathione peroxidase 2 (Gpx2), and peroxiredoxin-6 (Ppdx6), which played essential roles in cell defense of oxidative stress. The decreased expressions of these proteins were consistent with previous reports (Bruderer et al., 2015; Hagiya et al., 2015; Y. P. Lee et al., 2013; Ruepp et al., 2002; Table 2).

The different degree of damage according to the dose of the drug at 24 hr after APAP administration. (a) Mild damage was shown in the liver sections of the lower dose group (200 mg·kg−1) with the mild swelling of hepatocytes. (b) Patchy necrosis was shown in the liver sections of high dose group (300 mg·kg−1). (c) The ALT and AST levels in different degree damaged mice. C: Control mice, D: mild liver damaged mice, N: necrosis livers mice. Error bars indicate mean ± SD derived from each assay in six mice. **p < 0.01 compared with control group. Scale bar = 50 μm [Color figure can be viewed at wileyonlinelibrary.com]
| Fold-change | ||||
|---|---|---|---|---|
| UniProt ID | Gene name | Protein description | N/C | D/C |
| P4HA1_MOUSE | P4hα1 | Prolyl 4-hydroxylase α | 19.58 | 1.76 |
| NCAM1_MOUSE | Ncam1 | Neural cell adhesion molecule1 | 14.26 | 1.71 |
| STAT3_MOUSE | Stat3 | Signal transducer and activator of transcription 3 | 11.61 | 1.74 |
| BAX_MOUSE | Bax | Apoptosis regulator BAX | 8.72 | 5.14 |
| ACTH_MOUSE | Actg2 | Smooth muscle actin | 7.47 | 1.72 |
| LEG1_MOUSE | Lgals1 | Galectin-1 | 6.38 | 1.72 |
| GRAF_MOUSE | Gzmf | Granzyme F | 5.83 | 1.69 |
| CATD_MOUSE | Ctsd | Cathepsin D | 4.88 | 1.71 |
| APAF_MOUSE | Apaf-1 | Apoptotic protease-activating factor 1 | 3.77 | 1.70 |
| MUP1_MOUSE | Mup1 | Major urinary protein 1 | 3.58 | – |
| CRTAP_MOUSE | Crtap | Cartilage-associated protein | 3.11 | – |
| ETFA_MOUSE | Etfa | Electron transfer flavoprotein subunit α, mitochondrial | 2.87 | 1.69 |
| CYGB_MOUSE | Cygb | Cytoglobin | 2.47 | 1.70 |
| COMT_MOUSE | Comt | Catechol o-methyltransferase | 2.46 | 1.70 |
| ACTG_MOUSE | Actg1 | Actin | 2.26 | 1.70 |
| 3HIDH_MOUSE | Hibadh | 3-Hydroxyisobutyrate dehydrogenase, mitochondrial | 2.17 | – |
| ENOG_MOUSE | Eno2 | Gamma enolase | 2.14 | 1.69 |
| ACADL_MOUSE | Acadl | Long-chain specific acyl-CoA dehydrogenase | 2.08 | 1.50 |
| COF1_MOUSE | Cfl1 | Cofilin-1 | 2.06 | 1.46 |
| GRP75_MOUSE | Hspa9 | Heat shock 70 kDa protein 9, mitochondrial | 2.02 | 2.50 |
| KHK_MOUSE | Khk | Ketohexokinase | 1.96 | – |
| GRP78_MOUSE | Hspa5 | Heat shock 70 kDa protein 5 | 1.89 | 2.31 |
| CMBL_MOUSE | Cmbl | Carboxymethylenebutenolidase homolog | 1.73 | – |
| PGK1_MOUSE | Pgk1 | Phosphoglycerate kinase 1 | 1.67 | 1.27 |
| FRIL1_MOUSE | Ftl1 | Ferritin light chain 1 | 1.65 | 1.29 |
| Q91WT7_MOUSE | Akr1c14 | Aldo-keto reductase family 1 member C14 | 1.58 | – |
| SUOX_MOUSE | Suox | Sulfite oxidase, mitochondrial | 1.57 | 1.26 |
| ALBU_MOUSE | Alb | Serum albumin | 1.48 | 1.85 |
| RCN1_MOUSE | Rcn1 | Reticulocalbin-1 | 1.48 | – |
| RGN_MOUSE | Rgn | Regucalcin | 1.38 | 1.97 |
| TKT_MOUSE | Tkt | Transketolase | 1.35 | 1.84 |
| 5NTD_MOUSE | Nt5e | 5′ Nucleotidase | 1.29 | – |
| GSTP1_MOUSE | GSTP1 | Glutathione S-transferase P1 | 0.16 | 0.59 |
| A1AT1_MOUSE | Serpina 1a | α-1-Antitrypsin 1-1 | 0.26 | 0.59 |
| IPSP_MOUSE | Serpina5 | Protein C inhibitor | 0.28 | 0.59 |
| GPX2_MOUSE | Gpx2 | Glutathione peroxidase 2 | 0.34 | 0.59 |
| PRDX3_MOUSE | Prdx3 | Perioredoxin-3, mitochondrial | 0.39 | 0.68 |
| PRDX6_MOUSE | Prdx6 | Peroxiredoxin-6 | 0.41 | 0.59 |
| ALDH2_MOUSE | Aldh2 | Aldehyde dehydrogenase, mitochondrial | 0.47 | 0.60 |
| SMAD3_MOUSE | Smad3 | Mothers against decapentaplegic homolog 3 | 0.51 | 0.77 |
| GDIR2_MOUSE | Arhgdib | Rho GDP-dissociation inhibitor 2 | 0.52 | 0.68 |
| ALDR_MOUSE | Akr1b1 | Aldose reductase | 0.57 | 0.74 |
| HEMO_MOUSE | Hpx | Hemopexin | 0.69 | 0.52 |
| PEBP1_MOUSE | PEBP | Phosphatidylethanolamine-binding protein 1 | 0.71 | 0.52 |
- Note. The table shows an abundance of protein in APAP-treated versus the control samples, ratios > 1.25 are upregulation; ratios < 0.8 are downregulation. Search results with p values less than 0.05 were judged as positive identifications (n = 6). The work was repeated three times.
- C: control liver tissues; D: damaged liver tissues got from APAP group (200 mg·kg−1); N: necrotic liver tissues got from APAP group (300 mg·kg−1).
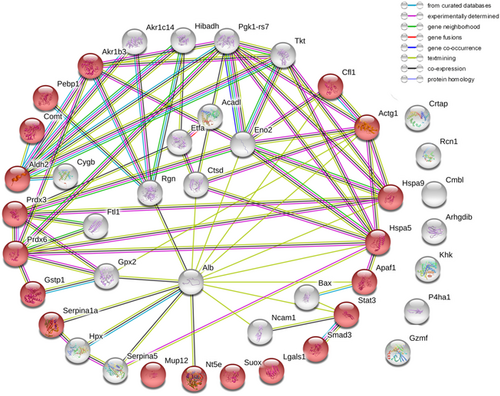
The AILI-related protein–protein interaction networks (PPIN) were constructed by STRING online. The nodes represented proteins; red ball represented the proteins, functionally enriched, in the pathway of response to a chemical (ID Go: 0042221) [Color figure can be viewed at wileyonlinelibrary.com]
| 24 hr | 48 hr | ||||
|---|---|---|---|---|---|
| C | D | N | D | N | |
| STAT3 | − | +− | +++ | +− | + |
| P4H | + | ++ | +++ | ++ | ++ |
| NCAM | − | + | ++ | + | ++ |
| α-SMA | +− | + | + | + | ++ |
| CYGB | + | + | ++ | + | ++ |
| P-STAT3 | − | ++ | − | ++ | + |
| HSP70 | − | ++ | − | ++ | +++ |
| PCNA | +− | ++ | − | ++ | +++ |
| C-kit | +− | − | − | + | + |
- Note. −, negative; +−, weakly positive; +, slightly positive; ++, strongly positive; +++, very strongly positive; C, control liver tissues; N, necrotic liver tissues; D, damaged liver tissues. (n = 6).
APAP-induced cell death in mice and human have been generally believed to be necrosis or necroptosis, but not apoptosis. Many damage-associated proteins were upregulated in present proteomic work, including Bax, Apaf, Grp78, cathepsin D (Ctsd), and granzyme F (Gzmf). Hsp70 and Stat3 were believed by their extent of protective role in liver injury, and they were both upregulated by IL-6 during AILI (Masubuchi et al., 2003; Mühl, 2016; Salminen, Voellmy, & Roberts, 1997; Tolson, Dix, Voellmy, & Roberts, 2006). In this study, IL-6 was elevated significantly at 6 hr after APAP overdose (Figure 1d). The expressions of Hsp70 and Stat3 were increased dramatically in the APAP-treated group. Hsp70 and Stat3 have been reported to be required for liver regeneration after partial hepatectomy (Taub, 1996; Wolf et al., 2014). Here, the protective roles of Hsp70 and Stat3 in AILI, as well as in PCNA and P-Stat3 for hepatocytes regeneration were verified by IHC.
A large number of proteins that had similar patterns in this study with respect to the proteomic analysis of HSCs (Kristensen et al., 2000) aroused our interest. The proteins including cartilage-associated protein (Crtap), cathepsin D (Ctsd), catechol o-methyltransferase (Comt), galectin-1 (Lgals1), α-SMA, γ-actin (Actg1 and Actg2), γ-enolase (Eno2), Ncam1, P4hα1, cofilin-1 (Cfl1), 5′ nucleotidase (Nt5e), Phosphoglycerate kinase (Pgk1), and reticulocalbin (Rcn1) were highly expressed, whereas α-1-antitrypsin 1-1 (serpina 1a) and RHO GDP-dissociation inhibitor 2 (Arhgdib) were lowly expressed. Another HSC marker Cygb, having an alternative name stellate cell activation-associated protein (STAP; Kawada et al., 2001), was also presented in our proteome work. These proteins might be the makers of activated HSC in AILI, so we next verified P4hα1, Ncam, α-SMA, and Cygb by IHC. GAFP was detected to verify the hypothesis.
3.3 AILI-related PPIN made by Cytoscape
The PPIN of differentially expressed proteins in AILI was made by Cytoscape. There are 39 nodes (17 upregulated proteins, 8 downregulated proteins, and 14 secondary proteins colored by yellow, red, and purple, respectively); 166 edges as a blue line and 8.51 mean connected degrees are shown in Figure 4. There are 12 important node proteins based on their degree more than the average degree, including Ywhae (14-3-3 epsilon), Pgls (6-phosphogluconolactonase), Hsd3b4 (3 β-hydroxysteroid dehydrogenase type 4), Ywhaz (14-3-3 zeta/delta), Cfl1, Hsd3b7, Hspa5, Dlg4 (postsynaptic density protein 95), Kcnma1 (calcium-activated potassium channel subunit α-1), Pgk1, Gstp1, and Serpina 1a. Ywhae plays a central role in AILI-related PPIN, where 22 proteins having interactions with Ywhae contained 16 upregulated proteins (Suox, Stat3, Pgk1, P4hα1, Ncam1, Lgals1, Hspa5, Gzmf, Etfa, Eno2, Cygb, Ctsd, Comt, Cfl1, Actg2, and Acad1) and 6 downregulated proteins (serpina 1a, Prdx6, Prdx3, Gstp1, Arhgdib, and Aldh2). Ywhae and Ywhaz are the members of the 14-3-3 family, which take part in phosphorylation-dependent protein interaction and can regulate eukaryotic cells repair or regeneration (Kaplan & Fournier, 2017; Xue, Guo, Chen, Niu, & Xu, 2015). Ywhae was found based on the extent of its central role in liver regeneration after partial hepatectomy (X. G. Chen & Xu, 2014). The PPIN analysis suggested an important role of Ywhae in AILI, and its interacting proteins might be involved in the pathway of liver regeneration.
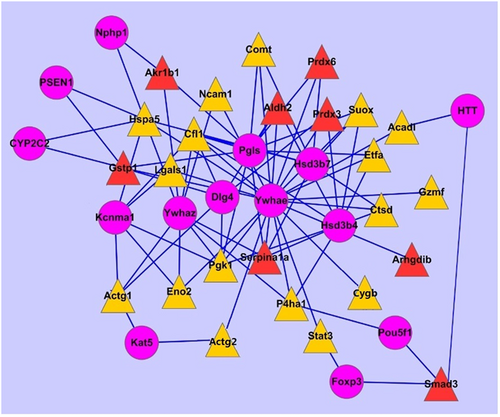
The AILI-related PPIN made by Cytoscape software. The upregulated proteins, the downregulated proteins, and the secondary proteins interacting with them were displayed by a yellow triangle, a red triangle, and a purple dot, respectively. AILI: APAP-induced liver injury; PPIN: protein–protein interaction network [Color figure can be viewed at wileyonlinelibrary.com]
3.4 Validation of Hsp70 and Stat3 by immunohistochemistry
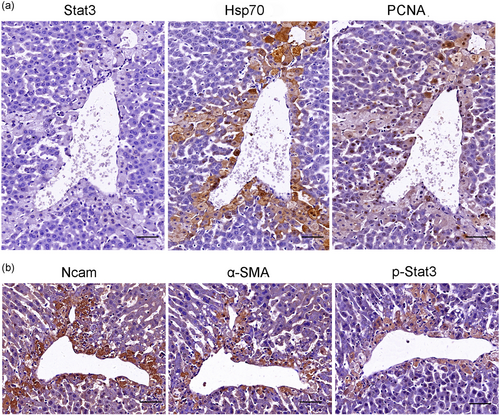
IHC analysis results showed that the expression of Hsp70 was increased staining from 2 to 48 hr, it was positive in mild swelling hepatocytes at 2 hr, strongly positive in swollen hepatocytes, and rarely at necrotic regions at 24 hr; but at the 48 hr, the expression increased along with the repair or regeneration of the liver. PCNA had the same pattern with Hsp70, which provided direct evidence for the proregeneration role of Hsp70 (Figure 5). In serially cut sections, the expression of Stat3 had a significant difference with Hsp70 and PCNA, and it increased with the degree of damage and was strongly positive in necrotic regions. Correlation analysis displayed that Stat3 was positively correlated with necrosis, whereas Hsp70 was positively correlated with PCNA (Figure 6).
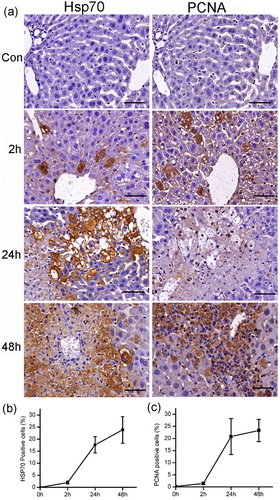
The time course of Hsp70 and PCNA expression in the liver after APAP administration. The expressions of Hsp70 and PCNA were increased in a time-dependent manner after APAP administration (a). Quantitative analysis showed the increasing staining of Hsp70 (b) and PCNA (c). Scale bar = 50 μm. PCNA: proliferating cell nuclear antigen [Color figure can be viewed at wileyonlinelibrary.com]
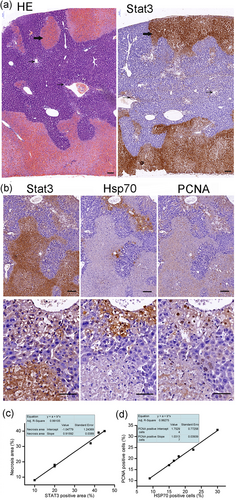
The patchy necrosis regions were strongly positive for Stat3, the staining of Stat3 was strengthened with the degree of damage at 24 hr after APAP administration (300 mg·kg−1) (a). The damaged hepatocytes were swelling, the nucleus kept integrity, the cytoplasm wasn’t red dyed, and the staining of Stat3 was mild (narrow arrow); whereas in necrosis regions, the dead hepatocytes connected to form flakes with the nuclear fragmentation, the plasma-red staining, the staining of Stat3 was strongly positive (bold arrow). Serial sections were performed to detect the expression and distribution of Stat3, Hsp70, and PCNA at 24 hr after APAP administration. The representative micrographs depicting Stat3, Hsp70, and PCNA stained hepatic sections were observed under ×10 (upper), ×40 (subtus) objectives (b). The staining of Hsp70 and PCNA was mainly in swelling hepatocytes; they were negative in necrosis regions. The expression of Stat3 was positively correlated with necrosis (c). The expression of Hsp70 was positively correlated with PCNA (d). Scale bar = 50 μm. PCNA: proliferating cell nuclear antigen [Color figure can be viewed at wileyonlinelibrary.com]
3.5 Validation of P4hα1, Ncam, α-SMA, and Cygb by immunohistochemistry
Retinoid-storing HSCs had recently been described as a liver-resident MSC population, which could differentiate into HPC and contribute to hepatocyte proliferation and liver regeneration when activated (Kordes et al., 2014). Depletion of activated HSCs leads to more serious liver damage and abnormal liver regeneration in the APAP-induced acute liver injury (Shen et al., 2011). It was supposed that those proteins with the similar patterns with the study of Kristensen et al. (2000) might be the makers of activated HSC in AILI. But surprisingly, the staining of P4hα1, Ncam, and α-SMA was positive at necrotic regions and damaged hepatocytes at 24 and 48 hr, respectively, after APAP administration (Figure 7a). In serially cut sections, the positive cells/areas of GAFP were codistributed with Ncam (Figure 7b). These evidence demonstrated that P4hα1, Ncam, α-SMA, as well as GAFP were not only expressed in HSCs but also expressed in damaged and necrotic hepatocytes. Another HSC marker Cygb was similar to P4hα1, α-SMA, and Ncam (Figure 8d,e). Moreover, the dotted expressions of Cygb were present in the cytoplasm of normal hepatocytes around the portal area (Figure 8a,b) but absent in hepatocytes around the central vein in a normal liver (Figure 8a,c). Cygb plays a protective role in various organs under physiological conditions in maintaining homeostasis of the antioxidant system (Thuyle et al., 2016). We suspected that Cygb might undergo deformation, metastasis, and activation during AILI. It is well known that the hepatocytes around the central vein are prone to AILI; the lack of Cygb in these cells might partially account for the pathology. The differential distribution of Cygb in the portal areas and the central venous regions in the normal hepatocytes allows us to update our understanding of the mechanism of liver self-protection.
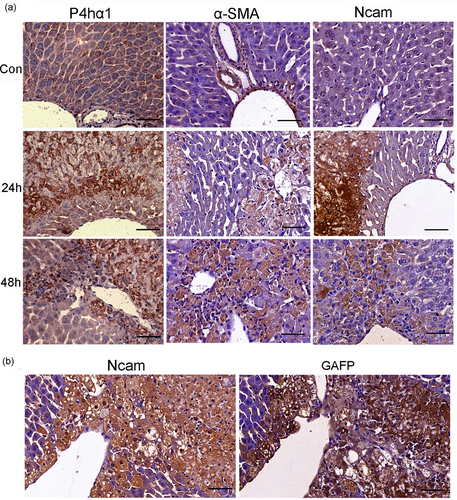
The expression of P4hα1, α-SMA, Ncam, and GAFP at different time points after APAP administration (300 mg·kg−1). (a) The expression of P4hα1 in normal liver tissue was slightly positive; the staining was increased in damage and necrosis areas at 24 hr, and kept strong positive at 48 hr. The expression of α-SMA in normal liver was restricted at vascular wall except central vein. Ncam was nearly negative in normal liver tissue. But at 24 and 48 hr, the staining of Ncam and α-SMA had the same pattern with P4hα1. (b) Serially cut sections showed that the GAFP positive cells/areas were codistributed with Ncam positive places. Scale bar = 50 μm [Color figure can be viewed at wileyonlinelibrary.com]
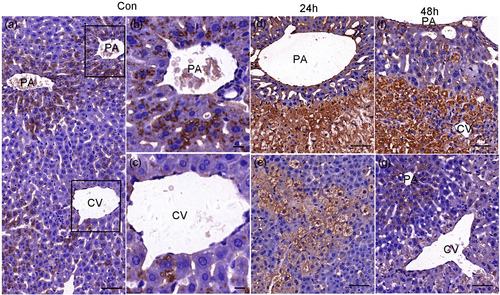
The expression of Cygb in the normal and necrosis liver tissue (APAP 300 mg·kg−1). The distribution of Cygb in normal liver tissue (a). Dotted expressions existed in the cytoplasm of normal hepatocytes around the portal area (PA) (b). The expression of Cygb was rarely seen in hepatocytes around the central vein (CV) in a normal liver (c). The staining was increased in necrosis areas at 24 hr after APAP overdose, whereas dotted expressions disappeared in the cytoplasm of hepatocytes around PA at this stage (d), the damaged hepatocytes were also positive (e). The immunoreactivity were strongly positive in original necrosis areas at 48 hr (f), the dotted expressions were recovered in hepatocytes around PA in the recovered place at 48 hr (g). Scale bar = 50 μm, a, d, e; Scale bar = 10 μm, b, c [Color figure can be viewed at wileyonlinelibrary.com]
3.6 Different repair modes in the necrotic area and mildly damaged area
The mechanism of the repair or regeneration of the liver in necrotic areas was complicated. The expression of Stat3 was increased in areas of damage and necrosis (Figure 9b), whereas P-Stat3 was hardly expressed in areas of necrosis (Figure 9e). It indicated that the activation of Stat3 might be inhibited in necrotic regions. However, during the recovery stage (48 hr), Stat3-positive staining predominantly coexisted with P-Stat3 in the original necrotic area and formed a complementary relationship (Figure 9c,f). The regeneration activity went to peak at 48 hr, as shown by the proliferation marker of PCNA and Hsp70 (Figure 5). The immunoreactivities of Ncam and α-SMA were kept positive (Figure 7). Further, another stem cell marker C-kit was positive (Figure 9i). All the evidence showed that the renewal from necrosis to regeneration was displayed in the original necrotic area at this stage. Moreover, a large number of inflammatory cells expanded in areas of necrosis to remove the debris, which profited hepatocytes regeneration (Antoniades et al., 2012). We did not detect the significant change of IL-10 at 2 and 6 hr after APAP administration, but a significant decline was found at 24 hr (Figure 1f). We hypothesized that decreased IL-10 might be in favor of inflammatory cells for removing the debris.
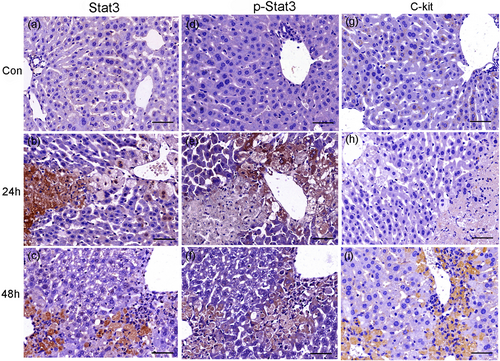
The expression of Stat3, P-Stat3, and C-kit in normal and necrosis liver tissue (APAP 300 mg·kg−1). The immunostaining of Stat3, P-Stat3, and C-kit. Stat3, P-Stat3, and C-kit were negative in normal control liver tissues (a, d, g). The staining of Stat3 was increased with the degree of injury at 24 hr (b) whereas the one of P-Stat3 showed the opposite pattern (e). In serially cut sections at 48 hr, the staining of Stat3 and P-Stat3 was complementary (c, f). C-kit was absent at necrosis area at 24 hr (h) but appeared in original necrosis place at 48 hr after APAP administration (i). (n = 6). Scale bar = 50 μm [Color figure can be viewed at wileyonlinelibrary.com]
However, the repair or regeneration was less complicated in mild damaged livers or mild damaged regions. The damaged cells, termed as perivenous cells, around the central veins and the portal veins were highlighted. These hepatocytes had mild swelling and were positive for Hsp70, p-Stat3, Ncam, and α-SMA, but almost negative for Stat3 at 24 and 48 hr after the APAP administration (Figures 10, 11). Further, the positive reaction of C-kit appeared at 48 hr (Figure 11c). All the evidence showed that these perivenous cells had the ability of self-repair or regeneration. When activated they reversed into stem cell-like embryonic cells constructing the first line of defense against the toxicant, such as APAP.
The immunoreactivity in mildly damaged liver tissue (APAP 200 mg·kg−1) was confined mainly to hepatocytes around central veins and portal veins at 24 hr after APAP administration. Serially cut sections showed the staining of Stat3 was nearly negative in hepatocytes around central veins (a), whereas the staining of Hsp70 (b) and PCNA (c) were positive. Serially cut sections showed the positive staining of Ncam (d), α-SMA (e), and P-Stat3 (f) had the similar pattern in hepatocytes around central veins. (n = 6). Scale bar = 50 μm. PCNA: proliferating cell nuclear antigen [Color figure can be viewed at wileyonlinelibrary.com]

The immunoreactivity in mild damaged liver tissue (APAP 200 mgkg−1) was confined mainly to hepatocytes around central veins and portal veins at 48h after APAP administration. The expression of Stat3 was nearly negative in hepatocytes around portal veins (A), the expression of Hsp70 (B), C-kit (C), Ncam (D), α-SMA (E) and p-Stat3 (F) were detected in hepatocytes around central veins and portal veins. G, H, I: Serially cut tissue sections were stained by HE, p-Stat3 and Stat3 respectively on recovered tissues at 48h after APAP which showed the Stat3 was nearly absent in recovered hepatocytes while p-Stat3 was still positive. (n = 6). CV: central vein, IV: Interlobular vein, IA: Interlobular artery, PV: portal vein [Color figure can be viewed at wileyonlinelibrary.com]
The IHC results were scored by QuantCenter 2.0 (3DHISTECH Ltd.; Table 2). The expressions of Stat3, as well as P4hα1, Ncam, α-SMA, and Cygb were increased with the degree of damage. The expressions of p-Stat3 together with Hsp70 and PCNA were negative in necrotic regions at 24 hr, whereas they were recovered with the repair or regeneration at 48 hr. The expressions of P4hα1, Ncam, α-SMA, and Cygb were always positive at both damage and necrotic regions. The alternation from Stat3 to P-Stat3 in necrotic regions along with the recovery of AILI might represent hepatocytes from death to renewal; the mechanism might be that the inactivated Stat3 was transformed into the activated one along with the energy for recovery.
4 DISCUSSION
AILI is a commonly used model for acute injury. Glucuronization, sulfation metabolisms are the main metabolic detoxification pathways of APAP, and the CYP enzyme-mediated oxidative metabolism is the metabolic toxicity pathway of the APAP, which leads to the formation of a reactive metabolite NAPQI (Nelson, 1990). The production of NAPQI reacts rapidly with glutathione (GSH) under the catalysis of Gstp1, which causes dramatic depletion of cellular GSH levels in the liver (Mitchell, Jollow, Potter, Gillette, & Brodie, 1973). The consumption of GSH is a critical event at the initial step of APAP toxicity. The overdose of APAP leads to the formation of excess NAPQI, which exceeds the capacity of hepatocellular GSH, and then NAPQI covalently binds to the cellular proteins (Jollow et al., 1973). But the covalent binding is an initiating event; the secondary amplification is the main reason that causes cell death. ROS overproduction during APAP overdose has been deemed as the second hit for hepatic damage due to induction of oxidative stress (Hinson, Pike, Pumford, & Mayeux, 1998; Jaeschke, Knight, & Bajt, 2003). Oxidative stress increases cellular levels of ROS, induction of lipid peroxidation and peroxynitrite. Lipid peroxidation is a consequence of ROS generation; 4-HNE and MDA are the principal products of lipid peroxidation process (Ayala, Muñoz, & Argüelles, 2014). The excess of lipid peroxidation and peroxynitrite leads to mitochondrial permeability transition pore (MPTP) opening, resulting in cessation of ATP synthesis, and ultimately cell death (Jaeschke & Ramachandran, 2018; Knight, Ho, Farhood, & Jaeschke, 2002). Here, the present proteomic results confirmed that the redox system was impaired in AILI due to the oxidative stress and the details would be discussed to illustrate the mechanism of AILI.
At current study at 24 hr after APAP administration, the most enriched biological function categories of differential proteins still belong to oxidoreductases, including the Gstp1, Ppdx3, Aldh2, Gpx, and Ppdx6. Their depletion preceded the pathogenesis of APAP hepatotoxicity. Gstp1 is capable of rapidly detoxifying NAPQI by catalyzing conjugation with reduced GSH (Mitchell et al., 1973). As reported, APAP reduced hepatic GSH content, followed by depletions of GSH S-transferases (Hirayama, Murawaki, Yamada, Aoto, & Ikeda, 1983). Gstp1 is one of the mitochondrial proteins identified as acetaminophen-adducts (Qiu, Benet, & Burlingame, 1998). An in vitro study showed Gstp1 trapped the hepatotoxic chemically reactive metabolites (CRMs) of APAP and NAPQI and exhibited both site-specific modification of the protein and reduced enzyme activity (Jenkins et al., 2008). Although one study reported that Gstp1-deficient mice showed more resistance to APAP toxicity (Henderson et al., 2000), Gstp1 could also effectively limit cytotoxicity of some carcinogens by catalyzing the conjugation of metabolites with GSH (Kabler et al., 2009), and overexpression of Gstp1 alleviated quinoneimine-induced cytotoxicity even under GSH depletion condition (Zhang et al., 2018). Further Gstp1 could inhibit JNK signaling after APAP administration (Elsby et al., 2003), and JNK played a major role in APAP hepatotoxicity (Gunawan et al., 2006). Gstp1 was proved crucial in cellular response to oxidative stress and protected cells against apoptosis (Yin, Ivanov, Habelhah, Tew, & Ronai, 2000). Recombinant Gstp1 effectively suppressed the mortality rate of endotoxic shock and inhibited sepsis-related HMGB1 release (Luo et al., 2009; Zhou et al., 2018), and HMGB1 was a highly sensitive biomarker for liver damage and necrosis in both animals models and patients after APAP overdose (Antoine et al., 2012). It was suggested that Gstp1 could not only detoxify NAPQI but also influence signal transduction in AILI.
The enzymatic cycle of Prdx6 also required Gstp1-catalyzed glutathionylation and consumption with GSH (Manevich & Fisher, 2009). Prdx6 had both the phospholipase A2 and the GSH peroxidase activities. Recently, studies showed that both the phospholipase A2 and the GSH peroxidase activities were required for repairing peroxidized cell membranes, and Prdx6 could directly reduce phospholipid hydroperoxides in the repairing process (Fisher et al., 2018; H. Li et al., 2015). As reported, Prdx6 was the APAP adduction, which was gender-specific in APAP-induced liver damage in mice (Mohar et al., 2014). One hyper reaction monitoring (HRM) study showed that Prdx6 was one of NAPQI adducted proteins and mitochondrial oxidative stress-related proteins (Bruderer et al., 2015). Prdx6 could protect cells against mitochondrial dysfunction by reducing ROS and help in recovery of mitochondrial respiration in ischemia-reperfusion-induced liver injury (Eismann et al., 2009), and the protective mechanism against oxidative damage might be though PI3K/AKT signaling (Zha et al., 2015). The covalent binding of NAPQI to mitochondrial proteins would trigger mitochondrial protein thiol oxidation (Andringa, Bajt, Jaeschke, & Bailey, 2008; W. Chen et al., 1999). The oxidation of thiols to higher oxidation states, such as SOH, SO2H, and SO3H may be related to oxidative stress (Cooper, Patel, Brookes, & Darley-Usmar, 2002; Venkatraman et al., 2004). Prdx6 is the only mammalian 1-Cys Prdx that contains a single conserved cysteine in the protein monomer; the cys has thiol that can be oxidized to the sulfenic form (Fisher., 2017). The sulfite can be converted to sulfate by sulfite oxidase (Suox; Feng, Tollin, & Enemark, 2007), here the upregulation of Suox might be an evidence for the increase of thiol oxidation. On the basis of this, we predicted that Prdx6 might undergo thiol oxidation after covalent binding with NAPQI, and the modification of Prdx6 let it lose the ability to repair the peroxidized mitochondrial membrane that contributed to mitochondria dysfunction and hepatocytes death.
Prdx3 is a 2-Cys peroxiredoxin localized in the mitochondria involved in antioxidant defense through peroxidase activity (Yewdall et al., 2018). We predicted that Prdx3 might also undergo thiol oxidation as it has 2 Cys. It was reported Prdx3 oxidation led to an increase of H2O2 in mitochondrial, exacerbated MPT, phosphatidylserine exposure, GSH depletion, thiol protein oxidation, and protein carbonylation, preceding apoptosis and cell death (K. K. Brown, Eriksson, Arnér, & Hampton, 2008; Cox, Pullar, Hughes, Ledgerwood, & Hampton, 2008). Mitochondria-specific fluorescent probes demonstrate that Prdx3 is essential for preserving normal mitochondrial function by maintaining membrane potential and mitochondrial mass (Wonsey, Zeller, & Dang, 2002). Prdx3 maintained the integrity of mitochondria and its depletion led to an enhancement of oxidative stresses (Jiang et al., 2017; Lee, Wi, Min, & Lee, 2016). Overproduction of Prdx3 could protect against traumatic brain injury by conserving mitochondrial function and increasing mitochondrial biogenesis (Hu, Dang, Wang, Li, & Zhang, 2018). Here, the downregulation of Prdx3 might attribute to its oxidation, the lack of Prdx3 in hepatocytes might lead to the increase in H2O2, impairing the integrity and function of mitochondria.
Aldh2 had been identified as a major APAP-binding protein in liver mitochondria (Landin, Cohen, & Khairallah, 1996), and APAP inhibited Aldh2 (8.3–19%) in the liver, small intestine, and stomach (Y. P. Lee et al., 2013). Aldh2 was crucial in the oxidative metabolism of toxic aldehydes in the organism, in particular, detoxifies 4-HNE and MDA (Breitzig, Bhimineni, Lockey, & Kolliputi, 2016). Aldh2 was also one of the identified 4-HNE targets in APAP- mediated oxidative stress (J. M. Brown et al., 2014). Decreased expression of mitochondrial Aldh2 increased Bax and the rates of apoptosis via increasing 4-HNE and activating the MAPK pathway (Zhong et al., 2016). Aldh2 deficiency exacerbated CCl4-induced hepatic fibrosis via increasing ROS production and apoptosis (Ma et al., 2018). Recent studies proved that activation of Aldh2 could alleviate oxidative stress via clearance of cytotoxic aldehydes, eliminating toxic effects of aldehydic overload on mitochondrial bioenergetics and inhibiting the MPTP in cerebral, cardiac, and lung/liver ischemia/reperfusion (I/R) injuries (Deza-Ponzio, Herrera, Bellini, Virgolini, & Hereñú, 2018; Liu et al., 2018; Zhang et al., 2018). Here, the decrease of Aldh2 resulted in the accumulation of aldehydes, increasing the MPTP in AILI.
Patients with more mitochondrial damage are more likely to die, demonstrating that mitochondrial dysfunction was crucial to AILI in humans (McGill et al., 2014). The decrease of above mitochondrial protective proteins led to the accumulation of excessive ROS and aldehydes, and ultimately, impaired mitochondria structure and function. Clinically, support for GSH synthesis with NAC was the standard care in APAP overdose (Hodgman & Garrard, 2012). The protection mechanisms of GSH or NAC include preventing covalent modification of cellular proteins, scavenging of ROS and peroxynitrite, and improving ATP recovery (C. Saito, Zwingmann, & Jaeschke, 2010). But the efficiency of NAC for late presenters is controversial, more evidence showed that NAC was effective only for early-presenters and was less effective for late presenters (Athuraliya & Jones, 2009; Knight et al., 2002; Yang, Miki, He, Killeen, & Fink, 2009), we proposed the reason that might be early supplement of GSH could prevent those protective mitochondrial proteins from being modified, which was beneficial for sustaining mitochondria function, but at the late stage of poisoning, these mitochondrial proteins were already impaired or consumed. Simple supplementation of GSH could not quickly restore their levels and mitochondrial function. More efficient strategy should be opted to restore protein activity and mitochondrial function.
The decrease in antioxidative proteins also increased apoptotic signals, such as Bax (Cox, Brown, Arner, & Hampton, 2008; Kim, Lee, Rhee, Seo, & Pak, 2013; Zhong et al., 2016). After APAP overdosing, Bax translocated from the cytosol to the mitochondria rapidly and contributed to APAP-induced nuclear DNA fragmentation and cell death (Bajt et al., 2008). Although the occurrence of necrosis was caspase-independent, they still required the apoptotic regulators Bax/Bak, which was confirmed in the current study. Bax regulated the permeability characteristics of the outer mitochondrial membrane in their nonoligomerized state during the process of apoptosis, whereas it also initiated necrosis via opening of the inner membrane MPTP, and Bax-driven mitochondrial fusion lowers the threshold for MPTP opening (Whelan et al., 2012). MPTP activation was the predominant mechanism for Bax-induced cytochrome c release from mitochondria (Gómez-Crisóstomo, López-Marure, Zapata, Zazueta, & Martínez-Abundis, 2013). Bax was localized at the mitochondrial outer membrane; it could also be localized to the ER and lysosomes. The translocation of Bax from the cytosol contributed to the endoplasmic reticulum (ER) stress and Ca2+ overloading (Scorrano et al., 2003). Grp78 also named Hspa5 as a representative of ER stress (ERS) marker, which coupled ERS to the cell death program (Rao et al., 2002). Bax was a mediator of lysosomal membrane permeabilization (LMP), which promoted the release of Ctsd to the cytosol. Ctsd could bind to Apaf, which resulted in Bax translocation to mitochondrial in turn, aggravating the release of cytochrome c (Appelqvist et al., 2012). Here, the upregulations of Bax, Apaf, Grp78, and Ctsd confirmed that the damage of mitochondrial, ER,and lysosome were all involved in AILI. The mode of cell death in mice models was oncotic necrosis but not apoptosis (Jaeschke et al., 2014), it remains unclear what triggers hepatocytes necrosis rather than apoptosis as Bax is both involved in the processes. The emergence of Gzmf in present proteomic work might provide some evidence for this question.
It is interesting to note the current study revealed that the upregulation of Gzmf might also be involved in AILI. Shi et al. (2009) reported that Gzmf caused necroptosis by impairing mitochondrial electron transport to abolish ATP regeneration. The necroptosis was characterized by cytochrome c release without caspase activation, which is similar to the APAP-induced hepatocytes death. The current study suggested that the release of Gzmf after APAP overdosing led to the dramatic decline of ATP, the overproduction of Bax triggered cytochrome c release, in the absence of ATP, cytochrome c binding to Apaf-1 triggered its inactive aggregation and prevented apoptosome assembly. It concluded that Bax, Apaf-1, and Gzmf worked together to induce cell death in mice. However, more details of Gzmf’s involvement in AILI need to be investigated, and the regulator of Bax still unknown.
The most noteworthy feature in current study is the dramatic upregulation of Stat3 in necrotic liver tissues. It was well coincident with the previous report that the hepatic mRNA level of Stat3 was upregulated dramatically after APAP overdose (Ruepp et al., 2002). IHC analysis showed that both Stat3 and p-Stat3 contributed to the upregulation of Stat3 in proteomic work. It was clear that the activation of Stat3 played a protective role in AILI by promoting liver repair or regeneration (Mühl, 2016), but the role of basal/unphosphorylated Stat3 in AILI is still unknown for less evidence. Previous findings showed that the inhibition of Stat3 phosphorylation increased the proapoptotic Bax/Bcl-2 ratio and promoted cancer cell apoptosis (Ilisso et al., 2016; T. L. Lee et al., 2008). We considered that the blockage of Stat3 activation might induce the upregulation of the basal level of Stat3 in turn, subsequently increase the expression of Bax. The overexpression of basal Stat3 combined with Bax, Apaf-1, and Gzmf co-led to the necrosis in AILI. The current study discovered that the basal/unphosphorylated Stat3 was related to necrosis after APAP overdose.
Necrosis caused the release of a number of damage-associated molecular patterns (DAMP) mediators, such as high-mobility group box 1 (HMGB1) protein, DNA fragments, heat shock proteins, and others (Jaeschke, Williams, Ramachandran, & Bajt, 2012). However, the current study demonstrated that the Hsp70 extented protective role in AILI by promoting hepatocytes repair or regeneration, the expression of Hsp70 in the necrotic area was nearly negative, while its expression was high in repaired or regenerated hepatocytes. In addition, the high expression of Hsp70 in original necrotic regions at 48 hr might participate in the resolution of the inflammatory response as Hsp70 could stimulate macrophage-mediated phagocytosis of wound debris and limit the inflammatory response (Borges et al., 2012; Kovalchin et al., 2006). Rather, current study suggested that unphosphorylated Stat3 might be a DAMP molecule, which could attract macrophages to necrotic regions, as evidenced by IHC that the expanded macrophages were codistributed with Stat3 at necrotic regions at 48 hr after APAP. Or more precisely, unphosphorylated Stat3 might be a necrosis-associated molecular pattern (NAMP) molecular.
The activated macrophages protect the liver from AILI also by releasing IL-6, and IL-6 could not only activate Stat3 but also upregulate the hepatic expression of Hsp70 (Masubuchi et al., 2003). Hsp70 promoter also contains functional Stat3-binding sites and activated Stat3 signaling can upregulate Hsp70 expression (Guo et al., 2018; Y. Saito et al., 2014). Here, the expressions of p-Stat3 and Hsp70 had the same characteristics in the liver section of mice with different degree of damage, for mild injury the perivenous cells constructed the first line of intoxicant, these cells repaired themselves by IL-6-Stat3-Hsp70 pathways; when or where the ATP was exhausted, the Hsp70 and activated Stat3-mediated liver regeneration pathway might be blocked, and then the necrosis occurred. The inflammatory cells especially macrophages were enrolled or proliferated to remove the dead cell debris first, followed by the recovery of ATP-dependent p-Stat3-Hsp70 regeneration pathway. The comparison of the two different degrees of AILI also allowed us to find that the Stat3 would be specific to necrosis biomarker, and the accumulation of unphosphorylated Stat3 and the loss of regeneration signals in these places might account for necrosis, however, the relationship between Stat3 and necrosis needs further investigation.
ATP deficiency might be the cause of low phosphorylation of Stat3. The lack of ATP also resulted in the less expression of Hsp70 in the necrotic area as the chaperone activity of Hsp70 was also depended on ATP binding and hydrolysis (Mayer & Bukau, 2005; Sriram, Osipiuk, Freeman, Morimoto, & Joachimiak, 1997). Furthermore, GSH synthesis is dependent upon ATP (Y. Chen, Shertzer, Schneider, Nebert, & Dalton, 2005). It is suggested that ATP might be a useful target to treat AILI, and as reported, prevention of ATP depletion or enhancement ATP synthesis were potential therapies for AILI (Hwang, Kim, Noh, Gang, et al., 2015, Hwang, Kim, Noh, Choi, et al., 2015). However, enhancing ATP synthesis combined with scavenging of peroxynitrite and ROS might be more efficient for the treatment of AILI (C. Saito et al., 2010).
In the liver sections of 48 hr after APAP, a large number of macrophages were recruited to necrotic regions. As reported, these macrophages gathered in preparation for tissue repair, including scavenging necrotic debris by phagocytosis, resolution of the inflammatory response, promoting angiogenesis by expressing proangiogenic growth factors and promoting collagen production by activation HSCs (Kato et al., 2011, Kumagai et al., 2015). Proteomic results showed that the expressions of P4hα1, Ncam, α-SMA, and Cygb were upregulated at 24 hr after APAP. The study of Kristensen et al. (2000) reported that they might represent the activation of HSCs. Although excessive accumulation of extracellular matrix proteins, including collagen in patients with chronic inflammation, leading to liver fibrosis, fibrogenesis is an important wound-healing response for acute or chronic liver injury (X. Li et al., 2017; Matsuda et al., 2018). The high expressions of P4hα1, Ncam, α-SMA, and Cygb in the current study might be involved in fibrogenesis. P4hs are key enzymes in the generation of stable collagen (Myllyharju, 2003). The sharply increased P4hα1 might contribute to collagen deposition in APAP-induced ALF here. The expression of P4h is regulated by various cytokines, especially IL-6 (L. Li et al., 2011) and IL-6 was upregulated significantly in the current study. It was reported that the expression of Ncam is upregulated in ductular reaction (DR) cells during chronic liver diseases (Strazzabosco & Fabris, 2014). DR is associated with most liver diseases, which plays a role in tissue repair along with HPC activation (Desmet, Roskams, & Van Eyken, 1995; Knittel, Aurisch, Neubauer, Eichhorst, & Ramadori, 1996). The HSCs can upregulate the expression Ncam as well as α-SMA (Berardis et al., 2014). It was reported that the death of hepatocytes activated HSCs and fibrogenesis in ALF in an attempt to repair damaged tissue (Dechêne et al., 2010). Some reports provided evidence that activated HSCs were involved in both the alleviation of liver damage and the proliferation of hepatocytes in AILI (Chang et al., 2015; Shen et al., 2011). Our study supported the clinical finding that the fibrosis induced by excess hepatocytes death was favored by liver repair in ALF (Dechêne et al., 2010), but far more than that the upregulations of P4hα1, Ncam, α-SMA, and Cygb represented an intermediate stage of hepatocytes among damage, necrosis and regeneration rather than only special cells markers such as HSCs or HPCs, and the PPIN analysis by Cytoscape showed that these proteins interacted with Ywhae, a central factor in liver regeneration (X. G. Chen and Xu, 2014). It is suggested that these proteins might participate in liver repair or regeneration, which allowed us to re-evaluate the role of hepatocytes in liver self-repair.
The mechanisms of late toxicity in AILI are quite complicated, and there still lacks evidence for the effective clinical treatments. Here, the time course of toxicity was monitored by clinical chemistry and histological parameters, the proteome analysis focused on the differential proteins at the most serious stage, allowing us to detect a comprehensive of protein regulation of late toxicity in AILI, in addition, the dose and time-dependent protein changes was confirmed by IHC analysis, the in situ measurements of proteins by IHC displayed more precise information, which is a powerful complement for proteomics. By the combination of these two techniques, the AILI-related proteins were classified into the respects of protection/defense, damage/repair and necrosis/regeneration. More importantly, the novel insights into the AILI were displayed here, the Gzmf-mediated necroptosis was involved in AILI, the intermediate state of hepatocytes were verified by the expressions of P4hα1, Ncam, α-SMA, and Cygb, the relationship of unphosphorylated Stat3 with necrosis was discovered. The progress of pathology and involved factors are shown in Figure 12. However, more studies need to address the exact mechanisms of APAP-induced Stat3 upregulation and necrosis. The current study also displayed that the strong self-repair and compensatory regeneration capacity of the liver were more booming at the late stage of poisoning. It is suggested that any improper treatment of these activities may lead to liver failure. Therefore, understanding the progress of pathology and the exact roles of changed factors is crucial for proper clinical treatment. The current study provided more detailed information, especially regarding the necrosis and repair-related factors in AILI, which was beneficial for the precision medical treatment for the patients with AILI.
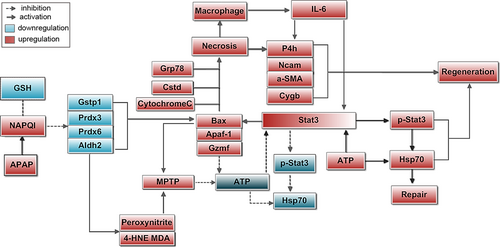
Factors and mechanisms involved in liver necrosis and regeneration in AILI. The overdose of APAP led to the formation of excess NAPQI, which exceeded the capacity of hepatocellular GSH, then NAPQI covalently bound to cellular proteins and impaired these proteins. The decreases of antioxidative proteins led to the accumulation of excessive peroxynitrites and aldehydes, leading to MPTP opening, resulting in cessation of ATP synthesis. The decrease in these proteins also increased Bax. Bax initiated necrosis via opening the inner membrane MPTP. The upregulations of Bax, Apaf, Grp78, and Ctsd represented the damages of mitochondrial, ER, and lysosome all participated in AILI. More importantly, Gzmf was involved in AILI through impairing mitochondrial electron transport to abolish ATP regeneration. In the absence of ATP, the activation of Stat3 was blocked, inducing the upregulation of the basal level of Stat3 in turn, subsequently increasing the expression of Bax and necrosis. The macrophages were enrolled to necrotic to scavenge dead debris by phagocytosis, and they also promoted regeneration by releasing IL-6. The protective effect of Hsp70 was also IL-6/Stat3 signaling dependent and ATP dependent. Along with the recovery of ATP, the IL-6/Stat3/Hsp70 mediated repair or regeneration was booming at the late stage of AILI. IL-6 also promoted repair or regeneration by regulating P4h. The upregulations of P4hα1, Ncam, α-SMA, and Cygb represented fibrogenesis, which was involved in liver repair; furthermore, their high expressions in damaged/necrotic/regenerated hepatocytes revealed the role of hepatocytes in liver self-repair. AILI: APAP-induced liver injury; GSH: glutathione; MPTP: mitochondrial permeability transition pore [Color figure can be viewed at wileyonlinelibrary.com]
ACKNOWLEDGMENTS
This study was supported by Natural Science Foundation of China (Grant No. 81674065) and the Open Project of State Key Laboratory of Proteomics (Grant No. SKLP-O201415).
CONFLICTS OF INTEREST
The authors declare that there are no conflicts of interest.
AUTHOR CONTRIBUTIONS
J.Y. and Q.F. designed the study; Q.F., W.X., C.L., N.Z., G.D., J.Y., J.S., and L.L. conducted the experiments; Q.F. and C.L. performed analysis and construction of network pharmacology; N.Z. performed proteomics analysis; Q.F., L.L., and J.Y. analyzed the data; Q.F. and J.Y. wrote the paper.


