Retracted: Long noncoding RNA nuclear enriched abundant transcript 1 impacts cell proliferation, invasion, and migration of glioma through regulating miR-139-5p/ CDK6
Abstract
Aims: We aimed to explore the impact of long noncoding RNA (lncRNA) nuclear enriched abundant transcript 1 (NEAT1) on cell proliferation, invasion, and migration of glioma.
Methods: Differentially expressed genes were screened out from Gene Expression Omnibus data set based on the microarray analysis. The expression levels of lncRNA NEAT1, miR-139-5p, and CDK6 in glioma cells and tissues were examined by quantitative reverse transcription polymerase chain reaction, and the protein level of CDK6 in glioma cells was determined by western blot and immunohistochemistry. Glioma cell viability, cell cycle, and apoptosis were detected by 3-(4,5-Dimethylthiazol-2-yl)-2,5-diphenyltetrazoliumbromide (MTT) and flow cytometry, respectively, whereas cell invasion and migration were analyzed by transwell assay. The target relationships among NEAT1, miR-139-5p, and CDK6 were confirmed by dual-luciferase reporter gene assay. The effects of lncRNA NEAT1 on tumor growth were further testified through glioma xenografts in nude mice.
Results: LncRNA NEAT1 and CDK6 were highly expressed in glioma tissues and cells, whereas miR-139-5p was lowly expressed. There were target relationships and correlations on expressions between miR-139-5p and NEAT1/ CDK6. NEAT1 and CDK6 could promote cell proliferation and metastasis of glioma cells and impeded cell apoptosis, whereas miR-139-5p exerted suppressive effects on the biological functions of glioma cells. NEAT1 regulated CDK6 to affect glioma growth through sponging miR-139-5p.
Conclusions: LncRNA NEAT1 promotes cell proliferation, invasion, and migration of glioma through regulating miR-139-5p/CDK6 pathway.
1 INTRODUCTION
Glioma is one of the most common and aggressive malignant tumors in adult brain with poor prognosis and high mortality rate (Chien et al., 2015; Khan & Ehtesham, 2015). The prognostic outcome of glioblastoma patients remains poorer, with a median survival of only 15 months (Stupp et al., 2005). Although some common therapies, such as surgery, radiotherapy and chemotherapy, can be used for the treatment of glioma, the recurrence rate remains high (Perry & Wesseling, 2016). It has been reported that glioblastoma (WHO grade IV) accounts for 50% of all the updated cases of malignant central nervous system (CNS) tumors (Reulen et al., 2015). Relapse and tumor metastasis are regarded as the pivotal causes of the poor prognosis of glioma. Therefore, it is imperative for the development of the effective therapy to understand the underlying molecular mechanisms of glioma.
Long noncoding RNAs (lncRNAs), endogenous cellular RNAs transcripts longer than 200 nucleotides (Qi & Du, 2013), have been involved in a wide range of molecular functions, including regulation of selective splicing, RNA metabolism and chromatin remodeling as well as cell proliferation and metastasis (Qi & Du, 2013). Although lncRNAs are different from endogenous small RNAs like microRNAs in length, function, and structure, there existed some relationships between these RNA classes. So far, increasing evidence has indicated that aberrant microRNA expression plays an important role in human glioblastoma (Calin & Croce, 2006). However, lncRNA-miRNA network remains unclear in glioma and needs to be further elucidated.
Among these lncRNAs, nuclear enriched abundant transcript 1 (NEAT1) has been considered to be a crucial regulator in various types of cancers. NEAT1 expression level has been demonstrated to be associated with the pathologic grade in many kinds of cancer, such as colorectal carcinoma (Li, Li et al., 2015), prostate cancer, esophageal squamous cell carcinoma (ESCC; Chen, Kong, Ma, Gao, & Feng, 2015) and malignant glioma (Chakravarty et al., 2014). Moreover, NEAT1 knockdown was also found to be related to cell apoptosis in B-cell lymphadenoma (Blume et al., 2015) and laryngeal squamous cell carcinoma (Wang et al., 2016). For instance, Liu et al. (2015) disclosed that knockdown of NEAT1 could suppress cell proliferation of glioma in vitro. Nonetheless, the studies related to NEAT1 function in glioma and target relationships between NEAT1 and some miRNAs were still limited. The role NEAT1 in glioma remains to be further investigated.
MicroRNA-139 (miR-139) was reported to inhibit cell proliferation and induce cell apoptosis of glioma (Wong et al., 2011). Besides, miR-139-5p was revealed to act as a tumor inhibitor in glioblastoma multiforme (GBM; Yue et al., 2015). A previous report has demonstrated that miR-139 acted as a favorable factor against glioma progression and uncovered a novel regulatory mechanism (Wang et al., 2017). MiR-139-5p was also identified to be significantly downregulated in GBM and could suppress glioma cell proliferation by targeting ELTD1 and regulating cell cycle (Dai, Wang, Li, & Cao, 2015).
CDK6 is a messenger RNA (mRNA) involved in the regulation of tumor cell proliferation, cell apoptosis, and cell cycle progression (Malumbres, 2014). Some previous studies also revealed that the expression of CDK6 protein was upregulated in glioma tissues and cells (Costello et al., 1997). Li, Lei et al. (2015) suggested that H19 derived miR-675 may regulate giloma cell proliferation and migration through CDK6, and predict a poor prognosis of glioma patients. Moreover, NEAT1 knockdown in the CD133+ U87 cells resulted in decreased colony formation, increased G1 cell cycle arrest and apoptosis which accompanied by inactivation of CDK6 protein (Yang, Xiao, Du, Huang, & Du, 2017).
In the current study, we investigated the function of NEAT1 in glioma and explore a novel and significant therapeutic method for the glioma treatment. We found that NEAT1 promoted cell proliferation, invasion, and migration of glioma through regulating miR-139-5p/CDK6. NEAT1/miR-139-5p/CDK6 axis may provide a novel therapeutic opportunity for developing a better treatment of glioma patients.
2 MATERIALS AND METHODS
2.1 Human tissue samples
A total of 78 pairs of glioma tissues and adjacent tissues were collected from 78 glioma patients who were undergoing surgical treatment at the Affiliated Hospital of Xuzhou Medical University during March 2012 to December 2013. Pathological examination was conducted to confirm the disease. All the patients were received surgery, and without radiation treatment or chemotherapy. Specimens obtained distant from the tumor at least 3 cm were used as adjacent tissue specimens. Tumor tissue specimens were diagnosed by pathological examination. All experiments were approved by the local Ethics Committee of the Affiliated Hospital of Xuzhou Medical University. Informed consent was obtained from all patients in the current study.
2.2 Microarray analysis
Microarray data set was obtained from Gene Expression Omnibus database (http://www.ncbi.nlm.nih.gov/geo, accession number GSE4290). The data set GSE4290 includes 23 nontumor samples and 81 glioblastoma samples. Affymetrix Human Genome U133 Plus 2.0 Array was used for analysis. Differentially expressed lncRNAs and mRNAs were identified using a t test (p < 0.05) combined with fold change (FC; log2 (FC) > 2 for upregulated lncRNAs and mRNAs, and log2 (FC) < −2 for downregulated lncRNAs and mRNAs). These differentially expressed lncRNAs was visualized by a heat map and volcano analysis using R (https://www.r-project.org/).
2.3 Cell culture and cell transfection
Glioma cell lines U251, SHG-44, TJ905 and human astrocyte cell line HA were obtained from BeNa Culture Collection (Shanghai, China). HEK-293T cells were purchased from the stem cell bank of Chinese Academy of Sciences. The glioma cell lines U251, SHG-44, and TJ905 and human astrocyte cell line HA (BeNa Culture Collection) were cultured in high glucose Dulbecco's modified Eagle medium (DMEM) supplemented with 10% fetal bovine serum (FBS; HyClone, Logan, UT) and 1% penicillin-streptomycin (HyClone). All the cells were seeded in the 24-well plates and incubated at 37°C in the humidified incubators with 5% CO2. MiR-139-5p mimics (50 nM; GenePharma, Shanghai, China) were transiently transfected into glioblastoma cells using Lipofectamine 2000 (Invitrogen, Carlsbad, CA) and negative control (NC) (50 nM; GenePharma, Shanghai, China) group was transfected with meaningless sequences. LncRNA transfection was divided into NC (50 nM) group, si-NEAT1#1 (50 nM) group (the sequence was 5′-GGAGGAGTCAGGAGGAATA-3′) and si-NEAT1#2 (50 nM) group (the sequence was 5′-GATCCCTAAGCTGTAGAACAT-3′). The CDK6-expressing vector (1 μg, pCMV-CDK6) was constructed (GenePharma) and transfected to overexpress CDK6 mRNA expression level. Medium was replaced after 24 hr and cell culture then continued. Cell transfection efficiency was detected after 24-hr transfection.
2.4 qRT-PCR
Total RNA of tissue samples or cell samples was extracted using Trizol reagent (Invitrogen). Complementary DNA (cDNA) was reverse transcribed according to the manufacturer's instructions. MiR-139-5p was tested using miRNAs Qper Quantitation Kit (Invitrogen), mRNA CDK6 and lncRNA NEAT1 were tested using RT-PCR Kit (Invitrogen), mRNAs and lncRNAs were normalized using GAPDH and miRNAs were normalized using U6. Primers were listed in Table 1. Data were analyzed by StepOne software after reaction. The 2−ΔΔCt method was adopted and applied to calculate the relative expression.
| Primer | Sequence (5′–3′) | |
|---|---|---|
| miR-139-5p (Accession: NR_029603.1) | Forward | 5′-TGGAGACGCGGCCCTGTT-3′ |
| Reverse | 5′-TCTACAGTGCACGTGTCT-3′ | |
| U6 | Forward | 5′-CTCGCTTCGGCAGCACATA-3′ |
| Reverse | 5′-AACGATTCACGAATTTGCGT-3′ | |
| CDK6 (Accession: NM_001145306.1) | Forward | 5′-GCGCCTATGGGAAGGTGTTC-3′ |
| Reverse | 5′-TTGGGGTGCTCGAAGGTCT-3′ | |
| NEAT1 (Accession: NR_131012.1) | Forward | 5′-GUCUGUGUGGAAGGAGGAATT-3′ |
| Reverse | 5′-UUCCUCCUUCCACACAGACTT-3′ | |
| GAPDH | Forward | 5′-GAAGGTGAAGGTCGGAGTC-3′ |
| Reverse | 5′-GAAGATGGTGATGGGATTTC-3′ |
- Note. NEAT1: nuclear enriched abundant transcript 1; RT-qPCR: reverse transcription quantitative polymerase chain reaction.
2.5 Western blot
Cells were collected in centrifuge tubes after transfection and washed twice by phosphate buffered solution (PBS) equilibrium liquid. Denatured protein was electrophoresed on an 8%–10% sodium dodecyl sulfate polyacrylamide gel electrophoresis and transferred to nitrocellulose membrane. The membrane was blocked in 5% nonfat milk and incubated with diluted primary antibodies at 4°C overnight followed by incubation for 2 hr at room temperature with a secondary antibody. Immunoblots were visualized by enhanced chemiluminescence (ECL kit, Santa Cruz Biotechnology, CA). And the relative integrated density values were calculated by Quantity One Software (Bio-Rad, Hercules, CA). The primary antibody was rabbit monoclonal to CDK6 (1:50000, #ab124821; Cambridge, MA), and the secondary antibody was goat anti-rabbit IgG H&L (HRP; 1:2000, #ab6721, Cambridge, MA, USA).
2.6 Immunohistochemistry
Tumor tissue samples were fixed in 4% paraformaldehyde, and then were dehydrated, embedded in paraffin. Serial 4 μm thick sections were deparaffinaged by xylol, rehydrated, and treated with peroxide in 100% methanol for 30 min to inhibit endogenous peroxidase activity. Slides were heated for antigen retrieval in 10 mM of sodium citrate (pH = 6.0). Endogenous peroxidase activity was blocked by 0.3% hydrogen peroxide solution. Sections were washed with PBS (pH = 7.4) again and incubated in 5% bovine serum albumin (Sigma, St. Louis, MO) for 30 min to block nonspecific antibody binding. The primary antibody discussed above (1:250) was incubated at 4°C overnight. Secondary antibody goat anti-rabbit IgG H&L (HRP; 1:1000, #ab6721, Cambridge, MA) were incubated after being washed with PBS. 3,3′-diaminobenzidine (DAB) (Beyotime Institute of Biotechnology, Jiangsu, China) systems were used for detection and hematoxylin was used to stain. OLYMPUS BX-41 microscope (Olympus, Center Valley, PA) was used to observe.
2.7 MTT assay
Cells were seeded into 96-well culture plates and then added with MTT kit (20 μl, 5 mg/ml; Sigma) to incubate for 4 hr. The reaction was terminated by removal of the supernatant and addition of 100 μl dimethyl sulfoxide (DMSO). The optical density (OD) value of each well was measured at 490 nm.
2.8 Cell cycle analysis by flow cytometry
Cell cycle was tested by cell cycle kit (KeyGen, Nanjing, China) according to the manufacturer's instructions. Cells were washed with cold PBS and collected after centrifuging for 5 min with 1000 rpm. Cells were fixed with 75% ethanol overnight at 4°C in the fridge and washed twice with PBS. Then the cells were incubated with 100 μl RnaseA for 30 min at room temperature in the dark. Flow cytometry was used for test after cells were added 50 μl PI and kept in the dark for 1 hr.
2.9 Cell apoptosis assay by flow cytometry
Apoptotic cells were tested by apoptosis detection kit (KeyGen, Nanjing, China) according to the manufacturer's instructions. Cells under log phase were obtained. The group only added with Lipofectamine 3000 reagent (Invitrogen) was used as blank control group. 400 μl binding buffer was used to resuspend cells after cells were collected. Cells were added with isometric Annexin V-FITC and propidium iodide (PI; 3–5 μl) and incubated for 10–15 min at room temperature in the dark. Cells which had no obvious cell aggregates were tested using the flow cytometry and analyzed by Cell Quest software.
2.10 Invasion and migration ability by transwell assay
All the reagents and equipment were put on the ice to precool. Transwell chambers were put in 24-well plate and smeared with 50 μl (0.2 μg/μl) Matrigel (BD Biosciences, Franklin Lakes, NJ) and then incubated for 15 min at 37°C. Serum-free medium was used to dilute cells at a density of 2.5 × 10⁴ cells/ml after digesting, centrifuging and counting cells. Cell suspension was seeded in the upper chamber 200 μl/well. 500 μl culture medium containing 10% FBS was seeded in the lower chamber. The cells were fixed with paraformaldehyde and stained with crystal violet for 15 min. The noninvasive cells were erased with cotton swabs. After drying out, the cells that invaded through the membrane and stuck to the lower surface of the membrane were counted in four random fields (×200) under a light microscope.
Cell migration assay was basically the same as invasion assay discussed above. However, transwell chamber need not to be coated with Matrigel. Besides, the number of cells seeded in the chamber was different. The density of U251 cells in cell migration assay was 1.5 × 10⁵ cells/well.
2.11 Dual-luciferase reporter assay
CDK6 3′untranslated region (UTR) and NEAT1 cDNA were amplified by PCR and CDK6 3′UTR segments and NEAT1 cDNA fragment were obtained and separated by gel electrophoresis. CDK6 3′UTR mutant vector and NEAT1 mutant vector were structured. Finally, restriction analysis and sequencing were performed to verify recombinant plasmids. Plasmid extraction was performed on CDK6/NEAT1 3 'UTR dual-luciferase reporter. Plasmid DNA (0.2 μg) was mixed with FugeneHD (0.3 μl; Roche Applied Science, Mannheim, Germany). Each group had three wells and NC group was set. 0.15 μg sensor reporter genes were diluted by 30 μl Opti-MEM (Life Technologies, Gaithersburg, MD) and mixed with 0.9 μl FugeneHD and then placed at room temperature for 15 min. Into each well, 15 μl of the above mixture was added. Cells were cultivated and transfected for 48 hr. Lysis buffer was diluted by double distilled water and added into each well. Lysis buffer centrifugation sedimentation was collected after 1-hr shaking. Firefly luciferase and sea cucumber luciferase substrate were added into the sediment. ELIASA was used to detect fluorescence intensity, and then analytical data were recorded.
2.12 Xenograft model
All the experiments were carried out with the approval of animal care and Committee of the Affiliated Hospital of Xuzhou Medical University. The precipitation of U251 cells at logarithmic phase were sustained after conventional digestion and centrifugation and washed three times with PBS buffer solution. The cells were resuspended using DMEM medium (5 × 10⁷/ml). Four-week-old BALB/c nude mice were selected and cultured in specific pathogen-free (SPF) level environment. The glioma cells were subcutaneously injected into the left/right flanks of the mice (2 × 10⁶ cells/mouse). The diameters of the tumors were measured every 3–5 days after subcutaneous injection of the glioma cells, and the tumor volumes were estimated. After 5–6 weeks, mice were killed and tumor growth was photographed. Volumes and weights of tumors separated from subcutaneous tissues were recorded.
2.13 Statistical analysis
Data were analyzed using GraphPad Prism 6.0 software (GraphPad Software Inc., CA), and were presented as mean ± standard deviation. Difference between two groups was compared using Student's t test. The difference among three groups and above was estimated using one-way analysis of variance. All experiments were repeated at least three times. p < 0.05 was considered to be statistically significant.
3 RESULTS
3.1 NEAT1 was high expressed in glioma tissues and cells
According to the microarray analysis, we found that there existed 71 high-expressed lncRNAs and 92 low-expressed lncRNAs in glioma tissues (Figure 1a). Of all these lncRNAs, lncRNA NEAT1 was significantly upregulated, with an average increase of 2.2 times (adj. p. Val = 6.99E-13). We respectively selected the top 10 lncRNAs which was the most significantly upregulated or downregulated as shown in Figure 1b. Furthermore, quantitative RT-PCR (qRT-PCR) also revealed that NEAT1 presented a considerably higher expression in glioma tissues compared with the adjacent tissues (p < 0.01; Figure 1c). Meanwhile, the endogenous expressions of NEAT1 in human astrocytes cell line HA and glioma cell lines U251, TJ905, SHG-44 were tested by qRT-PCR. Compared with that in human astrocytes HA, the expression of NEAT1 was remarkably higher in glioma cell lines (p < 0.01), especially in U251 (p < 0.001; Figure 1d). Therefore, U251 glioma cell line was chosen to perform the subsequent experiments.
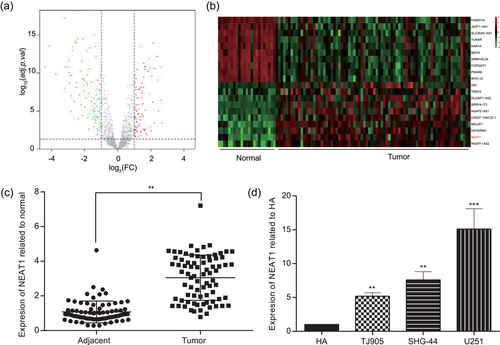
NEAT1 was high expressed in glioma tissues and cells. (a) Aberrant expression lncRNAs in glioma tissues were reflected by the volcano plot. (b) The top 10 high-expressed lncRNAs and 10 low-expressed lncRNAs were shown by the heat map. (c) NEAT1 expression level was higher in glioma tissues than in adjacent tissues tested by qRT-PCR. (d) NEAT1 expression was significantly higher in glioma cell lines TJ905, SHG-44, and U251 than that in human astrocytes cell line HA. All data was represented as mean ± standard deviation from triplicate dependent experiments. **p < 0.01, ***p < 0.001, compared with adjacent tissues group. lncRNA: long noncoding RNA; NEAT1: nuclear enriched abundant transcript 1; qRT-PCR: quantitative reverse transcription polymerase chain reaction [Color figure can be viewed at wileyonlinelibrary.com]
3.2 NEAT1 promoted cell proliferation, invasion, and migration of glioma and inhibited cell apoptosis
NEAT1 expression of U251 cells was tested by qRT-PCR to verify the transfection efficiency. QRT-PCR result displayed that in the U251 cell line, NEAT1 expression was dramatically downregulated in both si-NEAT1#1 and si-NEAT1#2 groups compared with in NC group (p < 0.05; Figure 2a). NEAT1 expression had the similar trend in the SHG-44 cell line (p < 0.05; Figure 2c, Supporting Information Table S1). Furthermore, MTT assay also indicated that the cell viability in si-NEAT1#1 group and si-NEAT1#2 group was considerably lower than that in NC group since the second day, suggesting NEAT1 knockdown could repress U251 glioma cell proliferation ability (p < 0.05; Figure 2b). Both si-NEAT1#1 group and si-NEAT1#2 had parallel inhibitory effects on cell viability (p < 0.05; Figure 2d).
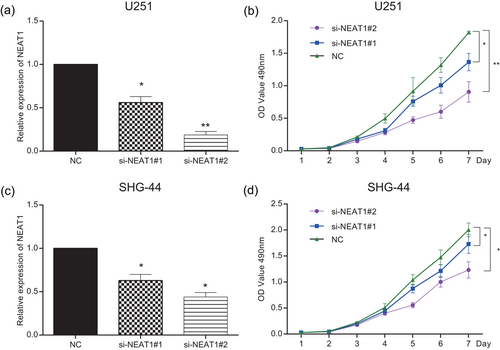
NEAT1 promoted cell proliferation of glioma. (a,c) NEAT1 expression of the si-NEAT1#1 and si-NEAT1#2 groups was lower than that of the NC group in the U251 and SHG-44 cell lines. (b,d) Cell proliferation activity of U251 and SHG-44 cells transfected with si-NEAT1#1 and si-NEAT1#2 was lower than the NC group determined by MTT. All data were represented as mean ± standard deviation from triplicate dependent experiments. *p < 0.05, **p < 0.01, compared with the NC group. MTT: 3-(4,5-Dimethylthiazol-2-yl)-2,5-diphenyltetrazoliumbromide; NC: negative control; NEAT1: nuclear enriched abundant transcript 1 [Color figure can be viewed at wileyonlinelibrary.com]
In addition, U251 and SHG-44 cell cycle and apoptosis condition were analyzed by flow cytometry assay. Compared with NC group, the proportion of cells of the S phase in both si-NEAT1#1 and si-NEAT1#2 groups remarkably decreased, whereas the proportion of cells of the G0/G1 phase increased (p < 0.05; Figure 3a). Furthermore, we found that the cell apoptosis was significantly enhanced after NEAT1 knockdown in comparison with NC group (p < 0.01; Figure 3b). In invasion and migration experiments, the number of U251 cells and SHG-44 cells in si-NEAT1 group was obviously fewer than in NC group (p < 0.05; Figure 4a,b). All the above results indicated that downregulation of NEAT1 could inhibit U251 cells and SHG-44 cells proliferation, invasion and migration and promote cell apoptosis. Because si-NEAT1#2 had better inhibitory effects and U251 cell line had more obvious differences, si-NEAT1#2 and U251 cell line were chosen for the subsequent experiments.
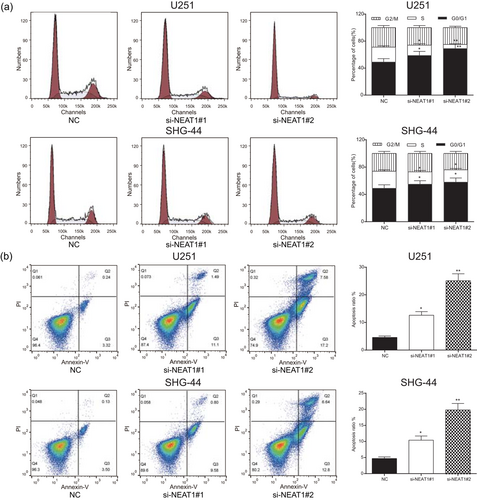
NEAT1 affected cell cycle and apoptosis of glioma cells. (a) Annexin V/PI suggested the number of cells in G0/G phase of the si-NEAT1#1 and si-NEAT1#2 was significantly more than that in the NC group. (b) Flow cytometry suggested apoptotic cells of the si-NEAT1#1 and si-NEAT1#2 groups were significantly more than the NC group. All data was represented as mean ± standard deviation from triplicate dependent experiments. *p < 0.05, **p < 0.01, compared with the NC group. NC: negative control; NEAT1: nuclear enriched abundant transcript 1; PI: propidium iodide [Color figure can be viewed at wileyonlinelibrary.com]
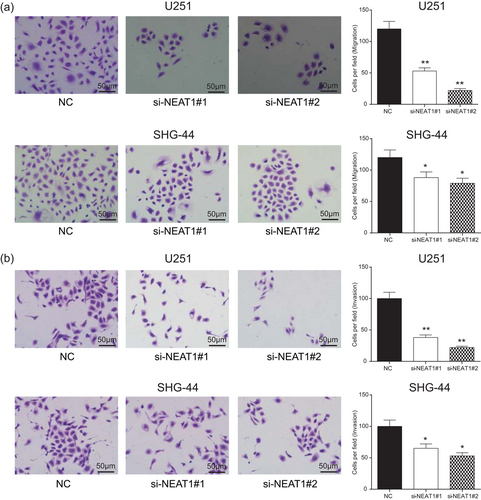
NEAT1 promoted cell invasion and migration of glioma and inhibited cell apoptosis. (a) Transwell migration assay suggested migrated cells of the si-NEAT1 group were significantly fewer than the NC group (scale bar = 50 μm). (b) Transwell invasion assay suggested invaded cells of the si-NEAT1 group were significantly fewer than the NC group (scale bar = 50 μm). All data were represented as mean ± standard deviation from triplicate dependent experiments. *p < 0.05, **p < 0.01, compared with the NC group. NC: negative control; NEAT1: nuclear enriched abundant transcript 1 [Color figure can be viewed at wileyonlinelibrary.com]
3.3 miR-139-5p was the target of lncRNA NEAT1
QRT-PCR results indicated that the expression of miR-139-5p in glioma tissues was significantly lower than that in adjacent normal tissues (p < 0.05; Figure 5a, Supporting Information Table S1). As presented in Figure 5b (Supporting Information Table S1), the expression of miR-139-5p was negatively correlated with the expression of NEAT1 (p < 0.05). After silencing NEAT1 or overexpressed miR-139-5p, the expression of NEAT1 in si-NEAT1 group was dramatically downregulated in contrast to NC group (p < 0.01; Figure 5c). When overexpressed miR-139-5p, the expression of NEAT1 had no obvious difference compared with the NC group (p > 0.05; Figure 5c). Differentially expression levels of miR-139-5p in U251 cells transfected with si-NEAT1 or miR-139-5p mimics were shown in Figure 5d. It was reflected that the expression of miR-139-5p was significantly upregulated in both si-NEAT1 group and miR-139-5p mimics group contrast to the NC group (p < 0.05). These results suggested that NEAT1 downregulated the expression of miR-139-5p. The binding relationship between NEAT1 and miR-139-5p was predicted through bioinformatics analysis (Figure 5e). After cotransfection of NEAT1-wt and miR-139-5p mimics into HEK-293T cells, the luciferase ratio remarkably declined (P < 0.01; Figure 5f), whereas there was no significant difference between scrambles group and NEAT1-mut group after cotransfection of NEAT1-mut and miR-139-5p mimics (p > 0.05).
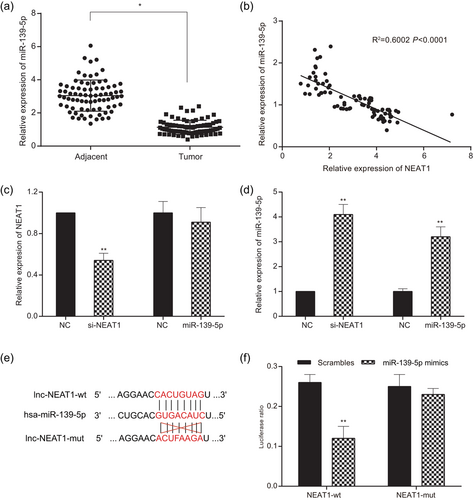
MiR-139-5p was the target of lncRNA NEAT1. (a) The expression of miR-139-5p in glioma tissues was lower than that in adjacent tissues. (b) The correlation of NEAT1 and miR-139-5p was determined by Pearson correlation analysis. The expression of miR-139-5p was negatively correlated with the expression of NEAT1. (c) The expression of NEAT1 decreased after glioma cells transfected with si-NEAT1, whereas it had no obvious difference in the miR-139-5p group compared with the NC group. The expression of miR-139-5p increased after glioma cells transfected with si-NEAT1 and miR-139-5p. (d) The expression of miR-139-5p increased after transfecting miR-139-5p mimics, and there was no statistical difference in the expression of NEAT1. (e) Bioinformatics predicted target relationship between miR-139-5 and NEAT1. (f) Luciferase reporter assay strongly suggested miR-139-5p was the target of NEAT1. All data was represented as mean ± standard deviation from triplicate dependent experiments. *p < 0.05, **p < 0.01, compared with the NC group. lncRNA: long noncoding RNA; NC: negative control; NEAT1: nuclear enriched abundant transcript 1 [Color figure can be viewed at wileyonlinelibrary.com]
3.4 miR-139-5p suppressed cell proliferation, invasion, and migration of glioma and accelerated cell apoptosis
MiR-139-5p expression of U251 cells was tested by qRT-PCR to verify the transfection efficiency. As displayed in Figure 6a, miR-139-5p mimics considerably upregulated miR-139-5p expression, leading to overexpression of miR-139-5p (p < 0.01). MTT assay revealed that the viability of U251 cells transfected with miR-139-5p mimics was remarkably repressed since the second day, in comparison with NC group (p < 0.01, Figure 6b). The proportion of the S phase dramatically reduced whereas the proportion of G0/G1 phase increased in the miR-139-5p group compared with that in the NC group (p < 0.01; Figure 6c). Furthermore, the flow cytometry revealed that the apoptosis rate in the miR-139-5p group considerably increased compared with that in the NC group (p < 0.05; Figure 6d).
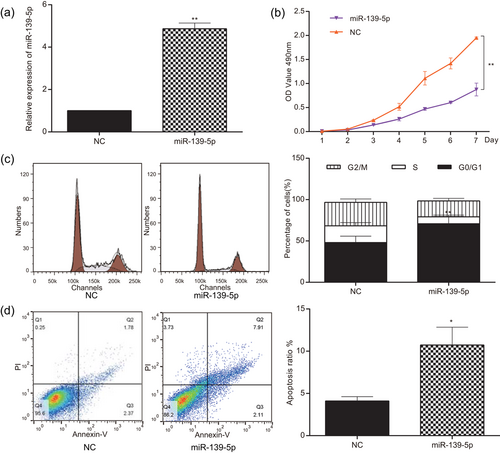
MiR-139-5p suppressed cell proliferation of glioma and accelerated cell apoptosis. (a) miR-139-5p expression of the miR-139-5p group was higher than that of the NC group. (b) Cell viability of U251 cells in the miR-139-5p group was lower than that in the NC group. (c) Cells of G0/G1 stage in the miR-139-5p group were significantly more than that in the NC group detected by Annexin V/PI. (d) The apoptosis ratio of the miR-139-5p group was significantly higher than that of the NC group detected by flow cytometry. All data was represented as mean ± standard deviation from triplicate dependent experiments. *p < 0.05, **P < 0.01, compared with the NC group. NC: negative control; PI: propidium iodide [Color figure can be viewed at wileyonlinelibrary.com]
Additionally, the transwell results illustrated that miR-139-5p overexpression exerted suppressive influence on glioma cell migration and invasion (Figure 7a,b; p < 0.01). Taken together, miR-139-5p inhibited glioma cells proliferation, invasion and migration and promoted cell apoptosis.
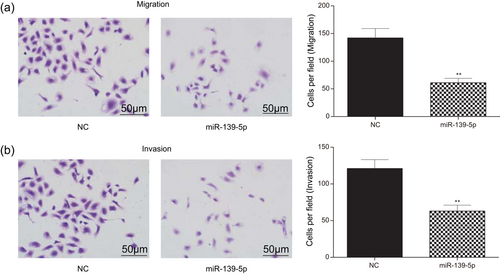
MiR-139-5p suppressed cell invasion and migration of glioma. (a) Transwell migration experiment measured that the migrated cells in the miR-139-5p group were significantly fewer than that in the NC group (scale bar = 50 μm). (b) Transwell invasion experiment measured that the invaded cells in the miR-139-5p group were significantly fewer than that in the NC group (scale bar = 50 μm). All data was represented as mean ± standard deviation from triplicate dependent experiments. **p < 0.01, compared with the NC group. NC: negative control [Color figure can be viewed at wileyonlinelibrary.com]
3.5 CDK6 was highly expressed in glioma tissues and cells
Microarray analysis revealed that there were 2,002 mRNAs with high expression and 2,348 mRNAs with low expression in glioma tissues compared to adjacent tissues. CDK6 was one of the highly expressed mRNAs. Compared with adjacent tissues, CDK6 was significantly upregulated in glioma tissues (adj.p.Val = 1.65E-07; Figure 8a,b). The difference in expression of CDK6 mRNA in glioma tissues and adjacent normal tissues was also detected by qRT-PCR. The expression of CDK6 in glioma tissues was significantly higher than that in adjacent tissues (p < 0.05; Figure 8d, Supporting Information Table S1). The immunohistochemistry results suggested that the expression of CDK6 protein was higher in glioma tissues than that in adjacent tissues (p < 0.05, Figure 8c). Pearson's correlation coefficient analysis indicated that miR-139-5p was negatively correlated with CDK6 in terms of expression (p < 0.05; Figure 8e, Supporting Information Table S1).
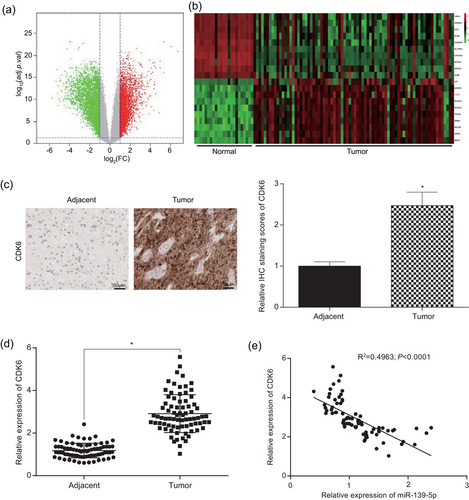
CDK6 was high expressed in glioma tissues and cells. (a) Aberrant expression mRNAs in glioma tissues were shown by the volcano plot. (b) Expression levels of some mRNAs were shown by the heat map. (c) Immunohistochemistry measured that CDK6 protein was high expressed in glioma tissues (scale bar = 50 μm). (d) qRT-PCR reflected that the expression of CDK6 in glioma tissues was higher than that in adjacent tissues. (e) The expression of CDK6 and miR-139-5p was negatively correlated. All data was represented as mean ± standard deviation from triplicate dependent experiments. *p < 0.05, compared with adjacent tissues group. mRNA: messenger RNA; qRT-PCR: quantitative reverse transcription polymerase chain reaction [Color figure can be viewed at wileyonlinelibrary.com]
3.6 CDK6 was the target of miR-139-5p
Bioinformatics analysis was used to predict the target relationship between CDK6 and miR-139-5p. The binding sites were shown in Figure 9a. Dual-Luciferase reporter gene assay showed that there were significant differences between the miR-139-5p group and the NC group in luciferase activity when HEK-293T cells were transfected with CDK6-wt (p < 0.05; Figure 9b). However, there was no significant difference between the miR-139-5p group and the NC group after the mutation of CDK6 3′UTR (p > 0.05). The mRNA expression of CDK6 in glioma cells U251 detected by real-time quantitative PCR was shown in Figure 9c (p < 0.01). Compared with the NC group, the mRNA expression of CDK6 in the miR-139-5p group significantly decreased after transfected with miR-139-5p mimics, suggesting miR-139-5p could regulate the CDK6 mRNA expression. The expression levels of CDK6 protein both in the miR-139-5p group and the NC group were further determined by western blot, which revealed that the miR-139-5p overexpression could significantly down-regulate the expression level of CDK6 protein in U251 cells (p < 0.01; Figure 9d).
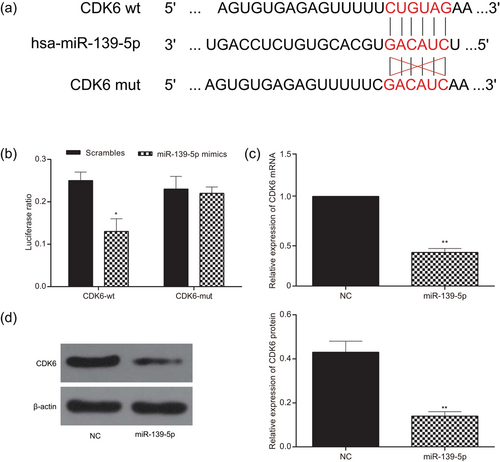
CDK6 was the target of miR-139-5p. (a) Bioinformatics predicted CDK6 was the target of miR-139-5p. (b) The luciferase ratio was significantly different between the miR-139-5p group and the NC control group in luciferase activity when cells were transfected with CDK6-wt. (c) The expression of CDK6 was lower in the miR-139-5p group than in the NC group detected by real-time quantitative PCR. (d) The upregulation of miR-139-5p could significantly down-regulate the expression of CDK6 protein level in U251 cells. All data was represented as mean ± standard deviation from triplicate dependent experiments. *p < 0.05, **p < 0.01, compared with the NC group. NC: negative control; PCR: polymerase chain reaction [Color figure can be viewed at wileyonlinelibrary.com]
3.7 NEAT1 and CDK6 promoted cell proliferation, invasion, and migration of glioma and suppressed cell apoptosis
The expression of CDK6 was positively correlated with NEAT1 expression in U251 cells (p < 0.01; Figure 10a, Supporting Information Table S1). The experiments were divided into four groups, NC group, si-NEAT1 group, CDK6 group, and si-NEAT1+CDK6 group, respectively. The results of MTT indicated that the cell viability after transfection with CDK6 was significantly strengthened, while silencing NEAT1 could considerably suppress cell proliferation ability (p < 0.05; Figure 10b). There was no significant difference between the si-NEAT1+CDK6 group and the NC group in terms of cell viability (p > 0.05). The cell cycle and apoptosis condition were detected by flow cytometry assay, of which the results displayed the glioma cells arrested at G0/G1 phase after transfection with CDK6 remarkably decreased, while NEAT1 knockdown could further induced cell cycle arrest in G0/G1 phase (p < 0.01; Figure 10c). For apoptosis condition, flow cytometry results exhibited that CDK6 mimics inhibited cell apoptosis, whereas NEAT1 knockdown exerted facilitative influence on cell apoptosis (p < 0.01; Figure 10d). There was no significant difference between si-NEAT1+CDK6 group and NC group (p < 0.05).
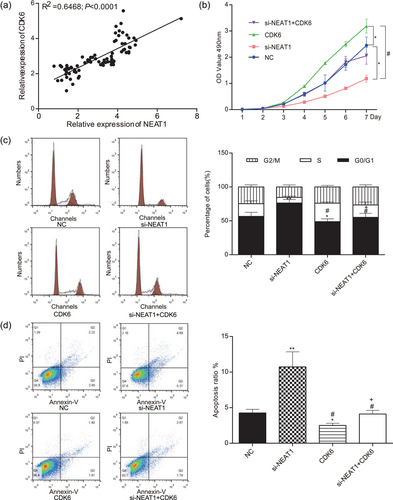
NEAT1 and CDK6 promoted cell proliferation of glioma and suppressed cell apoptosis. (a) The expression of CDK6 was positively correlated with the expression of NEAT1 in U251 cells. (b) U251 cells in the CDK6 group had the strongest cell viability detected by MTT. (c) CDK6 group had the fewest cells in the G0/G1 phase detected by flow cytometry. (d) U251 cells in the CDK6 group had the lowest apoptosis ratio detected by flow cytometry. All data were represented as mean ± standard deviation from triplicate dependent experiments. *p < 0.05, compared with the NC group; **p < 0.01, compared with the NC group; #p < 0.05, compared with the si-NEAT1 group; +p < 0.05, compared with CDK6 group. MTT: 3-(4,5-Dimethylthiazol-2-yl)-2,5-diphenyltetrazoliumbromide; NC: negative control; NEAT1: nuclear enriched abundant transcript 1 [Color figure can be viewed at wileyonlinelibrary.com]
In addition, the change of cell metastasis post-transfection was observed through transwell assay. The cell migration and invasion results both indicated that the number of migratory or invasive cells after silencing NEAT1 considerably decreased compared with the NC group, whereas upregulation of CDK6 expression contributed to cell mobility and invasiveness (p < 0.05; Figure 11a,b). Nonetheless, no significant difference was detected between the si-NEAT1+CDK6 group and the NC group (p > 0.05). These results strongly suggested that NEAT1 could regulate CDK6 to promote the invasion and migration of glioma cells.
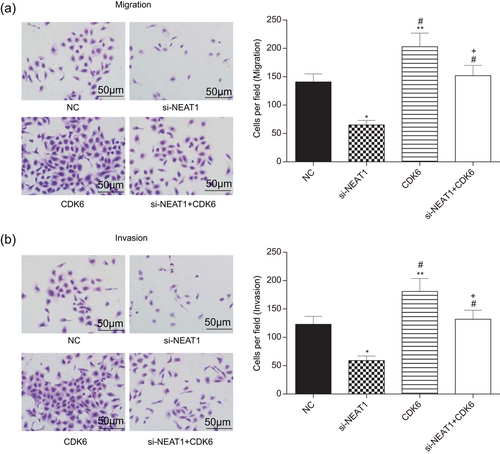
NEAT1 and CDK6 promoted cell invasion and migration. (a,b) The number of migrated and invaded cells in the si-NEAT1 group was the lowest, and the CDK6 group had the highest migrated and invaded cell number (scale bar = 50 μm). All data were represented as mean ± standard deviation from triplicate dependent experiments. *p < 0.05, compared with the NC group; **p < 0.01, compared with the NC group; #p < 0.05, compared with the si-NEAT1 group; +p < 0.05, compared with the CDK6 group. NC: negative control; NEAT1: nuclear enriched abundant transcript 1 [Color figure can be viewed at wileyonlinelibrary.com]
3.8 NEAT1 knockdown restrained glioma growth through regulating CDK6 in vivo
The tumors in mice of the four groups with U251 cells transfected with si-NEAT1, CDK6, si-NEAT1+CDK6 and NC were taken and measured respectively (Figure 12a). Nude mouse experiment results indicated that the tumor volume of mice in CDK6 group was significantly larger than that in the NC group, whereas that in si-NEAT1 group presented the opposite trend. Likewise, after transfection with si-NEAT1, the tumor weight of mice remarkably decreased, whereas that of mice transfected with CDK6 mimics significantly increased (p < 0.05; Figure 12b,c). The tumor volume and weight of si-NEAT1+CDK6 group were equivalent to that of NC group (p > 0.05). The tumor volume and weight of mice in the si-NEAT1 group were minimal compared with that in NC group. The NEAT1 expression in the tumor of si-NEAT1 and si-NEAT1+CDK6 groups was significantly reduced compared with the NC group (p < 0.05; Figure 12d). In addition, the expression of miR-139-5p in the si-NEAT1 group and si-NEAT1+CDK6 group was higher than that in the NC group (p < 0.05; Figure 12e). No obvious difference of the expression levels of NEAT1 and miR-139-5p between NC group and CDK6 group (p > 0.05; Figure 12d,e). Moreover, CDK6 expression of CDK6 group increased while that in the si-NEAT1 decreased (p < 0.05; Figure 12f). There was no remarkable difference between the NC group and si-NEAT1+CDK6 group (p > 0.05).
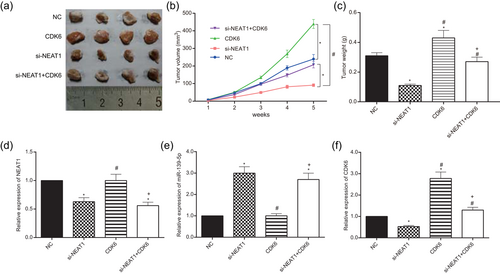
NEAT1 and CDK6 promoted the proliferation of glioma in vivo. (a) Tumor specimens from nude mice divided into four groups. (b) Tumor volumes from nude mice divided into four groups. (c) Tumor weights from nude mice divided into four groups. All data were represented as mean ± standard deviation from triplicate dependent experiments. *p < 0.05, compared with the NC group; #p < 0.05, compared with the si-NEAT1 group; +p < 0.05, compared with the CDK6 group. NC: negative control; NEAT1: nuclear enriched abundant transcript 1 [Color figure can be viewed at wileyonlinelibrary.com]
4 DISCUSSION
Glioma is a badly fatal disease and a crucial cause of death in patients with CNS tumors (Mannas, Lightner, Defrates, Pittman, & Villano, 2014). Glioma is symptomless in the early stage and mostly cannot be detected until widespread invasion into adjacent normal brain tissues (Brzozowska, Toruń, & Mazurkiewicz, 2015). In this study, we found that NEAT1 was highly expressed in the glioma tissues and cell lines. Knockdown of NEAT1 could inhibit the malignant biological functions of glioma cells. In addition, knockdown of NEAT1 could contribute to overexpression of miR-139-5p and regulate downstream gene CDK6 expression through sponging miR-139-5p. The further research suggested that miR-139-5p played a tumor-suppressive role by downregulating CDK6 in glioma cells. The in vivo study also identified that knockdown of NEAT1 curbed tumor growth in nude mice. Taken together, the NEAT1/miR-139-5p/CDK6 axis played an important role in regulating glioma cell proliferation, invasion, migration and apoptosis, which indicated a promising therapeutic target in glioma treatment.
It has been reported that NEAT1 played a significant role in sustaining the integrity of subnuclear paraspeckles (Clemson et al., 2009). Besides, NEAT1 is overexpressed in early-stage and metastatic breast cancer cells under hypoxia (Choudhry et al., 2015). NEAT1 also serves as a prognostic factor and promotes cell migration and invasion in ESCC (Chen et al., 2015). Moreover, NEAT1 modulates gene expression of prostate cancer by regulating the epigenetic landscape of target gene promoters to facilitate transcription (Chakravarty et al., 2014). In addition, the miR-449/NEAT1 axis plays an important role in lung cancer cells (You et al., 2014). In glioma, NEAT1 has been reported to be associated with larger tumor size and poor prognosis as well as the tumor malignant progression (He, Jiang, Ma, & Li, 2016; Zhen, Yun-Hui, Hong-Yu, Jun, & Yi-Long, 2016). Our findings provided reliable evidence for the oncogenic function of NEAT1 in glioma and further investigated the direct target of NEAT1.
In this study, we found that miR-139-5p was downregulated in glioma tissues and cell lines. It has also been reported in some previous studies about the low expression of miR-139-5p in some cancers. Recent study has showed that miR-139 inhibits proliferation and induces cell apoptosis in glioma via downregulation of Mcl-1 and upregulation of temozolomide (TMZ) (Li et al., 2013). Besides, miR-139-5p inhibits migration and invasion of GBM through targeting ZEB1 and ZEB2 (Yue et al., 2015). MiR-139 also functions as a tumor-inhibiting factor to repress glioma progression through targeting IGF-1 R, AMY-1, and PGC-1β (Wang et al., 2017). Aside from these, miR-139-5p can act as a tumor suppressor by targeting ELTD1 and regulating cell cycle in GBM (Dai et al., 2015). Emerging evidence has verified that lncRNAs might play a critical role in competing endogenous RNAs or function as a molecular sponge in regulating miRNAs (Karreth & Pandolfi, 2013). We predicted the miRNA binding site of NEAT1 based on bioinformatics analysis and identified that miR-139-5p was the target of NEAT1, and the expression of miR-139-5p significantly increased after knockdown of NEAT1 in glioma cell lines, indicating there was a negative correlation between these two factors. Additionally, the overexpression of miR-139-5p exerted tumor-suppressive influence on the migration, invasion and proliferation of glioma cells and accelerated cell apoptosis.
CDK6 is a member of a family of serine/threonine kinases involved in the control of cell cycle progression, interacting with cyclin D to phosphorylate the retinoblastoma protein during the G1/S transition (Malumbres, 2014). High expression of CDK6 protein in glioma has also been reported in other studies, and CDK6 is thought to be related to astrocytes tumorigenesis (Costello et al., 1997). In this study, the luciferase reporter assay verified that CDK6, which was upregulated in glioma cells, was the direct target of miR-139-5p. Moreover, our experiments results showed that knockdown of NEAT1 suppressed the CDK6 expression through upregulating miR-139-5p. It was suggested that CDK6 promoted the proliferation, migration and invasion of glioma cells and inhibited cell apoptosis.
There were certain limitations existed in the study. For instance, the small quantity of tissue samples made the results might not be completely convincing. But the NEAT1/miR-139-5p/CDK6 axis could still be regarded as a novel approach for glioma therapy.
The study found that the expression of miR-139-5p was negatively correlated with NEAT1 expression, whereas CDK6 was positively correlated with NEAT1 in terms of expression. MiR-139-5p was the target of NEAT1 and CDK6 was the target of miR-139-5p. Knockdown of NEAT1 repressed the expression of CDK6, inhibiting the proliferation and metastasis of glioma cells and promoting cell apoptosis. Therefore, the NEAT1/miR-139-5p/CDK6 axis might provide a useful therapeutic method for the glioma treatment.
ACKNOWLEDGMENTS
This study was supported by the Priority Academic Program Development of Jiangsu Higher Education Institutions (PAPD); the 2016 “333 Project” Award of Jiangsu Province, the 2013 “Qinglan Project” of the Young and Middle-aged Academic Leader of Jiangsu College and University, the National Natural Science Foundation of China (81571055, 81400902, 81271225, 31201039, 81171012, and 30950031), the Major Fundamental Research Program of the Natural Science Foundation of the Jiangsu Higher Education Institutions of China(13KJA180001), and grants from the Cultivate National Science Fund for Distinguished Young Scholars of Jiangsu Normal University.
CONFLICTS OF INTEREST
The authors confirm that there are no conflicts of interest.


