Retracted: TNF-α–TNFR signal pathway inhibits autophagy and promotes apoptosis of alveolar macrophages in coal worker's pneumoconiosis
Abstract
Objective: Exposure to coal dust causes the development of coal worker's pneumoconiosis (CWP), which is associated with accumulating macrophages in the lower respiratory tract. This study was performed to investigate the effect of tumor necrosis factor-α (TNF-α)–tumor necrosis factor receptor (TNFR) signal pathway on autophagy and apoptosis of alveolar macrophages (AMs) in CWP.
Methods: AMs from controls exposed to coal dust and CWP patients were collected, in which expressions of TNF-α and TNFR1 were determined. Autophagy was observed by transmission electron microscopy, and apoptosis by light microscope and using terminal deoxynucleotidyl transferase dUTP nick-end labeling staining. AMs in CWP patients were treated with TNF-α or anti-TNF-α antibody. Besides, expressions of autophagy marker proteins, apoptosis-related factors, FAS, caspase-8, and receptor-interacting serine–threonine-protein kinase 3 (RIPK3) were determined by western Blot. Activities of caspase-3 and caspase-8 were determined by a fluorescence kit. Flow cytometry was applied to measure the expression of TNFR1 on the surface of the AM.
Results: TNF-α expression and TNFR1 expression on the surface of AM, as well as autophagy and apoptotic index were significantly increased in AMs of CWP patients. In response to the treatment of TNF-α, TNF-α expression and TNFR1 expression on the surface of AM as well as LC3I expression were increased, autophagy was decreased, and LC3, LC3II, Beclin1 and B-cell lymphoma 2 expressions decreased, whereas FAS expression and activity and expression of caspase-3 and caspase-8 increased, and apoptotic index increased. Moreover, the situations were reversed with the treatment of anti-TNF-α antibody.
Conclusion: TNF-α–TNFR signal pathway was involved in the occurrence and development of CWP by activating FAS–caspase-8 and thus inhibiting autophagy while promoting apoptosis of AM.
1 INTRODUCTION
Pneumoconiosis is a systemic disease characterized by diffuse fibrosis in lung tissue during long-term inhalation of productive dusts in production process (Scheel, Krause, Haars, Schmitz, & Junker, 2012). It is one of the most serious occupational diseases endangering the occupational population in China (Chu et al., 2014). Despite years of attempts on dust control and great improvement achieved on dustproof, the incidence of pneumoconiosis is still increasing year by year (Mo, Wang, Au, & Su, 2014; M. Wang et al., 2011). Because the pathogenesis of pneumoconiosis remains to be fully elucidated, great difficulties have been posed to the prevention and treatment of pneumoconiosis (Artemoval et al., 2016; Cui, Hu, & Zhu, 2016). To investigate the pathogenesis of pneumoconiosis, especially to explore the early events of the disease, and to recognize the mechanism and regularity of its occurrence, it is of great importance to take prevention and control measures on pneumoconiosis.
Recent studies have shown that alveolar macrophage (AM) apoptosis may play an important role in the pathogenesis and development of pneumonia and pulmonary fibrosis (C. Chen et al., 2017; S. Chen et al., 2015; Larson-Casey, Deshane, Ryan, Thannickal, & Carter, 2016). Apoptosis is an active and physiological process through which some apoptotic genes interact with each other when a cell receives a signal or is stimulated by certain factors (Peng et al., 2015). Apoptosis is mainly achieved through three signal transduction pathways: The mitochondrial pathway, the endoplasmic reticulum pathway, and the membrane death receptor pathway (J. Wang et al., 2015). The death receptor on the cell surface belongs to the tumor necrosis factor receptor (TNFR) superfamily, which initiates apoptosis through the combination of receptor and ligand on cell surface (Kuester, Kemmerzehl, Dahms, Roeser, & Than, 2011). It mainly mediates apoptosis through three basic signal transduction pathways: Fas-ligand pathway, tumor necrosis factor-α (TNF-α)–TNFR pathway, and TRAILR–TRAIL pathway (Lin et al., 2011). It is thought that caspases, P53, B-cell lymphoma 2 (Bcl-2), and other apoptosis-regulating proteins are involved in the regulation process of apoptosis in pulmonary fibrosis (Siganaki et al., 2010). Therefore, blocking the apoptosis-related receptor of AM may be an effective measure for the prevention and treatment of pneumoconiosis.
The domestic and foreign scholars have paid much attention to the relationship between the above-mentioned signal transduction pathways and pulmonary diseases (Bellail & Hao, 2012; Nagamine et al., 2016; Przybyszewska et al., 2011). Less study is focused on the relationship between TNF-α–TNFR signal pathway and AM apoptosis in pulmonary diseases. We speculated that TNF-α–TNFR signal transduction pathway might be involved in the occurrence and development of pneumoconiosis by regulating autophagy and apoptosis of AM. Therefore, the current study was performed with the aim to investigate the effect and possible mechanism of TNF-α–TNFR signal pathway on autophagy and apoptosis of AM in coal worker's pneumoconiosis (CWP).
2 MATERIALS AND METHODS
2.1 Object of study
During June 2015 to February 2017, 32 male subjects exposed to coal dust and 58 CWP male patients who admitted in Beidaihe Occupational Disease Prevention and Treatment Hospital of The State Administration of Work Safety were selected in current study, respectively, as controls and cases. Inclusion criteria for subjects included in CWP group were as follows: (a) All subjects were diagnosed with pneumoconiosis by the local expert group (diagnostic criteria: GBZ 70-2009 diagnostic criteria of pneumoconiosis) and (b) no other lung diseases (such as pneumonia, lung cancer, active tuberculosis, etc.). Exclusion criteria were as follows: (a) Suffered from pneumoconiosis and other pulmonary complications, and with severe heart and lung disease and infectious diseases and (b) with serious heart, liver, and kidney diseases that could not undergo lung lavage. The research was approved by the ethics committee of our hospital and supervised by the ethics committee of our hospital. The subjects signed informed consents and at the same time had the right to know all details related to the experiment.
2.2 Isolation, purification, and cultivation of AMs
The subjects were subjected to massive whole lung lavage under general anesthesia. The bronchoalveolar lavage fluid of 3,000–4,000 ml was prepared by aseptic operation (filtration, centrifugation, and rinsing) and counted after being diluted. The cell mass concentration was obtained. The cell suspensions of the controls and CWP patients were taken, respectively (containing 5 × 10⁶), and added in 2 ml of Dulbecco's modified Eagle's medium solution (Gibco, Grand Island, NY) containing 10% fetal bovine serum (Hyclone, Logan, UT), followed by cultivation for 2 hr in a CO2 incubator (humidity of 84% and volume fraction of 5% CO2). Adherent cells represented purified AMs.
2.3 Cell grouping and corresponding treatment
Purified AM of CWP patients were divided into four groups (Scheel et al., 2012): Blank control group (Blank; without any treatment; Chu et al., 2014), phosphate-buffered saline (PBS) group (an equal amount of PBS was added to the culture medium; M. Wang et al., 2011), TNF-α–TNFR group (TNF-α; 10 μl of TNF-α with density of 50 μg/L was added to the culture medium; Mo et al., 2014), and anti-TNF-α–TNFR group (anti-TNF-α; 10 μl of anti-TNF-α antibody with density of 50 μg/L was added to the culture medium). TNF-α and anti-TNF-α antibodies were purchased from the Santa Crutz (CA).
2.4 Immunofluorescent staining
Cells were inoculated in sterile coverslips of a six-well plate, and coverslips were removed once cell attachment was observed, followed by PBS washing (5 min, three times). Then, 4% paraformaldehyde was fixed at room temperature for 30 min, followed by PBS washing (10 min, three times). Cells were then purified at room temperature with 0.2% Triton X-100 (Sigma-Aldrich, St. Louis, MO) for 30 min. After another PBS washing (10 min, three times), 5% bovine serum albumin (BSA) was used to terminate the reaction at room temperature for 1 hr. The antibody was diluted with 1% BSA (1:400), and 100 μl was dropped in the slide and placed in a wet box, 4℃ incubation for the night. LC3 antibody was purchased from NOVUS Company (Shanghai, China). After PBS washing (10 min, three times), 1% BSA was applied to dilute the secondary antibody (1:500), and 100 μl was dropped in the slide and incubated at room temperature for 1 hr avoiding light exposure. Subsequently, after cells were washed with PBS (10 min, three times), the nucleus was stained with 10 μg/ml of Hochest for 5 min. With another PBS washing (10 min, three times), the excitation wavelength was selected and observed by Olympus Fluoroview 1000 confocal laser scanning microscope (Olympus Corporation, Tokyo, Japan).
2.5 Transmission electron microscope observation
The cells were centrifuged into pea-sized cell masses, which were fixed with 2.5% cold glutaraldehyde and fixed with 1% osmium acid, gradient ethanol was dehydrated step by step, and EPON resin was embedded. The ultrathin section machine was used to slice the samples into 65 nm, and 2% uranium acetate and lead citrate staining were used for staining. A transmission electron microscope was used for observation and photograph.
2.6 General optical microscope observation
AM at the density of 1 × 10⁶ was collected for preparation of cell smears. Paraformaldehyde fixed cell for 30 min with a mass fraction of 4%. After AM was dried in the air, hematoxylin was used for staining for 10 min, followed by water washing, differentiated by hydrochloric alcohol for 1–2 s, 1% dilute ammonia to blue for 1–2 s, eosin staining for 5 min, and then, neutral gum was applied for sealing piece after drying. The morphology of AM was observed under a light microscope, six representative images of visual field were selected, 200 AMs were counted to calculate the apoptotic index (apoptotic AM accounted for the percentage of total AM, %). Criteria for determining apoptosis are as follows: Stage II, the cell volume decreased and the cell membrane collapsed, the apoptotic nucleus of stage II appeared crescent or broad bean shape changes; stage III, the apoptotic cell membrane ruptured and the cells disintegrated.
2.7 Quantitative real-time polymerase chain reaction (qRT-PCR) detection of messenger RNA (mRNA) expression levels of TNF-α and TNFR1
The total RNA of cells was extracted by TRIzol one-step method (Invitrogen, Carlsbad, CA), and the high quality RNA was confirmed by ultraviolet analysis and formalin-denatured electrophoresis. Then, 1 μg RNA was used to obtain complementary DNA using avian myeloblastosis virus reverse transcriptase. PCR primers were designed and synthesized by Invitrogen (Table 1), with glyceraldehyde 3-phosphate dehydrogenase as an internal reference. The PCR amplification conditions were as follows: Initial denaturation at 94℃ for 5 min, denaturation at 94℃ for 40 s, annealing at 60℃ for 40 s, and extension at 72℃ for 1 min, in a total of 40 cycles, followed by another extension at 72℃ for 10 min. The product was analyzed and verified by agarose gel electrophoresis. The threshold value was selected manually in the logarithmic amplification curve parallel rise of the lowest point to get the Ct value of each reaction tube (threshold cycle), and data were then analyzed using methods. expressed the ratio relation of the target genes between the experimental group and the control group, and the corresponding formula was shown as the following: ΔΔCt = [Ct (target gene) − Ct (reference gene)]experimental group − [Ct (target gene) − Ct (reference gene)]control group. The experiment was repeated three times and averaged.
| Gene | Sequences |
|---|---|
| TNF-α | F: 5′-CAGGCAGTCAGATCATCTTC-3′ |
| R: 5′-CTTGATGCCAGAGGAGGT-3′ | |
| TNFR1 | F: 5′-ACCAAGTGCCACAAAGGAACC-3′ |
| R: 5′-TACACACGGTGTTCTGTTTCTC-3′ | |
| GAPDH | F: 5′-CAAGTTCAACGGCACAGTCA-3′ |
| R: 5′-CCCCATTTGATGTTAGCGGG-3′ |
- Note. F: forward; GAPDH: glyceraldehyde 3-phosphate dehydrogenase; R: reverse; TNFR: tumor necrosis factor receptor; TNF-α: tumor necrosis factor-α.
2.8 Western blot detection of protein expressions of TNF-α, TNFR1, LC3I, LC3II, Beclin1, Bcl-2, caspase-3, FAS, caspase-8, and receptor-interacting serine–threonine-protein kinase 3 (RIPK3)
The protein of each group was extracted, and the protein concentration was determined by BCA Kit (Boster Bioengineering Co., Ltd., Wuhan, China). The extracted protein was added to the sample buffer and boiled for 10 min at 95℃, 30 µg/well, and then, protein separation was performed by 10% polyacrylamide gel electrophoresis, with the electrophoretic voltage preset at 80 V transmitted to 120 V, followed by wet transfer, voltage of transmembrane was 100 mV for 45–70 min; afterwards, transmembrane using polyvinylidene fluoride film was conducted, followed by room temperature closure with 5% BSA for 1 hr. Subsequently, primary antibodies of LC3I, LC3II, Beclin1, Bcl-2, caspase-3, FAS, caspase-8, and RIPK3 (dilution ratio at 1:1,000; Cell Signaling, Beverly, MA) were added, with primary antibody of β-actin (dilution ratio at 1:3,000; Becton Dickinson, Franklin Lake, NJ) as the internal reference, which were saved at 4℃ for one night. After TBST washing (3 times/5 min), corresponding secondary antibodies were supplemented for incubation at room temperature for 1 hr, following membrane cleaning (3 times/5 min), and chemiluminescence reagents were added for color development. Bio-Rad Gel Dol EZ Imager (Bio-Rad, Hercules, CA) was used for development. Gray value analysis of the target strip was analyzed using Image J software (National Institutes of Health, Bethesda, MD). The experiment was repeated three times to obtain the average value.
2.9 Terminal deoxynucleotidyl transferase dUTP nick-end labeling (TUNEL) staining
Cells with density of 1 × 10⁶/ml were inoculated in a 12-well plate and fixed using 4% paraformaldehyde at room temperature for 1 hr. Each well was filled with 1 ml of cells. Then, cells were washed with PBS for 5 min, three times and transparent using 0.1% Triton X-100 at 4℃ for 10 min. PBS wash for 5 min, three times before 50 μl of TUNEL reaction solution (Beyotime Biotechnology, Shanghai, China) was added in each well. Cells were covered by preservative film for reaction at 37℃ in an incubator for 1 hr without any light exposure, after which cells were washed with PBS for 5 min, three times. Then, 4′,6-diamidino-2-phenylindole (DAPI) was added at room temperature and maintained at 3 min. PBS wash was for 5 min, three times without any light exposure. Observation was conducted using a fluorescence microscope at 520 ± 20 nm with green fluorescence as TUNEL positive. Blue DAPI observed at 460 nm was cell nucleus.
2.10 Flow cytometry (FCM)
Cells in each group were digested with 0.25% trypsin for preparation of single-cell suspension, after which cells were washed in PBS containing 1% BSA for 5 min × 2 min. Cell density was adjusted to 1 × l09/L for centrifugation. Then, 0.5 ml cell suspension was harvested and added 2 μl of TNFR1 monoclonal antibody at 37℃ for 30 min, during which the solution was shaken at an interval of 5 min. PBS washing containing 1% BSA was conducted for 5 min, two times. Subsequently, 1 ml of 4% paraformaldehyde was added before FCM was used for detection of TNFR1 expression. Cells without adding primary antibody were used for negative control. Five duplicate wells were set for each group.
2.11 Fluorescent electrophoresis
SensoLyte Homogeneous AMC Caspase-3 Assay Kit (AnaSpec, Fremont, CA) and Caspase-8 Fluorescent Assay Kit (Clontech, Palo Alto, CA) were used to measure the expressions of caspase-3 and caspase-8. The measurement was conducted strictly according to instruction of the kits. Cells were inoculated in the culture plate containing concentrated solutions of Ac-DEVD-AMC and IETD-AFC and maintained in the dark room at 37℃ for 30 min. Fluorescent photometer was used to measure the absorbance.
2.12 Statistical analysis
SPSS 21.0 (SPSS Inc., Chicago, IL) statistical software was used to analyze the data. Measurement data were expressed by mean ± standard deviation, and the comparison of measurement data in accordance with normal distribution used t test between groups, pairwise comparison applied least significant difference (LSD) method, and comparisons among groups were performed using one-way analysis of variance. A p < 0.05 meant that the difference was statistically significant.
3 RESULTS
3.1 No significant difference in general information
The average age of 32 controls in the control group was 45.2 ± 6.9 years old, smoking rate was 62.5%, and besides, working years and the period free from dust were 22.6 ± 7.1 and 3.9 ± 1.2 years, respectively. Furthermore, the average age of 58 CWP patients were 47.4 ± 7.2 years old, smoking rate was 70.7%, and working years and dust removal period were 24.1 ± 7.5 and 4.1 ± 1.4 years, respectively. The average age, smoking rate, working years, and the period free from dust in the two groups were not statistically significant (all p > 0. 05), indicating the AM between the two groups is comparable (Table 2).
| Items | Control group (n = 32) | CWP group (n = 58) | t/χ2 | p Value |
|---|---|---|---|---|
| Mean age | 45.2 ± 6.9 | 47.4 ± 7.2 | 1.41 | 0.162 |
| Smoking rate (%) | 20/12 (62.5) | 41/17 (70.7) | 0.63 | 0.426 |
| Working years (years) | 22.6 ± 7.1 | 24.1 ± 7.5 | 0.93 | 0.357 |
| Period free from dust (years) | 3.9 ± 1.2 | 4.1 ± 1.4 | 0.68 | 0.497 |
- Note. control group: male subjects exposed to coal dust; CWP: coal worker's pneumoconiosis.
3.2 Elevated TNF-α and TNFR1 expressions of AM in the CWP group
qRT-PCR and western blot were used to detect the mRNA and protein expressions of TNF-α and TNFR1 in the AM of control and CWP groups. Compared with the controls, mRNA and protein expression levels of TNF-α and TNFR1 were significantly increased of AM in the CWP group (all p < 0.05; Figure 1a–c).
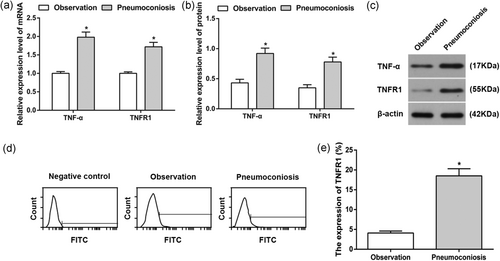
TNF-α and TNFR1 expressions levels in the AM of control and CWP groups. (a) TNF-α and TNFR1 mRNA expressions in the AM of control and CWP groups; (b) TNF-α and TNFR1 protein expressions in the AM of control and CWP groups; (c) protein band patterns of TNF-α and TNFR1 protein expressions in the AM of control and CWP groups; (d) TNFR1 expression on AM surface of control and CWP groups using flow cytometry; (e) statistical analysis on TNFR1 expression on AM surface of control and CWP groups. *p < 0.05, compared to the control group. AM: alveolar macrophage; control group: male subjects exposed to coal dust; CWP: coal worker's pneumoconiosis; FITC: fluorescein isothiocyanate; mRNA: messenger RNA; TNFR: tumor necrosis factor receptor; TNF-α: tumor necrosis factor-α
FCM showed that TNFR1 expression on the surface of the AM of CWP group was substantially increased when compared with that in the control group (p < 0.05), which indicated that TNF-α–TNFR signal pathway might be involved in the occurrence and development of CWP (Figure 1d,e).
3.3 Increased autophagy of AM in the CWP group
Transmission electron microscopy observation showed that autophagy was seen in both the AM of control and CWP groups, with the presence of obvious autophagosome; however, the number of autophagosome was significantly increased of AM in the CWP group than that of control group (p < 0.05; Figure 2a,b)
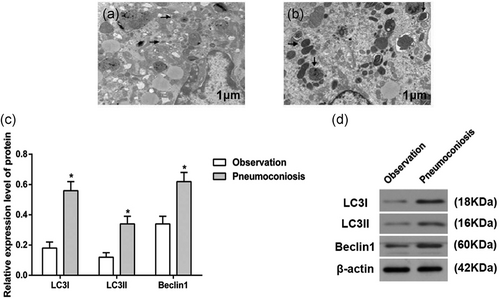
Autophagy in the AM of control and CWP groups (×10,000). (a) Autophagy of AM in the CWP group; (b) autophagy in the AM of control group; (c) expressions of autophagy biomarkers in control and CWP group; and (d) western blot analysis of autophagy biomarkers in control and CWP group. Arrows refer to autophagosome. *p < 0.05, compared to the control group. AM: alveolar macrophage; control group: male subjects exposed to coal dust; CWP: coal worker's pneumoconiosis
Western blot was used to identify the expression of autophagy marker proteins (LC3I, LC3II, and Beclin1) in AM of the control and CWP groups. Expressions of LC3II and Beclin1 were increased, whereas that of LC3I was reduced in AM of CWP group (p < 0.05), indicating obvious strengthened autophagy of AM in the CWP group (Figure 2c,d).
3.4 Enhanced apoptosis of AM in the CWP group
Observation of apoptosis in the AM of control and CWP groups under general optical microscope showed that the margination of chromatin was observed in both the AM of control and CWP groups, with typical apoptotic patterns such as nuclear fragmentation, fragmentation, and apoptotic bodies (Figure 3a,b); nevertheless, the apoptotic index was evidently elevated of AM in the CWP group than that of control group (p < 0.05; Figure 3c).
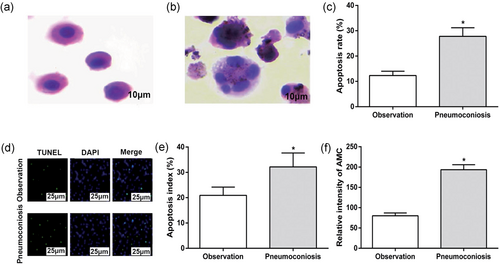
Apoptosis in the AM of control and CWP groups. (a) AM in control group (×1,000); (b) AM in CWP group (×1,000); (c) apoptosis index in control and CWP groups; (d) apoptosis detected by TUNEL staining in control and CWP groups (×400); (e) quantitative analysis for TUNEL staining; and (f) activities of caspase-3 in control and CWP groups. *p < 0.05, compared to the control group. AM: alveolar macrophage; control group: male subjects exposed to coal dust; CWP: coal worker's pneumoconiosis; DAPI: 4′,6-diamidino-2-phenylindole; TUNEL: terminal deoxynucleotidyl transferase dUTP nick-end labeling [Color figure can be viewed at wileyonlinelibrary.com]
TUNEL staining showed that the apoptosis rate in AM of CWP group was 27.8 ± 3.4%, which was substantially higher than 12.3 ± 1.7% in the control group (p < 0.05; Figure 3d,e).
Fluorescent electrophoresis assay was used to demonstrate the activity of caspase-3. Compared with AM of the control group, the activity of caspase-3 in AM of the CWP group was enhanced (p < 0.05; Figure 3f), which implied that apoptosis of AM may be associated with CWP.
3.5 Treatment of TNF-α elevates expression of TNF-α and TNFR1 in the AM of CWP
qRT-PCR and western Blot were used to detect TNF-α and TNFR1 mRNA and protein expressions in each group. The detection showed that compared with Blank group, there were no statistical difference in the TNF-α and TNFR1 mRNA and protein expression levels in cells of the PBS group (all p > 0.05). TNF-α and TNFR1 mRNA and protein expression levels were significantly upregulated in the TNF-α group, but there were obvious downregulated trends in the mRNA and protein expressions of TNF-α and TNFR1 in cells of the anti-TNF-α group when compared with Blank group (all p < 0.05; Figure 4a–c).
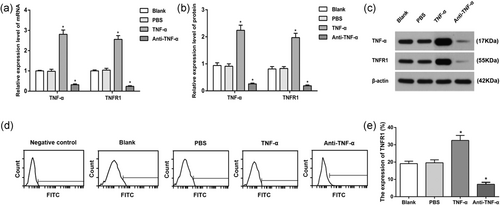
TNF-α and TNFR1 expression levels in the AM of each group. (a) TNF-α and TNFR1 mRNA expressions in each group; (b) TNF-α and TNFR1 protein expressions in the AM of each group; (c) protein band patterns of TNF-α and TNFR1 protein expressions in the AM of each group; (d) TNFR1 expression in AM surface; and (e) statistical analysis of TNFR1 expression in AM surface. *p < 0.05, compared to the Blank group. AM, alveolar macrophages. AM: alveolar macrophage; control group: male subjects exposed to coal dust; CWP: coal worker's pneumoconiosis; FITC: fluorescein isothiocyanate; mRNA: messenger RNA; PBS: phosphate-buffered saline; TNFR: tumor necrosis factor receptor; TNF-α: tumor necrosis factor-α
FCM was used to identify the expression of TNFR1 on the surface of AM in all the groups. TNFR1 expression on the AM surface in TNF-α group was higher than those in the Blank and PBS groups, whereas that in anti-TNF-α group was decreased (all p < 0.05). Those results showed that TNF-α can upregulate the expressions of TNF-α and TNFR1, thus activating TNF-α–TNFR signal pathway, whereas anti-TNF-α can on the other hand downregulate the expressions of TNF-α and TNFR1, resulting in inhibition of TNF-α–TNFR signal pathway (Figure 4d,e).
3.6 TNF-α promotes autophagy of AM in CWP
To investigate the effects of TNF-α–TNFR signal pathway on autophagy in the AM, autophagy was observed by a transmission electron microscopy for the AM of CWP group. Transmission electron microscopy observed certain degree of autophagy in the AM of the four groups. Compared with Blank group, no significant difference in autophagy was found in PBS group; however, the autophagy was remarkably decreased in TNF-α group, but highly strengthened in anti-TNF-α group (Figure 5a).
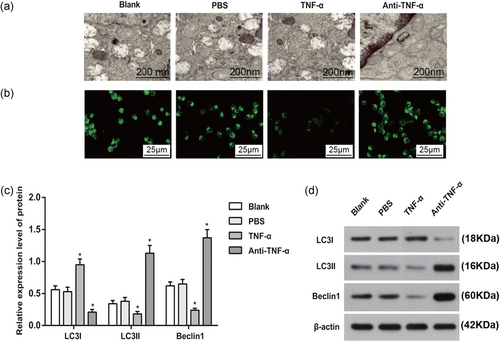
The effect of TNF-α on the autophagy in the AM. (a) Autophagy in the AM of each group (×35,000); (b) expression of LC3 in the AM of each group (×400); (c) expressions of autophagy biomarkers in AM of each group; and (d) western blot analysis of autophagy biomarkers in AM of each group. *p < 0.05, compared to the Blank group. AM: alveolar macrophage; PBS: phosphate-buffered saline; TNF-α: tumor necrosis factor-α [Color figure can be viewed at wileyonlinelibrary.com]
The expression of autophagy marker LC3 in AM of CWP was observed under the laser scanning confocal microscopy. In comparison with Blank group, the green fluorescence expression of LC3 in TNF-α group was decreased, while that in anti-TNF-α group was enhanced. No significant difference was revealed between PBS and Blank groups (Figure 5b).
Expressions of LC3I, LC3II, and Beclin1 as marker proteins of autophagy were measured by western blot. No significant difference was found between Blank and PBS groups (all p > 0.05). Compared with Blank group, TNF-α group had increased LC3I expression, but decreased LC3II and Beclin1 expressions, while the expressions of LC3II and Beclin1 in anti-TNF-α group were enhanced and LC3I expression was decreased (all p < 0.05), indicating that upregulation of TNF-α can inhibit the autophagy of AM in the CWP, while suppression of TNF-α can promote autophagy of AM (Figure 5c,d).
3.7 TNF-α promotes apoptosis of the AM in CWP
The apoptosis of AM in each group was observed by laser scanning confocal microscopy. Under the confocal microscope, the four groups have different apoptosis degree. The morphology of apoptotic cells was mainly characterized by: The nucleus was rippled or creased; some chromatin condensed; chromatin of the nucleus was highly condensed and marginalized; and the nucleus broke down into fragments and produced apoptotic bodies (Figure 6a).
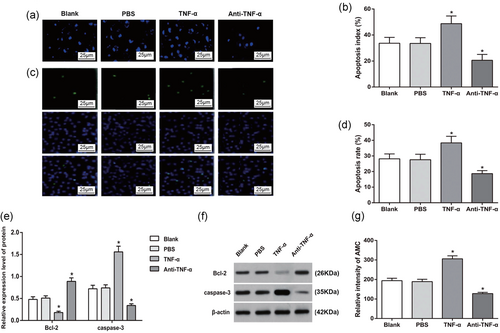
The effect of TNF-α on the apoptosis in the AM. (a) Apoptosis in the AM of each group (×400); (b) quantitative analysis of apoptosis in each group; (c) apoptosis in the AM of each group by TUNEL staining (×400); (d) quantitative analysis by TUNEL staining; (e) expressions of apoptosis-related proteins; (f) western blot analysis of apoptosis-related proteins; and (g) activity of caspase-3 in the AM of each group. *p < 0.05, compared to the Blank group. AM: alveolar macrophage; Bcl-2: B-cell lymphoma 2; PBS: phosphate-buffered saline; TNF-α: tumor necrosis factor-α; TUNEL: terminal deoxynucleotidyl transferase dUTP nick-end labeling [Color figure can be viewed at wileyonlinelibrary.com]
Quantitative analysis for apoptosis of AM was performed with the observation under a light microscope. Compared with Blank group, the apoptotic cells were increased and the apoptosis rate in TNF-α group was increased (all p < 0.05). However, in contrast to Blank group, the apoptotic cells and the apoptosis rate were reduced in the anti-TNF-α group (all p < 0.05), while those in the PBS group were not significant different from that in the Blank group (p > 0.05; Figure 6b).
TUNEL staining demonstrated no significant difference on apoptosis rate between PBS and Blank groups (p > 0.05). In contrast to Blank and PBS groups, the apoptosis rate in TNF-α group was increased, whereas that of anti-TNF-α group was suppressed (both p < 0.05; Figure 6c,d).
Western blot was used to determine the protein expression of apoptosis-related factors (Bcl-2 and caspase-3). The expressions of Bcl-2 and caspase-3 in PBS group were not different from those in Blank group (both p > 0.05). When compared with Blank group, the TNF-α group had decreased Bcl-2 but increased caspase-3, in contrast to increased expression of Bcl-2 and reduced expression of caspase-3 in anti-TNF-α group (all p < 0.05), indicating that the suppression on TNF-α–TNFR signal pathway can inhibit apoptosis of AM of CWP (Figure 6e,f).
Fluorescence electrophoresis was adopted to examine the activity of caspase-3. The activity of caspase-3 was significantly enhanced in TNF-α group and suppressed in anti-TNF-α group when compared with Blank and PBS groups (all p < 0.05; Figure 6g).
3.8 TNF-α–TNFR1 signal pathway induces AM apoptosis in CWP through regulating FAS–caspase-8
The expressions of FAS, caspase-8, and RIPK3 between PBS and Blank groups showed no significant difference (all p > 0.05). When compared with PBS and Blank groups, TNF-α group had increased expressions of FAS and caspase-8, whereas anti-TNF-α group had decreased expressions of FAS and caspase-8 (all p < 0.05). The expression of RIPK3 among PBS, Blank, TNF-α, and anti-TNF-α groups showed no significant difference (all p > 0.05; Figure 7a,b).
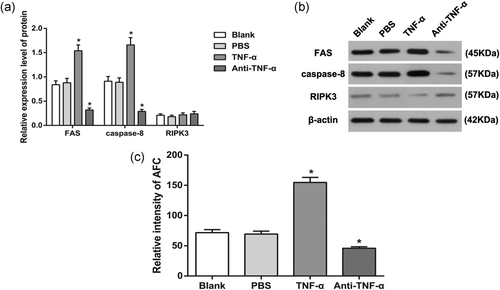
Expressions of FAS, caspase-8, and RIPK3 in the AM of each group. (a) Protein expressions of FAS, caspase-8, and RIPK3 in the AM of each group; (b) protein band patterns of FAS, caspase-8, and RIPK3 in the AM of each group; and (c) activity of caspase-8 in the AM of each group. *p < 0.05, compared to the Blank group. AM: alveolar macrophage; PBS: phosphate-buffered saline; RIPK3: receptor-interacting serine–threonine-protein kinase 3; TNF-α: tumor necrosis factor-α
Fluorescence electrophoresis was adopted to examine the activity of caspase-8 in AM. The TNF-α group had increased activity of caspase-8, whereas anti-TNF-α group had decreased activity of caspase-8 in comparison with those in PBS and Blank groups (all p < 0.05; Figure 7c). Above results showed TNF-α independent from RIPK3 may upregulate TNFR1 to recruit FAS, thus activating caspase-8 to induce AM apoptosis. This process was not dependent on the RIPK3-mediated programmed cell death.
4 DISCUSSION
In vivo and in vitro studies showed that AM plays an important role in the pathogenesis of pneumoconiosis (M. Wang et al., 2015). After dust entered the alveoli, AMs were activated by phagocytosis of dust particles, and caspase-dependent apoptosis occurred (Bai et al., 2013). Apoptosis may be initiated through the cell surface receptor of AM with its ligand combination, which is mainly achieved through the induction of apoptosis in three basic signal transduction pathways: Fas–Fas-L pathway, TNF-α–TNFR pathway, and TRAILR–TRAIL pathway (Lin et al., 2011; Meusch et al., 2015; Zhang et al., 2016). AMs are key regulatory cells in lung; however, the role of apoptotic AM in lung inflammatory and fibrotic lung disorders remains to be well characterized (L. Wang et al., 2003). Apoptotic AM can secrete such cytokines as IL-1, IL-8, TNF-α, and metabolic substances of arachidonic acid, which can subsequently recruit neutrophils and AM, leading to alveolitis, alveolar wall destruction, and lung fibrosis (Yao et al., 2013).
Current study showed that the ordinary optical microscope observed the typical morphology of CWP patients with AM apoptosis, chromatin marginalization, and nuclear fragmentation into a block shape, but interestingly the apoptosis of AM volume was significantly greater than that of the normal AM volume, which was inconsistent with the classical theory that the volume of apoptotic cells is reduced. It may be explained by that AM has absorbed a large amount of dust, changed the internal structure of AM, and made its volume become larger. The mechanism needs to be further studied in future studies. The apoptosis rate of AM in CWP patients was higher than that in the controls. Programmed cell death has been described to occur in the downstream of TNFR family, such as TNFR1 or FAS (APO-1 or CD95; Boutaffala et al., 2015). In addition to pneumoconiosis, previous study supported that TNF-α can trigger multiple mechanisms which lead to the initiation of hepatocytes, resulting in subsequent liver injury (Ding & Yin, 2004). Moreover, the apoptosis induced by TNFR1 is thought to be associated with the recruitment of adaptor FADD and caspase-8 (Micheau & Tschopp, 2003). The treatment of TNF-α had increased expression and activity of caspase-8, which indicated that TNF-α participated in AM apoptosis by increasing caspase-8.
Current study showed compared with controls, mRNA and protein expression levels of TNF-α and TNFR1 were significantly increased in the AM of CWP, associated with obvious elevation of autophagosome and apoptotic index. Schins and Borm (1995) reported that the significant involvement of TNF-α in pneumoconiosis induced by coal dust and the expression of TNF-α acts as a powerful tool to predict individual prognosis of pneumoconiosis. Furthermore, supportive evidence was found in cell experiments with the corresponding results suggested that in comparison with the Blank group, mRNA and protein expression levels of TNF-α and TNFR1 were significantly increased in the TNF-α group; activity of autophagy in cells was significantly decreased, which implied that TNF-α can increase the expression of TNFR1. A previous study has documented the correlation of TNF-α gene polymorphism with genetic susceptibility to pneumoconiosis (Mai et al., 2015). In addition, following the treatment of TNF-α, the expression of green fluorescent protein of LC3, a marker of autophagy, was significantly decreased; meanwhile, the expression of LC3I increased, the expression level of LC3II and Beclin1 decreased, the apoptotic index increased, the expression of Bcl-2 decreased, and the expression level of caspase-3 increased evidently. However, the anti-TNF-α group reversed the situation. Above results revealed that the upregulation of TNF-α expression could inhibit the autophagy of AM, whereas the suppression of TNF-α expression could promote the autophagy of AM; meanwhile, the inhibition of TNF-α–TNFR signal pathway could suppress the apoptosis of AM. So far, the exact mechanism of CWP is not clear. Previous literature suggested that AM apoptosis is considered as pathologic basis of pulmonary fibrosis (Fritz et al., 2015), and the apoptosis of AM produces large amounts of inflammatory cytokines and fibrogenic factors in pneumoconiosis, which plays critical roles in the occurrence and development of pneumoconiosis (Yan-Qin et al., 2010). To exclude the impact of necroptosis, the activity of RIPK3 was also measured and the results supported that TNF-α independent from RIPK3 upregulates TNFR1 to recruit FAS, thus activating caspase-8 to induce AM apoptosis.
In conclusion, TNF-α–TNFR signal pathway was implicated in the occurrence and development of CWP by inhibiting autophagy and promoting apoptosis in AM. However, in current study, the exact mechanism of TNF-α–TNFR signal pathway in AM apoptosis and CWP still needs improvement and supportive evidence, and thus, in future, the pathogenesis and development of CWP can be explored at the genetic level, so as to provide scientific reference for the treatment and prevention of CWP.
ACKNOWLEDGMENT
We acknowledge the reviewers for their helpful comments on this paper. The project is supported by Hebei Province Graduate Innovation Funding (CXZZBS2018142), North China University of Technology Graduate Innovation Project (2018B16).
CONFLICTS OF INTEREST
The authors declare that there are no conflicts of interest.


