Coordinated Dynamics of RNA Splicing Speckles in the Nucleus
Abstract
Despite being densely packed with chromatin, nuclear bodies and a nucleoskeletal network, the nucleus is a remarkably dynamic organelle. Chromatin loops form and relax, RNA transcripts and transcription factors move diffusively, and nuclear bodies move. We show here that RNA splicing speckled domains (splicing speckles) fluctuate in constrained nuclear volumes and remodel their shapes. Small speckles move in a directed way toward larger speckles with which they fuse. This directed movement is reduced upon decreasing cellular ATP levels or inhibiting RNA polymerase II activity. The random movement of speckles is reduced upon decreasing cellular ATP levels, moderately reduced after inhibition of SWI/SNF chromatin remodeling and modestly increased upon inhibiting RNA polymerase II activity. To define the paths through which speckles can translocate in the nucleus, we generated a pressure gradient to create flows in the nucleus. In response to the pressure gradient, speckles moved along curvilinear paths in the nucleus. Collectively, our results demonstrate a new type of ATP-dependent motion in the nucleus. We present a model where recycling splicing factors return as part of small sub-speckles from distal sites of RNA processing to larger splicing speckles by a directed ATP-driven mechanism through interchromatin spaces. J. Cell. Physiol. 231: 1269–1275, 2016. © 2015 Wiley Periodicals, Inc.
Even though the nucleus is densely packed with structures like chromatin, the nuclear matrix, nucleoli and nuclear bodies, it is a highly dynamic organelle (Hübner et al., 2013). Cytoskeletal forces are exerted on the nuclear surface to move and rotate it (Wu et al., 2011), chromatin loops between distal gene regulatory sequences form dynamically during gene transcription (Kadauke and Blobel, 2009; Shchuka et al., 2015), transcription factors bind transiently to gene promoters, finding their target sequences by diffusion and scanning mechanisms (Mueller et al., 2013), and nuclear bodies, including PML bodies, move (Stixová et al., 2012). Key nuclear functions, including transcription, RNA splicing, nuclear signaling, and nucleocytoplasmic transport, depend on the dynamic assembly and disassembly of large macromolecular complexes.
The 20–40 RNA splicing specked domains (RNA Splicing Speckles; SC35 Domains) in each nucleus contain high concentrations of RNA splicing factors (Mintz et al., 1999) and organize euchromatic nuclear compartments (Shopland et al., 2003). Imaged by electron microscopy (Monneron and Bernhard, 1969), each domain consists of a cluster of granules, an interchromatin granule cluster, surrounded by a region enriched in the perichromatin fibrils that contain new RNA transcripts (Biggiogera and Fakan, 1998; Cmarko et al., 1999). Active genes tend to cluster around these structures (Shopland et al., 2003) and many pre-mRNA transcripts are spliced at or near them(Smith et al., 1999). Although they are remarkably robust to stringent isolation procedures (Mintz et al., 1999; Saitoh et al., 2004), splicing factors like SRm160 bind and dissociate continually from speckles (Misteli et al., 1997; Kruhlak et al., 2000; Wagner et al., 2004; Kota et al., 2008), deform shape in response to gene activation and randomly fluctuate in position (Misteli et al., 1997). Speckled domains are substructures of a non-chromatin fibrogranular nuclear matrix (Spector et al., 1983; Blencowe et al., 1994; Wan et al., 1994; Nickerson et al., 1997; Wagner et al., 2003). This is a dynamic structure(Nickerson, 2001) in which the connections of speckles with each other and with other nuclear matrix elements must form and break to spatially reorganize transcription and splicing (Spector and Lamond, 2011). While it is known that speckles are dynamic, the physical mechanisms by which they assemble and move are not well understood.
Here we set out to understand the mechanisms by which splicing speckles move in the nucleus. Imaging of SRm160 in breast epithelial cells unexpectedly revealed movement of smaller speckles toward and merging into speckle-permissive domains in the nucleus. These movements required ATP and RNA Polymerase II. We devised a method to create pressure gradients in the nucleus, and directly demonstrate rapid movement of speckles and concomitant deformation along curvilinear paths. Collectively, our results suggest the presence of ATP-dependent long-range interaction forces or structures that cause converging speckle movement.
Materials and Methods
Cell culture, plasmids, and drug treatment
Cells were cultured at 37°C in a 5% CO2 environment. MCF-10A cells were cultured in mammary epithelial basal medium (MEBM) supplemented with 0.5 mg/ml Hydrocortisone solution, 20 ng/ml EGF, 100 ng/ml cholera toxin, 100 μg/ml recombinant human insulin and bovine pituitary extract (Lonza, Portsmouth, NH). The development of MCF-10A cells inducibly expressing non-specific shRNA or shRNA against BRG1 was described in previous work (Imbalzano et al., 2013). Knockdown of BRG1 was induced by adding doxycycline (Sigma–Aldrich, St. Louis, MO) at 10 μg/ml final concentration for 48 h.
Transient transfection of plasmids was performed using Lipofectamine 2000 or 3000 reagent (Invitrogen, Carlsbad, CA) following the manufacturer's protocol. Development of EGFP-SRm160 and mRFP-SRm160 plasmids was described in our previous work (Wagner et al., 2003).
The LINC complex was disrupted by transfecting cells with GFP-KASH4 (Roux et al., 2009). F-actin was disrupted with 0.2 μg/ml Latrunculin A (LatA, Cayman Chemical, Ann Arbor, MI) for 30 min before imaging. RNA polymerase II (Pol II) was inhibited with 50 μg/ml α-amanitin (Santa Cruz Biotechnology, Dallas, TX) for 4 h.
ATP depletion
In order to reduce ATP level in the nucleus, MCF-10A cells were incubated in a low glucose DMEM (Cellgro, Manassas, VA) with 6 mM 2-Deoxyglucose (Sigma–Aldrich) and 10 mM sodium azide (Sigma–Aldrich) for 30 min before imaging.
Microscopy
For microscopy, cells were transferred onto 35 mm glass-bottom dishes coated with 5 μg/ml fibronectin (BD Biosciences, San Jose, CA). Time-lapse images were acquired on a Nikon TE2000 inverted epifluorescent microscope with 60×/1.49NA oil immersion objective (Nikon, Melvin, NY) and CCD camera (CoolSNAP, HQ; Photometrics, Tucson, AZ). During live cells imaging, cells were maintained at 37°C in a 5% CO2 environment.
Micromanipulation
The nuclei were manipulated with a micromanipulator (Eppendorf InjectMan, Eppendorf, Hauppauge, NY) mounted with a micropipette with a tip diameter of 0.5 μm (Femtotip II, Eppendorf). For aspiration, the micropipette tip was inserted inside the nucleus and a suction pressure of 20 kPa was applied. Compressive pressure on the top of nucleus was created by lowering the micropipette tip to gently touch the top of nucleus for approximately 200 ms.
Image analysis
Time lapse images were acquired and processed using the NIS-Elements software (Nikon). Tracking of single particles was achieved by using ParticleTracker 2D and 3D plugin of ImageJ (Sbalzarini and Koumoutsakos, 2005). Particle Image Velocimetry (PIV) was performed in MATLAB (The MathWorks, Natick, MA) using PIVlab (Thielicke, 2014; Thielicke and Stamhuis, 2014a,2014b) for time lapse fluorescence images of nuclear speckles. The averaged velocity field was plotted on the first image to show the average flow pattern of speckles.
MSD analysis
Mean squared displacement was calculated as 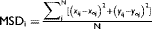 where
where  and
and  are the corrected x and y coordinates of speckle j at time
  . The x and y coordinates were corrected by subtracting the mean displacement for each speckle from its time-dependent positions. Linear regression analysis was used for getting the slope from the MSD vs. time plots. Speckle area was calculated from images with the Columbus Data Storage and Analysis System (Perkin Elmer Inc. Waltham, MA).
Statistical analysis of random motion of speckles
 value of MSD was

 is the student t value at
  = 0.05 and degree of freedom (DOF) = n-2. Then the absolute value of the deviation (δ) between a data point and the average was compared to the product of
  and standard deviation, S (at a 95% confident level). The suspected outliers were identified if δ>
  S. After visual confirmation that the outliers were created by directional movement of speckles, those data points were removed from the analysis as the analysis is concerned only with random motion of speckles. A generalized linear regression model (GLRM) was used for testing if the diffusivities of treatment groups were different from the control group. Statistical significance was assumed for P < 0.05.
Results
Converging speckles in the epithelial cell nucleus
We tracked the motion of splicing speckles in the nucleus of human breast epithelial cells (MCF-10A) labeled with EGFP-SRm160 (serine/arginine (SR)-related nuclear matrix protein of size 160 kDa (Blencowe et al., 1998)). In addition to random motion of speckles, we observed that smaller speckles moved toward larger speckles and fused with them over time scales of hours (Fig. 1A, movie 1), extending previous results from Misteli and Spector (Misteli et al., 1997). Although smaller speckles converged toward and eventually merged with the larger speckle, we could not detect a significant change in the size of the large speckle after merging (Fig. 1A, bottom left).

We used particle image velocimetry to track the motion of the speckles and quantified the flow field. Shown in Figure 1B are representive speckles with flow vectors which represent the average movement between two successive images separated by either 2 min or 5 min over multiple images (Fig. 1B). Such converging movements were commonly observed (Fig. 1B, see example movies 2–3) in cells, but could not be detected in cells depleted of ATP by sodium azide treatment. They were also rarely observed in cells treated with α-amanitin to inhibit RNA polymerase II.
In contrast to convergence of small speckles toward a larger speckle in local regions above, two larger speckles were sometimes observed to directionally move toward each other while adjacent speckles were unmoved (Fig. 1C, movie 4). The average speed of motion toward each other was on the order of 0.1 μm/min, but on coming in close vicinity, the speckles were observed to rapidly fuse (at speeds greater than 1 μm/min, Fig. 1D). Speckles moved toward each other directionally over varying distances ranging from less than 2 μm to as much as 7 μm (mean of 3.8 ± 0.5 μm). As the speckles fused, they were observed to form a new speckle (Fig. 1C) which did not retain the original shapes of the two speckles.
Pressure-driven speckle flow
Given the densely packed nuclear space, the fact that speckles appear to move directionally and converge into larger speckles is remarkable. To directly establish the feasibility of speckle translocation in the tortuous nucleus filled with interphase chromosomes and non-chromatin bodies, we devised a method to generate a pressure gradient in the nucleus. We inserted a micropipette (tip diameter of 0.5 μm) into the nucleus (Fig. 2A) and applied a suction pressure of 20 kPa. In response, some speckles moved toward the micropipette tip along curved paths spanning several microns (Fig. 2B), while others remained in place mostly unaffected by the pressure. Tracking GFP histone H1.1 which labeled chromatin in the vicinity of the speckles showed little to no local deformation of chromatin (Fig. 2B, movie 5) near the moving speckles. In some cases, multiple speckles followed the same curved path toward the tip giving the appearance of speckle “trains” (Fig. 2C). Some speckles thinned and elongated as they moved toward the micropipette tip (Fig. 2D-F, movie 6). Other speckles fused with each other as they moved (Fig. 2G, white arrowheads), while others elongated and moved in curved paths around chromatin barriers as they moved toward the tip (Fig. 2D and E).

As the nucleus and its contents are compliant, we applied a compressive pressure pulse on the top of the nucleus by touching the top of the cell with a micropipette for approximately 200 milliseconds (Fig. 3A). This application of gentle pressure on the nucleus caused the speckles to translate with the deforming nucleus and to relax back upon release of the pressure (Fig. 3B, movie 7). However, some speckles were observed to clearly deform and elongate as they moved (Fig. 3B), very similar to the observations of speckle thinning under suction pressure (Fig. 2D–F).

Intranuclear and extranuclear forces contribute to speckle motion
Misteli et al have suggested that the majority of speckles in the nucleus fluctuate in a constrained nuclear area over short times (Misteli et al., 1997). We tracked fluctuating splicing speckles and calculated statistics of the motion. The trajectories were corrected for nucleus motion by subtracting the average trajectory of all speckles (see Materials and Methods). The centroids of most speckles moved locally around the initial position as a random walk (Fig. 4A), as indicated by the mean squared displacement (MSD) being linear with time t (Fig. 4B). By fitting the equation MSD = 4Dt to the measured MSD of the randomly moving speckles, we estimated the mean value of the speckle diffusion coefficient to be D = 0.00215 ± 0.00006 μm2/min. To set a scale, the diffusion coefficient in the nucleus of 62 kD dextran (D = 180 μm2/min) (Peters, 1984) or GFP (D = 240 μm2/min) (Seksek et al., 1997). Random speckle mobility was considerably reduced upon ATP depletion, the disruption of F-actin with latrunculin A, and the disruption of nuclear-cytoskeletal linkages by expression of KASH4 (Fig. 4A, Table I). The knockdown of BRG1 (Cohet et al., 2010), a chromatin remodeling enzyme (Trotter and Archer, 2008; Lu and Roberts, 2013), caused a modest decrease in the diffusion coefficient. The inhibition of RNA polymerase II by treating the cells with α-amanitin, however, caused a modest increase in random speckle mobility. Speckle size was reduced in cells depleted of BRG1, upon inhibition of ATP, F-actin disruption and GFP-KASH4 expression (Table I); therefore the observed decrease in the diffusion coefficient cannot be explained by changes in size.

| Condition | n1 | Diffusion coefficient ×103 (μm2/min) | n2 | Speckle area (μm2) |
|---|---|---|---|---|
| Control | 130 | 2.15 ± 0.06 | 174 | 1.9 ± 0.1 |
| RNA Pol II Inhibition | 79 | 3.6 ± 0.1** | 117 | 2.5 ± 0.1** |
| Latrunculin A | 92 | 1.47 ± 0.06** | 113 | 1.2 ± 0.1** |
| ATP depletion | 61 | 0.35 ± 0.03** | 223 | 1.47 ± 0.05** |
| shRNA Control | 67 | 1.75 ± 0.07 | 135 | 2.0 ± 0.1 |
| BRG1 knockdown | 80 | 1.23 ± 0.04## | 149 | 1.5 ± 0.1# |
| GFP Control | 64 | 2.91 ± 0.09 | 80 | 2.4 ± 0.2 |
| GFP-KASH4 | 89 | 1.14 ± 0.04++ | 142 | 1.8 ± 0.1++ |
- Splicing speckles moved diffusively and followed a simple random walk model. Diffusion coefficients were estimated by fitting the equation MSD = 4Dt to MSD versus time curves (an example is in Fig. 4B). n1 is the number of speckles used to estimate the diffusion coefficient in each condition. Values are slope ± standard deviation of the slope. The areas of speckles were measured by using Columbus Data Storage and Analysis System and the values shown in the table are the average of n2 number of speckles. Values are mean ± standard error of the mean (SEM). Statistically significant differences between control and condition are indicated by symbols: **P < 0.01 relative to Control, #P < 0.05 and ##P < 0.01 relative to shRNA Control; ++P < 0.01 relative to GFP Control.
Discussion
In this paper, we report the observation that small RNA splicing speckles form and move over distances of a few micrometers toward larger speckles with which they fuse. Upon merging, the speckle pairs did not retain shape memory from before the fusion. Such behavior has also been reported for other types of ribonucleoprotein complexes such as nucleoli (Brangwynne et al., 2011). These movements are significantly reduced upon depletion of ATP. The ATP-dependent directed motion of these smaller speckles may be achieved by ATP-dependent motors like RNA polymerase II. Other candidates in the nucleus include nuclear myosins (de Lanerolle, 2012; Sarshad et al., 2014). Dynamic attachments to the nuclear matrix could facilitate such movement. The ATP-dependent remodeling of chromatin, for example by SWI/SNF, at the outer surfaces of chromatin territories could provide force to move a speckle in the interchromatin spaces between territories, though it is hard to see how multivectorial directionality would be achieved. In any case, it is likely that small speckle movement occurs through interchromatin spaces since movement through chromatin territories would be restricted. This would be consistent with the interpretation of 100 nm particle tracking experiments in the nucleus (Bacher et al., 2004).
Heterogeneities in protein composition within speckles have been reported and a model presented where speckles are constructed of heterogeneous subspeckles that traffic between speckles and those sites of co-transcriptional splicing that are distant from speckles (Mintz and Spector, 2000). These subspeckles could consist of one or a small cluster of interchromatin granules. This model would fit with our results if the speckles moving in our experiments are the “subspeckles” returning to larger speckles from distal sites of splicing. In this mechanism splicing factors would unbind from larger speckles (consistent with FRAP experiments (Misteli et al., 1997; Kruhlak et al., 2000; Wagner et al., 2004; Kota et al., 2008)) and diffuse to transcription sites of intron-containing genes individually or in small complexes. After splicing, they would be recycled to larger speckles by moving in subspeckles using some mechanism of directed motion. Subspeckles at the periphery of larger speckles have been termed perispeckles and found to be enriched in Exon Junction Complex core proteins in assembled complexes (Daguenet et al., 2012) and the RNA export factor UAP56 (Kota et al., 2008) .
We applied suction through a narrow micropipette inserted into the nucleus to create a pressure gradient. The striking curvilinear paths taken by speckles as they moved toward the micropipette tip, the local thinning in some cases, and the observation that multiple speckles follow the same curved paths strongly suggest the presence of channels in the nucleus with a low mechanical resistance to motion through which speckles can move. Speckles that do not move toward the pipette tip are either not in channels or are in non-contiguous channels. The conducting channels can be interpreted to be interchromatin spaces between chromosome territories in which speckles have been shown to be reside (Albiez et al., 2006; Markaki et al., 2010).
We analyzed the random motion of speckles in the nucleus and found that it is actively driven unlike the motion of other ribonucleoprotein complexes like nucleoli that are primarily passive and driven by thermal fluctuations (Brangwynne et al., 2011). BRG1 knockdown and inhibition of RNA polymerase II by α-amanitin treatment affected speckle motility. The disruption of nuclear linkages to the cytoskeleton reduced random motility of speckles and F-actin disruption decreased speckle motion, suggesting that cytoskeletal forces generated on the nuclear surface can be transmitted to move intra-nuclear speckles. Transmission of force from the cytoskeleton to the nuclear interior can be mediated by connections of chromatin and the internal nuclear matrix to the nuclear lamina (Maniotis et al., 1997; Wang et al., 2009). Thus, both intra- and extra-nuclear forces contribute to random speckle motion in the nucleus.
Acknowledgments
This work was supported by NIH R01 EB014869 (T.P.L. and J.A.N.), NIH R01 GM102486 (T. P. L. and R.B.D.) and NIH P01 CA82834 (J.A.N.).