The Neutrophil Percentage-to-Albumin Ratio as a Biomarker for All-Cause and Diabetes-Cause Mortality Among Diabetes Patients: Evidence From the NHANES 1988–2018
Funding: This work was supported by the research fund from Chongqing Municipal Health Commission (Grant CQYC2020020331); Chongqing Municipal Bureau of Science and Technology (Grant cstc2021ycjh-bgzxm0050); Research Project of Sichuan Medical and Health Care Promotion Institute (Grant KY2023QN0131).
Yuanyuan Jing and Bowen Tian contributed equally to this article.
ABSTRACT
Background
Neutrophil percentage-to-albumin ratio (NPAR) was significantly correlated with diabetes-related complications. There are little data about NPAR and mortality risk in individuals with diabetes.
Methods
This study included 3858 diabetes patients from the National Health and Nutrition Examination Survey (NHANES) conducted from 1988 to 2018. Using a restricted cubic spline (RCS), the relationship between the NPAR and mortality risk was shown. Multivariable Cox regression models were used to evaluate the relationship between the NPAR and diabetes-cause and all-cause death. An examination of the time-dependent receiver operating characteristic curve (ROC) was used to assess how well the NPAR predicted survival outcomes.
Results
Among 3858 diabetes individuals, a total of 1198 (31.1%) died over a mean follow-up of 7.86 years; of these, 326 (8.4%) had diabetes-related deaths and 872 (22.6%) had deaths from other causes. The RCS regression analysis showed a positive linear association between the NPAR and all-cause and diabetes-cause mortality. High NPAR group had a significantly higher risk of all-cause and diabetes-cause mortality in univariate and multivariate analysis. Compared with low NPAR group, high NPAR group had a low survival rate of diabetes cases in all-cause death and diabetes-cause mortality with area under the curve of the 3-, 5-, and 10-year ROC curve being 0.725, 0.739, and 0.734 for all-cause mortality and 0.754, 0.752, and 0.745 for diabetes-cause mortality, respectively.
Conclusion
In summary, we examined 3858 diabetes patients from NHANES database (1998–2018) and suggested NPAR as a biomarker for all-cause and diabetes-cause mortality prediction.
1 Introduction
In recent decades, diabetes has emerged as a major global public health concern [1]. The number of cases of diabetes worldwide among people aged 20–79 years was estimated to be 536.6 million (10.5%) in 2021 and is expected to rise to 783.2 million (12.2%) by 2045, according to the 10th edition of the International Diabetes Federation (IDF) Diabetes Atlas [2]. A higher risk of many sequelae, such as nephropathy, retinopathy, and cardiovascular disease, have been linked to diabetes [3, 4]. Moreover, diabetes greatly raises the risk of diabetes-cause and other-cause death in people [5]. In order to avoid, delay, or lessen the progression of diabetes and death from diabetes, it is crucial to quickly identify additional risk factors.
Neutrophils are an essential component of the innate cellular immune system [6]. The most prevalent negatively charged protein in human plasma is albumin, which serves crucial functions as a buffer, antidote, immunomodulator, and transporter [7]. In addition to offering independent prognostic criteria that are simple to identify during diagnosis, the perfect prognostic scoring system should be inexpensive to use in clinical settings. The neutrophil percentage-to-albumin ratio (NPAR) has been investigated as a factor correlated with disease severity and prognosis in many malignant and benign diseases [6, 8-10]. Studies found that an increased NPAR was a risk factor for diabetic retinopathy [11] and nonalcoholic fatty liver disease [12]. Moreover, NPAR showed significant correlations between all-cause mortality and atrial fibrillation [13] and chronic heart failure [10]. It has not been evident, yet, how the NPAR and mortality risk are related in diabetic patients. Therefore, using a population-based survey that represents the health status of adults across the USA, this study intends to examine the relationship between NPAR and diabetes-cause and all-cause mortality in diabetes patients.
2 Methods
2.1 Data Source
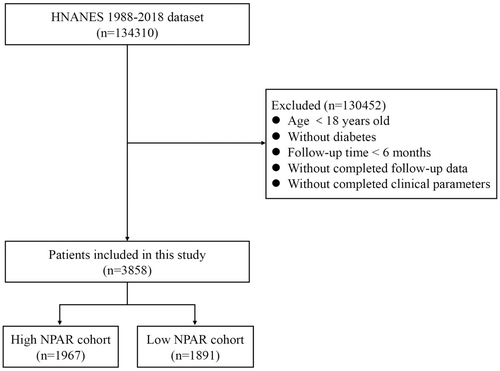
The National Health and Nutrition Examination Survey (NHANES) database, a program run by the National Center for Health Statistics (NCHS) of the Centers for Disease Control and Prevention (CDC), provided the data for this study [14]. After obtaining the cases for this research from NHANES (1988–2018), we then selected the cases with strict inclusion and exclusion criteria (Figure 1). Moreover, diabetes was diagnosed in those who satisfied one or more of the following criteria: (1) 7.0 mmol/L for fasting plasma glucose or a 2-h oral glucose tolerance test level of 11.1 mmol/L; (2) 11.11 mmol/L for random blood glucose; (3) > 6.5% for glycohemoglobin (HbA1c); (4) use of insulin or diabetic medication; and (5) self-reported medical diagnosis of diabetes [15]. NPAR was calculated using the same blood sample and the following formula: Neutrophil percentage (in total WBC count) (%) × 100/Albumin (g/dL).

2.2 Definition of Clinical Covariates and Outcomes
The National Death Index database of the CDC served as the source of the mortality statistics. Every person's follow-up period was set to last from the time of participation until their death, whichever came first, or until December 31, 2019. Diabetes-cause and all-cause mortality were classified using the International Statistical Classification of Diseases, 10th Revision (ICD-10) codes [16]. The three categories of smoking status were never smoked (defined as fewer than 100 cigarettes in one's lifetime), former smoked (more than 100 cigarettes but no longer smokes), and current smoked (more than 100 cigarettes and smokes sometimes or daily presently). The drinking status was classified as follows: never drinking (defined as fewer than 12 drinks in a lifetime), former drinking (defined as more than 12 drinks in a single year and no drinking the previous year, or more than 12 drinks in a single year and no drinking the previous year), mild drinking (defined as fewer than 1 drink per day for females and fewer than 2 drinks per day for males), moderate drinking (defined as 1–3 drinks per day for females and 2–4 drinks per day for males on average), and heavy drinking (defined as fewer than 4 drinks per day for women or fewer than 5 drinks per day for men). A self-reported history of hypertension, the use of antihypertensive medication, and an average systolic blood pressure of at least 140 mmHg and/or average diastolic blood pressure of at least 90 mmHg were all considered indicators of hypertension. Nonalcoholic fatty liver disease (NAFLD) status was defined as serum ALT > 30 IU/L in males and > 19 IU/L in women without significant alcohol intake (> 3 drinks per day for men and > 2 drinks per day for women) and/or viral hepatitis (infections with the hepatitis B or hepatitis C viruses) [17].
2.3 Statistical Analysis
Weighted means were used to represent continuous data, whereas percentages were used to express categorical ones. To examine differences between two groups for continuous variables, the Student's t-test and the Mann–Whitney U test were used when applicable. The chi-squared test was used to assess group differences in categorical data.
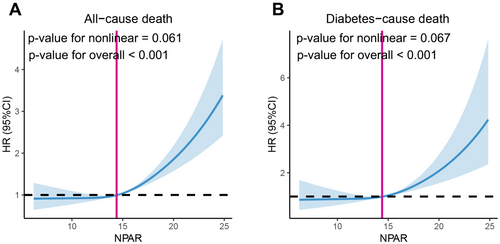
Using optimally selected rank statistics, we determined the ideal NPAR cutoff point corresponding to the most significant correlation with the prognosis with the “maxstat” package. Participants were then divided into groups based on NPAR, higher and lower. To illustrate the possibly nonlinear relationship between the NPAR and both diabetes-cause and all-cause mortality in people with diabetes, a restricted cubic spline (RCS) with three knots was used.
The Kaplan–Meier method was utilized to compute the probabilities of survival outcomes, and the log-rank test was employed to compare them. Using the “timeROC” program, a time-dependent receiver–operator characteristic curve (ROC) analysis was performed to assess the NPAR's accuracy in predicting survival outcomes at various time points. R 4.4.0 and GraphPad Prism 10.0 were used for the statistical analyses. A two-tailed p < 0.05 indicated statistical significance.
3 Result
3.1 Characteristics of the Study Population
Table 1 shows the characteristics of the study population. The current study included 3858 individuals with diabetes as volunteers. Participants were divided into two groups: the higher group (NPAR > 14.4, n = 1891) and the lower group (NPAR ≤ 14.4, n = 1967) based on the optimal NPAR cutoff value (14.4), which corresponded to the most significant connection with survival adopted based on optimally selected rank statistics. The participants in the higher NPAR group were older, had a shorter mean follow-up period, were more likely to have coronary heart disease, and were less likely to have NAFLD (Table 1). Moreover, diabetes patients with high NPAR had higher levels of serum creatinine, BUN, and HbA1c, and had lower levels of eGFR, TC, and HDL than those patients with low NPAR (Table 1).
| Variable | Total (n = 3858) | High NPAR (n = 1967) | Low NPAR (n = 1891) | p |
|---|---|---|---|---|
| Age (mean [SD]) | 61.95 (13.02) | 62.60 (13.43) | 61.27 (12.54) | 0.001 |
| Follow-up time (mean [SD]) | 7.86 (5.21) | 7.24 (4.97) | 8.50 (5.38) | < 0.001 |
| Gender (%) | ||||
| Male | 2224 (57.6) | 1120 (56.9) | 1104 (58.4) | 0.382 |
| Female | 1634 (42.4) | 847 (43.1) | 787 (41.6) | |
| Race (%) | ||||
| Non-Hispanic White | 1680 (43.5) | 866 (44.0) | 814 (43.0) | 0.143 |
| Non-Hispanic Black | 792 (20.5) | 381 (19.4) | 411 (21.7) | |
| Mexican American | 876 (22.7) | 468 (23.8) | 408 (21.6) | |
| Others | 510 (13.2) | 252 (12.8) | 258 (13.6) | |
| Education levels (%) | ||||
| Below high school | 1349 (35.0) | 686 (34.9) | 663 (35.1) | 0.966 |
| High school | 879 (22.8) | 446 (22.7) | 433 (22.9) | |
| Above high school | 1630 (42.2) | 835 (42.5) | 795 (42.0) | |
| Family income–poverty ratio (%) | ||||
| ≤ 1.0 | 853 (22.1) | 439 (22.3) | 414 (21.9) | 0.096 |
| 1.0–3.0 | 1798 (46.6) | 943 (47.9) | 855 (45.2) | |
| > 3.0 | 1207 (31.3) | 585 (29.7) | 622 (32.9) | |
| Scr, μmol/L (mean [SD]) | 1.04 (0.74) | 1.11 (0.91) | 0.97 (0.51) | < 0.001 |
| BUN, mmol/L (mean (SD)) | 16.74 (8.46) | 17.90 (9.68) | 15.54 (6.77) | < 0.001 |
| eGFR, mL/min/1.73 m2 (mean [SD]) | 78.77 (24.84) | 76.03 (26.40) | 81.62 (22.75) | < 0.001 |
| Albuminuria, (μg/mL) (mean [SD]) | 43.86 (12.13) | 43.85 (11.08) | 43.89 (13.69) | 0.121 |
| HbA1c (mean [SD]) | 7.30 (1.79) | 7.36 (1.79) | 7.25 (1.79) | 0.069 |
| HDL, mmol/L (mean [SD]) | 48.07 (14.43) | 47.22 (13.96) | 48.95 (14.86) | < 0.001 |
| TC, mmol/L (mean [SD]) | 185.09 (45.53) | 181.06 (44.89) | 189.28 (45.83) | < 0.001 |
| BMI, kg/m2 (mean [SD]) | 32.11 (7.49) | 33.07 (8.09) | 31.10 (6.65) | < 0.001 |
| Smoking status (%) | ||||
| Never | 2096 (54.3) | 1066 (54.2) | 1030 (54.5) | 0.015 |
| Former | 660 (17.1) | 308 (15.7) | 352 (18.6) | |
| Current | 1102 (28.6) | 593 (30.1) | 509 (26.9) | |
| Drinking status (%) | ||||
| Heavy | 1590 (41.2) | 794 (40.4) | 796 (42.1) | 0.527 |
| Occasionally | 705 (18.3) | 368 (18.7) | 337 (17.8) | |
| Never | 1563 (40.5) | 805 (40.9) | 758 (40.1) | |
| Physical activity (%) | ||||
| Vigorous | 1489 (38.6) | 757 (38.4) | 737 (39.0) | 0.682 |
| Moderate | 1146 (29.7) | 584 (29.7) | 552 (29.2) | |
| Less than moderate | 1223 (31.7) | 626 (31.8) | 602 (31.8) | |
| Hypertension (%) | ||||
| Yes | 2621 (67.9) | 1347 (68.5) | 1274 (67.4) | 0.482 |
| No | 1237 (32.1) | 620 (31.5) | 617 (32.6) | |
| NAFLD (%) | ||||
| Yes | 1349 (35.0%) | 656 (33.4%) | 693 (36.6%) | 0.021 |
| No | 2509 (65.0%) | 1311 (66.6%) | 1198 (63.4%) | |
| Coronary heart disease (%) | ||||
| Yes | 468 (12.1) | 275 (14.0) | 193 (10.2) | < 0.001 |
| No | 3390 (87.9) | 1692 (86.0) | 1698 (89.8) | |
- Abbreviations: BMI, body mass index; BUN, blood urea nitrogen; CVD, cardiovascular disease; eGFR, estimated glomerular filtration rate; HbA1c, glycosylated hemoglobin, type A1C; HDL, high-density lipoprotein cholesterol; LDL, low-density lipoprotein cholesterol; NAFLD, nonalcoholic fatty liver disease; NPAR, neutrophil percentage-to-albumin ratio; Scr, serum creatinine; SD, standard deviation; TC, total cholesterol.
3.2 Associations Between NPAR and All-Cause and Diabetes-Cause Mortality
Of the 3858 individuals with diabetes, 1198 (31.1%) died over a mean follow-up of 7.86 years; of these, 326 (8.4%) had diabetes-related deaths and 872 (22.6%) had deaths from other causes. In patients with diabetes, RCS analysis revealed a positive linear correlation (nonlinear p = 0.061) between the NPAR and all-cause mortality (Figure 2A). We found that the risk of all-cause mortality in the unadjusted model (Crude Model) increased considerably with an increase in the NPAR value (HR = 1.11, 95% CI: 1.08–1.12, p < 0.001) (Table 2). These impressive results still hold after multivariate correction for some or all of the clinical variables (Table 2). The higher NPAR group had a significantly higher risk of all-cause mortality in both the crude model (HR = 1.58, 95% CI: 1.41–1.77, p < 0.001), adjusted models 1 (HR = 1.44, 95% CI: 1.30–1.62, p < 0.001), and adjusted models 2 (HR = 1.37, 95% CI: 1.22–1.52, p < 0.001), according to Cox regression analysis (Table 2). We found similar results when analyzing diabetes-cause deaths (Figure 2B and Table 2).

| Characteristics | Crude model | Model 1 | Model 2 | |||
|---|---|---|---|---|---|---|
| HR (95% CI) | p | HR (95% CI) | p | HR (95% CI) | p | |
| All-cause mortality | ||||||
| NPAR | 1.10 (1.08–1.12) | < 0.001 | 1.10 (1.08–1.12) | < 0.001 | 1.09 (1.07–1.10) | < 0.001 |
| NPAR category | ||||||
| Low NPAR group | Ref. | Ref. | Ref. | |||
| High NPAR group | 1.58 (1.41–1.77) | < 0.001 | 1.44 (1.30–1.62) | < 0.001 | 1.37 (1.22–1.52) | < 0.001 |
| Diabetes-cause mortality | 1.13 (1.09–1.17) | < 0.001 | 1.13 (1.09–1.18) | < 0.001 | 1.10 (1.06–1.14) | < 0.001 |
| NPAR category | ||||||
| Low NPAR group | Ref. | Ref. | Ref. | |||
| High NPAR group | 1.82 (1.46–2.28) | < 0.001 | 1.73 (1.39–2.20) | < 0.001 | 1.58 (1.26–1.97) | < 0.001 |
- Note: Crude model, unadjusted; Model 1, adjusted for age, gender, education levels, race, family income–poverty ratio, body mass index, smoking status, drinking status, and physical activity; Model 2, adjusted for age, gender, education levels, race, family income–poverty ratio, body mass index, smoking status, drinking status, physical activity, serum creatinine, blood urea nitrogen, albuminuria, estimated glomerular filtration rate, HbA1c, high-density lipoprotein cholesterol, total cholesterol, nonalcoholic fatty liver disease, hypertension, and coronary heart disease.
- Abbreviation: NPAR, neutrophil percentage-to-albumin ratio.
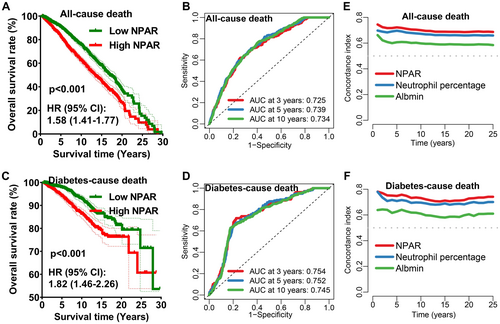
Compared with low NPAR group, high NPAR group had a low survival rate of diabetes cases in all-cause death (Figure 3A, HR = 1.58, p < 0.001) with area under the curve (AUC) of the ROC curve being 0.725, 0.739, and 0.734 for 3-year, 5-year, and 10-year all-cause mortality (Figure 3B), respectively. Moreover, Kaplan–Meier survival rates for diabetes-cause mortality also suggested a lower survival rate in the high NPAR group, (Figure 3C) with the AUC of the 3-year, 5-year, and 10-year ROC curve being 0.754, 0.752, and 0.745 (Figure 3D), respectively. The concordance index of NPAR for the all-cause death (Figure 3E) and diabetes-cause death (Figure 3F) was higher than that of neutrophil percentage and albumin. According to these findings, the NPAR seems to have a reliable short- and long-term prognostic value for both all-cause and diabetes-cause death.

4 Discussion
This large-sample study looked into the relationship between the NPAR and diabetes patients' survival outcomes with 3858 participants with diabetes from NHANES database (1998–2018). The results showed that an elevated NPAR was linked to poor survival in all-cause death and diabetes-cause death among. These impressive results hold after multivariate correction for some or all of the clinical variables.
Peripheral blood leukocyte counts, particularly neutrophil counts as measured by the NPAR, are a cheap and popular way to determine whether inflammation is present. More than half of the content of human serum is made up of albumin, a medium-sized housekeeping protein with a variety of uses, including osmoregulation, antioxidation, and anti-inflammatory properties. In addition to decreased albumin synthesis, diseases like cirrhosis are linked to particular changes in the structure and function of the protein [18, 19]. When predicting systemic inflammation in patients with acute kidney damage, septic shock, and palliative pancreatic cancer [20, 21], the NPAR—which combines the NPAR and albumin—is employed. Additionally, patients with liver cirrhosis and atrial fibrillation had an association between the NPAR and mortality [13, 22].
Numerous diabetes complications, including vascular problems and diabetic nephropathy, can be caused by inflammatory diseases [23, 24]. It is believed that diabetes-related chronic inflammatory response leads to leukocyte recruitment into the vascular milieu and oxidative stress-induced endothelial damage [25]. High-sensitivity C-reactive protein (hs-CRP) measurements indicate a systemic low-grade inflammatory condition, which has been shown to be a significant predictor of cardiovascular problems and all-cause death [26]. As inflammation appears to be a significant factor contributing to the occurrence and progression of diabetes-related complication, the NPAR is anticipated to function as a predictor for diabetes patients' risk stratification. When confounding variables were taken into account, our analysis revealed that, in 3858 diabetes patients, a higher NPAR is related with diabetes-cause and all-cause death. The underlying process may be that decreasing albumin contributes to a drop in immunological defense, which, in turn, causes an individual's immunity and ability to resist disease to decline [27, 28] and that an increase in neutrophils might exacerbate chronic inflammation [29, 30].
Our study's primary strength is the enormous sample size and extended follow-up period that allowed for valid results and adequate statistical power. Additionally, there was no selection bias because every person was a participant in the NHANES study. There are a few restrictions to be aware of, though. Firstly, the chance that the NPAR is influenced by other unknown factors cannot be ruled out, even though we corrected for a number of potential confounding factors in our analysis. Second, people in the US who have diabetes participated in this study. Moreover, peripheral nerve and microvascular damage, which are an important cause of infection or persistent infection in diabetic patients, could not be obtained from NHANES study. Therefore, more research is required to see whether the conclusion can be applied to other groups.
In summary, we examined 3858 diabetes patients from NHANES database (1998–2018) and suggested NPAR as a biomarker for all-cause and diabetes-cause mortality prediction.
Author Contributions
Yuanyuan Jing was involved in writing the original draft preparation, investigation, and funding acquisition. Bowen Tian contributed to the original draft preparation, investigation, and formal analysis. Wenzhen Deng was involved in data curation. Ziyu Ren contributed to writing – review and editing. Xunmei Xu was involved in conceptualization. Dongmin Zhang was involved in methodology, supervision, and resources. Jing Zeng contributed to project administration, software, and validation. Dongfang Liu was involved in visualization, writing – review and editing, and project administration. All authors reviewed the manuscript.
Ethics Statement
Our study is not involved in the use of human subjects and animals. No ethical approval and informed consents are required.
Consent
The authors have nothing to report.
Conflicts of Interest
The authors declare no conflicts of interest.
Open Research
Data Availability Statement
The original contributions presented in this study are included in the article, further inquiries can be directed to the corresponding author.


