Comparative performance of ELISA and dot blot assay for TSH-receptor antibody detection in Graves’ disease
Zulkarnain Zulkarnain and Zulvikar Syambani Ulhaq contribute equally and share first authorship to this study.
Funding information
This study was supported by the funding from Program Riset Produktif (RISPRO) Komersial LPDP with reference No. KEP-27/LPDP/2020, Ministry of Finance, 2020.
Abstract
Background
Graves’ disease (GD) is an autoimmune disease, and it accounts for major cases of hyperthyroidism. Antibody against thyroid-stimulating hormone receptor/TSHR (TRAb) is responsible for hyperthyroidism and is considered as a diagnostic marker for GD. Therefore, we developed a recombinant protein of human TSHR-169 (hTSHR-169), which was specifically recognized TRAb in the serum of GD patients and then compare the diagnostic performance between ELISA and dot blot of TRAb tests for their ability to diagnose GD.
Methods
20 GD patients and 20 healthy individuals from the Indonesian population were enrolled. TRAb concentration and density were quantified. Comparative analysis was performed using receiver-operating curve (ROC) analysis.
Results
For dot blot assay, the minimum concentration to detect TRAb requiring 100 ng of antigen with antiserum diluted at 1:60. For diagnosing GD, the ELISA yielded a higher AUC compared with the dot blot assay (0.95 and 0.85, respectively). Using the recommended cutoff values, the efficiency of both assays was examined by comparing the specificity and sensitivity of the assays to the clinical diagnosis. The ELISA showed 80% and 95%, while the dot blot assay showed 70% and 95% sensitivity and specificity, respectively.
Conclusion
Although the dot blot assay exhibited lower performance than the ELISA method, the dot blot assay is a simple and rapid diagnostic assay that is suitable for diagnosing GD in rural areas, in which healthcare facilities sometimes are not accessible.
1 INTRODUCTION
Graves’ disease (GD) is a chronic autoimmune disorder of the thyroid gland, affecting nearly 0.5% of the general population, with a higher incidence among females relative to males.1, 2 Clinically, GD is characterized by the suppression of TSH levels, overstimulation of thyroid hormones, and the production of antithyroid antibodies.1, 3 It is now well established that thyroid-stimulating hormone receptor autoantibody (TRAb) is the serological hallmark of GD,4 which is usually helpful in differentiating GD from other causes of hyperthyroidism. Additionally, the role of TRAb is not only in confirming GD diagnosis but also potential in predicting the clinical course of GD, relapse risk, and treatment responses.1, 3, 5
Although TRAb is easy to perform, the measurement of TRAb levels is not routinely employed in all suspected GD patients. Hence, studies examining TRAb levels during the initial diagnosis of GD are relatively scarce. The diagnostic performance of TRAb for GD differs according to the TRAb detection method. However, the sensitivity and specificity of TRAb assay are relatively comparable, ranging from 79.5 to 94.4% and 87.5 to 97.9%, respectively.1, 4 Therefore, in this study, we developed a recombinant protein of hTSHR-169, which was specifically recognized TRAb from the serum of GD patients, in order to generate lateral flow-based immunoassay for diagnosing GD case. However, this particular recombinant’s utility for GD diagnosis has not been assessed. Herein, we compared ELISA and dot blot of TSH-receptor antibody tests for their ability to diagnose GD.
2 METHODS
2.1 Molecular cloning and development of recombinant hTSHR-169 protein
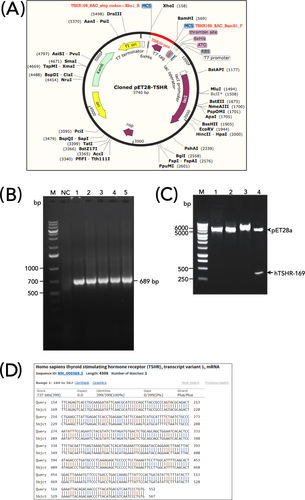
Construct of hTSHR-169 cDNA was synthetically made through GBlock gene fragments (Ref. No. 100031579, Integrated DNA Technologies) consisting of 417 oligonucleotide bases that was optimized according to our previous work.6 The construct was designed by adding BamH1 and Xho1 restriction sites at the N-terminus and C-terminus, respectively. The construct was then subcloned into a pET28a vector (Novagen). Briefly, pET28a (+) vector and hTSHR-169 cDNA fragment were digested with the same restriction enzyme (BamHI and XhoI, New England Biolabs) at 37°C for 1 h. The digested pET28a (+) vector backbone and the fragment cut from hTSHR-169 cDNA were purified by Gel/PCR DNA Fragments Extraction Kit (Geneaid). The hTSHR-169 fragment and pET28a (+) vector backbone were ligated by T4 DNA ligase enzyme (New England Biolabs) at 16°C for 75 min. The ratio of vector ends and inserts ends is 1:5. The recombinant plasmid map is illustrated in Figure 1A.

Thirty nano gram of ligation reaction was transformed into 50 µl E. coli DH5α (Subcloning Efficiency™ DH5α Competent Cells, Invitrogen) on ice for 10 min, followed by incubation at 42°C for 45 s. The mixture was then added with 800 μl Luria-Bertani (LB) medium and incubated for 1 h at 37°C at 150 rpm shaking speeds. The cell suspension was centrifuged at 3000 g for 2 min (4°C), and pellets were resuspended in 100 µl LB, spread on an LB plate containing 50 µg/ml kanamycin, and incubated at 37°C overnight. The presence of inserts was confirmed by blue/white screening, followed by PCR utilizing pET universal primers (pET T7 promoter: 5′-TAATACGACTCACTATAGGG-3′; pET T7 terminal: 5′-GCTAGTTATTGCTCAGCGG-3′), with the amplification condition as follows: initial denaturation at 95°C for 2 min, followed by 35 cycles of final denaturation at 95°C for 30 s, annealing at 50.9°C for 30 s, and extension at 72°C for 45 s with final extension for 5 min at 72°C. The PCR results were evaluated in 1% agarose gel, resulting in a PCR product of 689 base pairs (bp) (Figure 1B).
In addition, recombinant clones were also confirmed by double digestion strategy. In short, after the plasmid was extracted using Fast-n-Easy Plasmid Mini-Prep Kit (Jena Bioscience), the plasmid was then digested using BamHI and XhoI (New England Biolabs) and visualized in 1% agarose gel (Figure 1C). Later, recombinant plasmid (pET28a-hTSHR-169) was sent for DNA sequencing analysis. The obtained sequence was then analyzed using Nucleotide Basic Local Alignment Searching Tool (BLAST) at http://blast.ncbi.nlm.nih.gov/, and the result was shown in Figure 1D.
2.2 Expression of the hTSHR-169 by IPTG induction
Five milli litre of the overnight culture of E. coli BL21 (DE3) (One Shot™ BL21(DE3) Chemically Competent E. coli, Invitrogen) containing the expression construct was inoculated into 500 ml LB medium supplemented with 50 µg/ml kanamycin, incubated at 37°C with vigorous shaking (150 rpm) until the cells reached OD 0.8–1.0 at 600 nm. The culture was then induced with 0.1 mM IPTG at 37°C. After induction, cell pellets were collected by centrifugation at 6000 rpm for 15 min and used for further experiments.
2.3 The hTSHR-169 purification from soluble fraction (cytosolic)
Purification of hTSHR-169 from cytosolic fraction was performed according to Protino® Ni-TED 2000 packed columns kit (Macherey-Nagel) instruction. Briefly, 1 g of cell pellets obtained after IPTG induction was diluted in 5 ml of Lysis-Equilibration-Wash buffer (LEW buffer (50 nM NaH2PO4, 300 mM NaCl, pH 8.0), and then, the cells were lysed with a combination of lysozyme (at a final concentration of 1 mg/ml for 30 min) and sonication on ice for 10 cycles (at 200 W, 15 s bursts with a 15 s cooling period between each burst). Cell debris was removed by centrifugation at 12,000 rpm for 30 min (4°C), and the supernatant was collected. For purification of soluble fraction, Protino® Ni-TED Packed Column (14 ml, containing 500 mg resin) was equilibrated with 4 ml of 1x LEW buffer. Then, 4 ml of supernatant was loaded onto the column. Flow-through (F) was collected, and bound proteins were then washed with 4 ml of 1x LEW buffer twice, eluted three times with 3 ml of elution buffer (50 mM NaH2PO4, 300 mM NaCl, and 250 mM imidazole, pH 8.0), stored and used for SDS-PAGE and Western blot experiments. Protein concentration of the purified hTSHR-169 was determined using NanoDrop UV-Vis spectrophotometers at 280 nm.
2.4 SDS-PAGE and Western blot experiments
Purified hTSHR-169 proteins from cytosolic fractions were dissolved in reducing sample buffer (31.5 mM Tris-HCl pH 6.8, 10% glycerol, 1% SDS, 0.005% bromophenol blue, and 5% 2-mercaptoethanol). 10 µl of samples (containing 10 µg of protein) were loaded in 12% acrylamide gel and separated by SDS-PAGE (150 V). For Western blotting, samples were separated by SDS-PAGE and then transferred onto the nitrocellulose membrane (NCM). After blocking by 5% skim milk for 2 h, the membrane was incubated with serum obtained from healthy control/GD patient or mouse monoclonal anti-TSHR antibody (1:200, sc-515556, Santa Cruz Biotechnology) overnight at 4°C, followed by incubation with the secondary antibody conjugated with alkaline phosphatase (AP) (1:1000, SeraCare) at room temperature for 1 h. The signals were visualized with BCIP/NBT substrate.7, 8
2.5 Patients and sample collection
Serum samples of GD patients (n = 20) attending a private clinic of endocrine and metabolic disorders, Malang, Indonesia, were recruited for the study. Twenty healthy subjects were included as controls. GD diagnosis was confirmed on the basis of clinical symptoms, biochemical confirmation of hyperthyroidism (Table 1), as well as additional diagnostic information, including goiter, ophthalmology, and thyroid ultrasound. The study was approved by the local ethics committee (Ref. No.221/EC/KEPK-S3/6/2017) and adhered to the tenets of the Declaration of Helsinki. All enrolled patients were fully informed, and written informed consent was obtained from all individuals at the beginning of the study.
| Characteristics | Normal range | GD | HC |
|---|---|---|---|
| n (female) | – | 20 (16) | 20 (12) |
| Age (mean ± SD) | – | 40.55 ± 12.48 | 42.2 ± 12.25 |
| TSH mIU/L (mean ± SD) | 0.34–5.11 | 0.017 ± 0.015 | nd |
| fT4 ng/dl (mean ± SD) | 0.98–1.79 | 4.57 ± 3.32 | nd |
| fT3 ng/dl (mean ± SD) | 81–178 | 257.91 ± 106.91 | nd |
- Abbreviations: GD, Graves’ disease; HC, healthy control; nd, not determined; SD, standard deviation.
2.6 TRAb assay
TRAb concentration was detected using human TSHR-Ab ELISA Kit (Elabscience) according to the manufacturer’s instructions, with the analytical range from 0.63 to 40 ng/ml.
2.7 Dot blot assay
The dot blot assay was performed according to the previously reported study.9 Briefly, 2 μl of antigen (recombinant hTSHR-169 protein) was spotted onto a NCM. The NCMs were air-dried and blocked in 5% skimmed milk/PBS, pH 7.4 for 30 min. The membrane was then incubated with 20 μl of patient's serum overnight. After several washing times, the membrane was incubated with anti-human IgG (H+L) reserve AP-labeled antibody (1:2000) for 1 h. Colors were developed in BCIP/NBT substrate for 10–15 min. Blots containing only antigen or serum were served as a negative control to subtract from the density obtained with the patient’s antiserum. Density of the blots was quantified utilizing NIH ImageJ software.
2.8 ELISA and dot blot cutoff point determination
The values of both parameters were used to generate receiver-operating characteristic (ROC) curves using Graphpad Prism ver. 8 in order to determine the AUC. The optimal cutoff for parameters with a significant p-value (two-sided) was determined using the Youden’s index.
2.9 Statistical analysis
Statistical analysis was performed using Medcalc stats (https://www.medcalc.org/calc/diagnostic_test.php), and Cohen’s kappa coefficient (κ) was calculated using the Graphpad Prism QuickCalcs website (https://www.graphpad.com/quickcalcs/kappa1/).10 The independent sample t-test was used to determine statistically significant differences of independent samples in two groups using IBM SPSS statistics version 19.
3 RESULTS
3.1 Recombinant protein of hTSHR-169
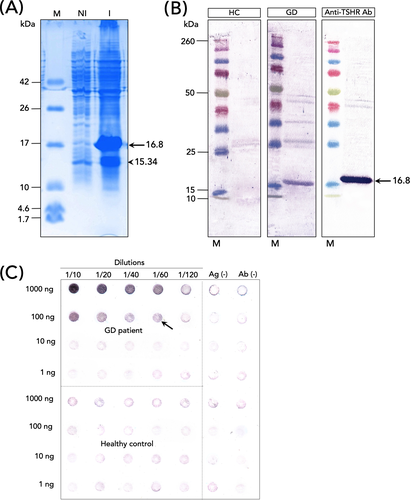
The predicted molecular weight of the target protein was 16.8 kDa, and the expression level of the fusion protein was increased after IPTG induction (Figure 2A, arrow). However, two bands (16.8 and 15.34 kDa (Figure 2A, arrow head)) were detected in the soluble fraction, implying that the smaller size band could be a degradation product of our target protein. This is supported by the finding that the smaller protein size was mainly removed after the purification process (see eluted fraction in Figure S1).

Purified hTSHR-169 protein’s antigenicity was examined with serum collected from healthy subject/GD patient and anti-TSHR. No signals were detected when the membrane was incubated with serum collected from a healthy subject (Figure 2B). A single band at the expected size (16.8 kDa) was observed when the membrane was incubated with anti-TSHR antibody (Figure 2B). Similarly, when the membrane was incubated with serum collected from a patient with GD, a signal at 16.8 kDa size was also detected (Figure 2B). The expression level of the target protein observed in GD serum was lower than positive control (anti-TSHR antibody) (Figure 2B). However, it should be note that this result is dependent on the amount of TRAb produced by GD individuals.
3.2 Optimization of dot blot assay
To determine the minimum concentration of antigen and antiserum for TRAb detection, the antigen (raging from 1 to 1000 ng) was tested with the antiserum from both GD and control groups in a twofold serial dilution (ranging from 1:10 to 1:120) (Figure 2C). The minimum concentration required to detect TRAb was observed in 100 ng of antigen with antiserum diluted at 1:60 (Figure 2C, arrow). This result was then used for further evaluation.
3.3 TRAb levels and immunoreactivity
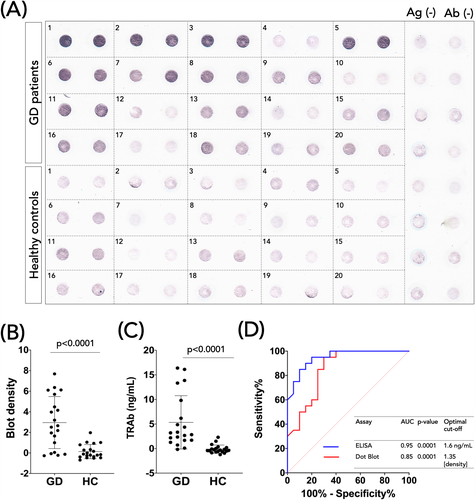
The dot blot analysis of both GD and controls groups is depicted in Figure 3A. The dot blot analysis also revealed that GD individuals significantly increased TRAb immunoreactivity compared to the healthy subjects (Figure 3B), which was also confirmed by ELISA (Figure 3C).

3.4 Receiver-operating characteristic curve analysis
To compare TRAb detection from ELISA and dot blot assay on a quantitative level, ROC curve analysis was employed (Figure 3D). The AUC of the TRAb ELISA was higher than the TRAb dot blot (0.95 vs. 0.85). Based on this analysis, optimal cutoff values were determined for the TRAb ELISA and Dot blot: 1.6 ng/ml and 1.35 (density), respectively (Figure 3D).
3.5 Diagnostic performance
According to the optimized cutoff values, TRAb positives were determined, and the performances of the ELISA and dot blot assay were then calculated. The sensitivity and specificity of the ELISA were 80% (CI 95%: 56.34–94.27%) and 95% (75.13–99.87%) (Table 2), respectively. In comparison, the sensitivity and specificity of the dot blot were 70% (42.72–88.11%) and 95% (75.13–99.87%) (Table 2), respectively. Both assays showed a good agreement with the clinical diagnosis, with a Kappa index of 0.75 and 0.65 (Table 2) for the ELISA and dot blot assay, respectively.
| Clinical diagnosis | |||
|---|---|---|---|
| Assay | Positive | Negative | |
| ELISA ≥1.6 ng/mla | Positive | 16 | 1 |
| Negative | 4 | 19 | |
| Total | 20 | 20 | |
| Sensitivity % (95% CI) | 80% (56.34–94.27%) | ||
| Specificity % (95% CI) | 95% (75.13–99.87%) | ||
| Likelihood ratio +ve (LR+) (95% CI) | 16 (2.34–109.45) | ||
| Likelihood ratio −ve (LR−) (95% CI) | 0.2 (0.09–0.51) | ||
| κ (95% CI) | 0.75 (0.55–0.95) | ||
| SE of κ | 0.10 | ||
| Dot blot ≥1.35 (Density)a | Positive | 14 | 1 |
| Negative | 6 | 19 | |
| Total | 20 | 20 | |
| Sensitivity % (95% CI) | 70% (42.72–88.11%) | ||
| Specificity % (95% CI) | 95% (75.13–99.87%) | ||
| Likelihood ratio +ve (LR+) (95% CI) | 14 (2.03–96.63) | ||
| Likelihood ratio −ve (LR−) (95% CI) | 0.32 (0.16–0.62) | ||
| κ (95% CI) | 0.65 (0.42–0.88) | ||
| SE of κ | 0.12 | ||
- Abbreviations: κ, Kappa; SE, standard error.
- a Cutoff values obtained by receiver-operating characteristic curve analysis.
4 DISCUSSION
Thyrotoxicosis, most often caused by GD, potentially caused severe symptoms and is associated with premature mortality, primarily related to cardiovascular events.11 Due to its progressiveness, early detection of the disease is vital to identify affected individuals and to prevent or reduce the risk of having a severe case of GD. Therefore, the development of rapid and cost-effective methods for screening and monitoring GD progression is indispensable. Thus, in this study, we had developed a membrane-based dot blot assay for TRAb immunodetection utilizing recombinant hTSHR-169. Additionally, we also compared the ELISA and dot blot assay performance as diagnostic tests for GD.
Our results demonstrated that the dot blot assay has a lower diagnostic sensitivity in comparison with the ELISA in detecting TRAb based on recommended cutoff values. However, both assays displayed higher specificity (95%), thereby implying that the dot blot assay is precisely recognized TRAb and the ELISA method. Moreover, both assays also exhibited the Kappa values fall under the interpretation of substantial agreement (0.61–0.80),12 suggesting that the recombinant hTSHR-169 is a promising method for GD diagnosis. Although the ELISA performed much better than the dot blot assay, the latter method is much simpler and faster. Thus, the dot blot assay can be used as a preliminary screening for GD identification, particularly in low resources settings, where laboratory facility is unreachable.
The weakness of our study is a limited sample size, which may influence the sensitivity result. Thus, further investigation with larger participants is required to evaluate the diagnostic performance of recombinant hTSHR-169. Besides, lowering the cutoff point of the dot blot assay may be required to increase the test’s sensitivity. The dot blot optimization such as antigen and antibody concentration as well as incubation time is necessary.
In conclusion, the standardized dot blot assay in this study had a good agreement with the tests used for comparison, managing to detect antibodies against TSH receptor in human serum, thereby implicating that the dot blot of recombinant hTSHR-169 shows a great potential to be used for the early identification of GD in remote areas, such as in the outer islands of Indonesia, as the assay is cheaper, quicker, and easier to perform and interpret. Furthermore, the development of lateral flow-based immunoassay utilizing recombinant hTSHR-169 in the future would be beneficial in supporting a comprehensive healthcare system, which is available and economically accessible to all.
ACKNOWLEDGMENT
We would like to thank the following people for helping with this research project: Perdana Finawati Putri, Wahyu Nur Laili Fajri, Anita Herawati, Susiati, Yulianto Muji Nugroho, Syahriar Andinata, and Sanudi.
CONFLICT OF INTEREST
None to declare.
AUTHOR CONTRIBUTIONS
AA, ZU, and ZZ involved in conception and design of study. ZZ, ZU, HS, DS, HZ, DW, AM, WR, SK, and YO involved in acquisition of data. ZU involved in analysis and/or interpretation of data, drafting the study, and revising the study critically for important intellectual content. ZZ, ZU, HS, DS, HZ, DW, AM, WK, SK, YO, and AA involved in approval of the version of the study to be published.
Open Research
DATA AVAILABILITY STATEMENT
Data are available within the article and its supplementary materials.


