Blood MALT1, Th1, and Th17 cells are dysregulated, inter-correlated, and correlated with disease activity in rheumatoid arthritis patients; meanwhile, MALT1 decline during therapy relates to treatment outcome
Abstract
Objective
Mucosa-associated lymphoid tissue lymphoma translocation protein 1 (MALT1) participates in inflammatory and autoimmune diseases via activating various signaling pathways and promoting the differentiation of T-helper (Th) 1 and Th17 cells; however, it is rarely reported in rheumatoid arthritis (RA). This study aimed to assess the correlation of MALT1 with Th1 and Th17 cells and evaluate its potential as a biomarker for evaluating disease activity and treatment outcomes in RA patients.
Methods
This study enrolled 139 RA patients and 45 health controls (HCs); then, blood MALT1, Th1, and Th17 cells were determined. For RA patients only, blood MALT1 at week (W) 6 and W12 after treatment was also detected. Additionally, clinical response and remission of RA patients were assessed at W12.
Results
MALT1 (p < 0.001), Th1 (p = 0.011), and Th17 (p < 0.001) cells were all increased in RA patients than HCs; meanwhile, increased MALT1 was associated with elevated Th1 (p = 0.003) and Th17 (p < 0.001) cells in RA patients. Besides, MALT1, Th1, and Th17 cells were positively correlated with parts of disease activity indexes in RA patients (all p < 0.050). In addition, MALT1 was gradually declined from W0 to W12 (p < 0.001) in RA patients. Specifically, MALT1 at W6 and W12 was lower in response patients than no response patients (both p < 0.010), also in remission patients than no remission patients (both p < 0.050).
Conclusion
MALT1, Th1, and Th17 cells are dysregulated, inter-correlated, and correlated with disease activity in RA patients; meanwhile, the decline of MALT1 expression can partly reflect RA treatment response and remission.
1 INTRODUCTION
Rheumatoid arthritis (RA) is a systemic autoimmune disease characterized by synovitis, which is one of the most common forms of inflammatory arthritis affecting almost 1% of the population.1-4 Although only inflamed joint capsule occurs initially, bone erosion, cartilage, joint deformity, and other severe comorbidities appear with the progression of RA, which further causes disability, incapacity of work, and reduced quality of life.5-7 Even though many treatments have been applied to control symptoms and to prevent the development of disability in RA patients, such as non-steroidal anti-inflammatory drugs (NSAIDs), conventional synthetic disease-modifying anti-rheumatic drugs (DMARDs), glucocorticoids (GC), and biologic DMARDs (including tumor necrosis factor [TNF]-α inhibitors, interleukin-6 inhibitor [IL-6i]), many patients still cannot respond adequately to these treatments.1, 8-15 Therefore, it is necessary to explore new markers to monitor the treatment response and progression of RA, subsequently realizes the risk stratification and help clinical supervision to improve the prognosis in RA patients.
Mucosa-associated lymphoid tissue lymphoma translocation protein 1 (MALT1), widely expressed in multiple cell types, is a caspase homologue and an intracellular signaling protein.16-18 As a crucial regulator, MALT1 activates nuclear factor-kappa-B (NF-κB) signaling pathway to induce signaling-mediated macrophage activation and further promotes the inflammatory response.19, 20 In addition, MALT1 is involved in inducing and promoting the differentiation of T-helper 1 (Th1) and T-helper 17 (Th17) cells, which aggravates many inflammatory and autoimmune diseases.21-24 Besides, considering that RA is a chronic autoimmune disease, we assumed that MALT1 might serve as a novel biomarker for RA. However, there is no clinical study verifying the hypothesis.
Hence, this study detected blood MALT1 expression in RA patients at baseline (W0), week (W) 6, and W12 after initiation of the treatments, aiming to assess the correlation of MALT1 with Th1 and Th17 cells and to evaluate its potential as a biomarker of disease activity and treatment outcomes in RA patients.
2 MATERIALS AND METHODS
2.1 Subjects
This prospective study was carried out in 139 patients with active RA who were treated in our hospital from February 2018 to January 2021. The recruitment criteria were as follows: (i) diagnosis of RA according to the 2010 rheumatoid arthritis classification criteria25; (ii) more than 18 years old; (iii) disease activity score of 28 joints-erythrocyte sedimentation rate (DAS28-ESR) over 3.2; (iv) fully understood the study contents and willing to provide peripheral blood (PB) samples for study use. The patients who were concomitant with other inflammatory diseases, immune system diseases, active infections, cancers, or malignancies were excluded from the study. The patients during pregnancy or lactation were not included as well. At the same time, the study also enrolled another 45 healthy subjects as health controls (HCs), who were matched for age and gender to RA patients to eliminate the potential sources of bias. The age of HCs was set as 40–70 years old, and the gender ratio of HCs was set as 4:1 (female: male). Written informed consents were obtained from all subjects. The study was approved by the Institutional Research Ethics Committee.
2.2 Treatment
Based on the patients’ actual condition, different treatment regimens were implemented for the corresponding patients. A total of 109 RA patients received conventional disease-modifying antirheumatic drug (cDMARD) as either monotherapy or combination treatment; another 30 RA patients received biologics-based regimen, including IL-6i and tumor necrosis factor inhibitor (TNFi), combined with or without cDMARD treatment.
2.3 Sample preparation
PB samples were obtained from RA patients, at baseline (W0), then at week 6 (W6) and week 12 (W12) after initiation of the treatment. Besides, PB samples were obtained from HCs after recruitment as well. After sample collection, peripheral blood mononuclear cells (PBMCs) were separated by gradient density centrifugation for the following analysis.
2.4 Reverse transcription quantitative polymerase chain reaction (RT-qPCR) assay
RT-qPCR assay was used to detect the expression of MALT1 in PBMCs of RA patients at W0, W6, and W12 as well as of HCs at recruitment. Total RNA was extracted by RNeasy Protect Mini Kit (Qiagen, Duesseldorf, Nordrhein-Westfalen, Germany); then, reserve transcription was completed using PrimeScript™ RT reagent Kit (Takara, Dalian, Liaoning, China). After that, qPCR was achieved by SYBR® Premix DimerEraser™ (Takara, Dalian, Liaoning, China). qPCR primers were designed referring to previous studies.26 MALT1 relative expression was calculated by 2−ΔΔCt method using GADPH as internal reference.
2.5 Flow cytometry
The Th1 cells/(CD4+ T cells, %) and Th17 cells / (CD4+ T cells, %) in PB from RA patients at W0 and from HCs at recruitment were detected by flow cytometry analysis using HumanTh1/Th17 Phenotyping Kit (Becton, Dickinson and Company, Franklin Lake, New Jersey, USA). The experimentation was established according to a previous study.27
2.6 Assessment of clinical response and clinical remission
At W6 and W12 after initiation of the treatment, clinical response and clinical remission were assessed in line with the criteria for rheumatoid arthritis using DAS28-ESR score28: clinical response was defined as a decline of DAS28-ESR score over 1.2; clinical remission was defined as DAS28-ESR score below 2.6. According to the DAS28-ESR score at W12, all RA patients were classified as response and no response patients as well as remission and no remission patients.
2.7 Statistical analysis
Normal distributed continuous variable was expressed as mean ± standard deviation (SD), skewed distributed continuous variable was expressed as median (confidence interquartile), and categorized variable was expressed as count (percentage). Mann-Whitney U test was used to compare continuous variables between groups. Spearman's rank correlation test was used to analyze the correlation between continuous variables. Friedman's test was used to assess the change of MALT1 expression over time. A p value < 0.05 was supposed as statistically significant. All above statistical analyses and graph plotting were carried out using SPSS 24.0 (IBM Corp., Armonk, New York, USA) and GraphPad Prism 6.01 software (GraphPad Software Inc., San Diego, California, USA), respectively.
3 RESULTS
3.1 Study flow
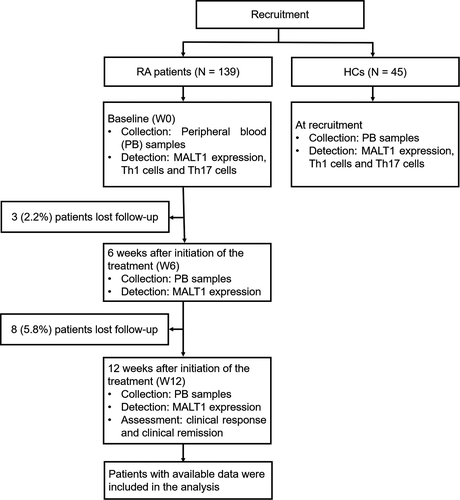
After the enrollment of 139 RA patients and 45 HCs, their PB samples were collected to detect their MALT1 expression, Th1 cells, and Th17 cells (Figure 1). For RA patients only, 3 (2.2%) patients lost follow-up during 6-week treatment, while 8 (5.8%) patients lost follow-up during subsequent 6-week treatment. PB samples were collected to detect MALT1 expression at both W6 and W12 after initiation of the treatment. Additionally, clinical response and clinical remission were assessed at W12. Lastly, patients with available data were included in the analysis.
3.2 RA patients’ characteristics
The mean age of RA patients was 55.8 ± 9.9 years with 110 (79.1%) females and 29 (20.9%) males in this study (Table 1). The number of RA patients with rheumatoid factor (RF) positive was 111 (79.9%), while 28 (20.1%) RA patients were RF negative. Besides, there were 85 (61.2%) RA patients with anti-cyclic citrullinated peptide antibody (ACPA) positive and 54 (38.8%) RA patients with ACPA negative. In addition, the mean DAS28-ESR score was 5.1 ± 0.7. Furthermore, 109 (78.4%) RA patients received cDMARD, while 30 (21.6%) accepted biologics-based regimen. Moreover, the detailed RA patients’ characteristics were listed in Table 1.
| Items | RA patients (N = 139) |
|---|---|
| Age (years), mean ± SD | 55.8 ± 9.9 |
| Gender, No. (%) | |
| Female | 110 (79.1) |
| Male | 29 (20.9) |
| BMI (kg/m2), mean ± SD | 22.8 ± 3.0 |
| Disease duration (years), mean ± SD | 3.5 ± 3.2 |
| RF, No. (%) | |
| Positive | 111 (79.9) |
| Negative | 28 (20.1) |
| ACPA, No. (%) | |
| Positive | 85 (61.2) |
| Negative | 54 (38.8) |
| TJC, median (IQR) | 7.0 (5.0–9.0) |
| SJC, median (IQR) | 6.0 (4.0–9.0) |
| ESR (mm/h), median (IQR) | 31.1 (22.2–46.1) |
| CRP (mg/L), median (IQR) | 25.0 (12.5–42.8) |
| DAS28-ESR score, mean ± SD | 5.1 ± 0.7 |
| HAQ-DI score, mean ± SD | 1.2 ± 0.3 |
| cDMARD (monotherapy or combination), No. (%) | 109 (78.4) |
| Biologics-based regimen (TNFi or IL-6i), No. (%) | 30 (21.6) |
- Abbreviations: ACPA, anti-cyclic citrullinated peptide antibody; BMI, body mass index; cDMARD, conventional disease-modifying antirheumatic drug; CRP, C-reactive protein; DAS28-ESR, disease activity score 28 based on erythrocyte sedimentation rate; ESR, erythrocyte sedimentation rate; HAQ-DI, health assessment questionnaire disability index; IL-6i, interleukin-6 inhibitor; IQR, interquartile range; RA, rheumatoid arthritis; RF, rheumatoid factor; SD, standard deviation; SJC, swollen joint count; TJC, tender joint count; TNFi, tumor necrosis factor inhibitor.
3.3 MALT1, Th1 cells, Th17 cells, and their correlation
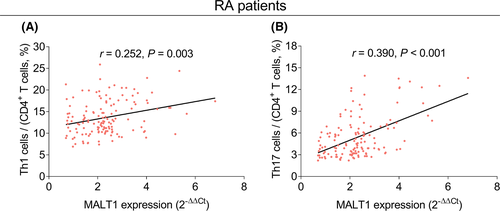
MALT1 expression (p < 0.001, Figure 2A), Th1 cells (p = 0.011, Figure 2B), and Th17 cells (p < 0.001, Figure 2C) of RA patients were increased compared to those of HCs. Besides, MALT1 expression was positively associated with both Th1 cells (r = 0.252, p = 0.003, Figure 3A) and Th17 cells (r = 0.390, p < 0.001, Figure 3B) in RA patients.

3.4 Correlation of MALT1, Th1 cells, and Th17 cells with RA disease activity
MALT1 expression was positively correlated with erythrocyte sedimentation rate (ESR) (r = 0.306, p < 0.001), C-reactive protein (CRP) (r = 0.335, p < 0.001), and DAS28-ESR score (r = 0.259, p = 0.002) in RA patients (Table 2). Moreover, increased Th1 cells were associated with elevated ESR (r = 0.181, p = 0.033), CRP (r = 0.223, p = 0.008), and DAS28-ESR score (r = 0.204, p = 0.016) in RA patients, while the correlation coefficients were relatively weak. In terms of Th17 cells of RA patients, it was positively related to tender joint count (TJC) (r = 0.184, p = 0.030), swollen joint count (SJC) (r = 0.194, p = 0.022), ESR (r = 0.261, p = 0.002), CRP (r = 0.241, p = 0.004), and DAS28-ESR score (r = 0.288, p = 0.001). Furthermore, MALT1, Th1, and Th17 cells were not correlated with other disease activity related indexes (all p > 0.050).
| Items | MALT1 expression | Th1 cells/(CD4+ T cells, %) | Th17 cells/(CD4+ T cells, %) | |||
|---|---|---|---|---|---|---|
| r value | p value | r value | p value | r value | p value | |
| Disease duration | 0.072 | 0.397 | 0.111 | 0.193 | −0.050 | 0.556 |
| TJC | 0.157 | 0.064 | 0.152 | 0.074 | 0.184 | 0.030 |
| SJC | 0.103 | 0.226 | 0.132 | 0.121 | 0.194 | 0.022 |
| ESR | 0.306 | <0.001 | 0.181 | 0.033 | 0.261 | 0.002 |
| CRP | 0.335 | <0.001 | 0.223 | 0.008 | 0.241 | 0.004 |
| DAS28-ESR score | 0.259 | 0.002 | 0.204 | 0.016 | 0.288 | 0.001 |
| HAQ-DI score | 0.159 | 0.062 | 0.055 | 0.517 | 0.141 | 0.097 |
Note
- The data were analyzed using Spearman's rank correlation test.
- Abbreviations: CRP, C-reactive protein; DAS28-ESR, disease activity score 28 based on erythrocyte sedimentation rate; ESR, erythrocyte sedimentation rate; HAQ-DI, health assessment questionnaire disability index; MALT1, mucosa-associated lymphoid tissue lymphoma translocation protein 1; SJC, swollen joint count; Th1, T-helper 1; Th17, T-helper 17; TJC, tender joint count.
3.5 Comparison of MALT1 among W0, W6, and W12
MALT1 expression was gradually decreased from W0 to W12 in total RA patients (p < 0.001, Figure 4A). Moreover, MALT1 expression in both response patients (p < 0.001, Figure 4B) and no response patients (p < 0.001, Figure 4C) was gradually declined from W0 to W12. Besides, no matter in remission patients (p < 0.001, Figure 4D) or in no remission patients (p < 0.001, Figure 4E), MALT1 expression was gradually reduced at those three time points as well.
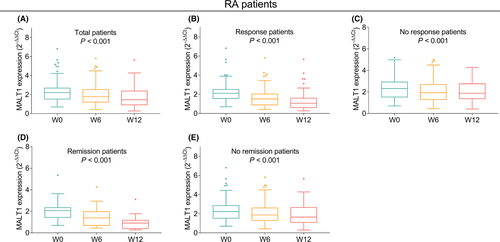
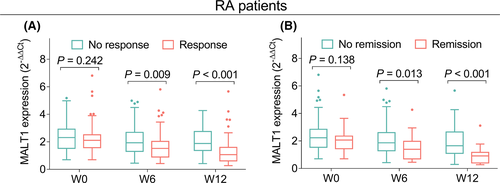
Additionally, MALT1 expression at W6 (p = 0.009) and W12 (p < 0.001) was lower in response patients than in no response patients (Figure 5A). Meanwhile, MALT1 expression at W6 (p = 0.013) and W12 (p < 0.001) in remission patients was also lower than that in no remission patients (Figure 5B).
4 DISCUSSION
This study disclosed the following discoveries: (1) MALT1 expression, Th1 cells, and Th17 cells were increased in RA patients than HCs. Besides, in RA patients, MALT1 expression was positively correlated with Th1 cells and Th17 cells. (2) MALT1 expression and Th1 and Th17 cells were positively associated with disease activity of RA patients. (3) MALT1 expression was gradually declined from W0 to W12 after the initiation of the treatment in RA patients; furthermore, the decline of MALT1 expression was associated with treatment response and remission of RA patients.
MALT1, as a scaffold protein, activates NF-κB signaling pathway to upregulate prototypical proinflammatory cytokines such as IL-1 and TNF-α.29, 30 On the other hand, MALT1 as a crucial cysteine protease leads to T cells activation and differentiation into Th1 and Th17 cells, which are closely related to the occurrence of many autoimmune disorders.17, 31 In addition, Th1 and Th17 cells are essential for induction of inflammation, which play the important role in the pathogenesis of many autoimmune and inflammatory diseases such as inflammatory bowel disease, multiple sclerosis, and RA.32, 33 In terms of RA, there is no study disclosing the expression of MALT1 and the correlation among MALT1, Th1, and Th17 cells.23, 34 Our study found that MALT1 expression, Th1, and Th17 cells were all higher in RA patients than in HCs; additionally, MALT1 was positively associated with Th1 and Th17 cells. The possible reasons might be that (1) as what was mentioned above, MALT1 would cause the occurrence of inflammatory via trigging many signaling pathway; meanwhile, RA was characterized by excessive inflammation34, 35; hence, MALT1 was increased in RA patients than in HCs. (2) MALT1 trigged the activation of T cells and promoted the differentiation of CD4+ T cells into Th1 and Th17 cells.21, 36 Therefore, MALT1 expression was positively related to higher proportion of Th1 and Th17 cells. Additionally, MALT1 was increased in RA patients; thus, Th1 and Th17 cells were also elevated in RA patients.
Some studies indicate that Th17 cells are positively related to DAS28 of RA patients, while Th1 cells have no correlation with disease activity of RA.37-39 Besides, there is no study exploring the relationship between MALT1 and disease activity of RA patients. Partially in line with previous studies, we found that MALT1, Th1, and Th17 cells were all positively correlated with disease activity of RA patients; nonetheless, the correlation coefficients of Th1 cells and RA disease activity related indexes were relatively weak. The possible explanation might be that (1) Th1 and Th17 cells promoted T-cell homeostasis shifted towards inflammatory status and secreted several inflammatory cytokines including IL-17 and interferon-γ (IFN-γ), which were involved in the pathogenesis of RA.40-42 As a result, Th1 and Th17 cells were positively related to RA disease activity. (2) As what was mentioned above, MALT1 elevated the proportion of Th1 and Th17 cells, which were positively correlated with disease activity of RA.38, 43, 44 Therefore, MALT1 was positively associated with disease activity of RA patients. (3) In terms of why the correlation of Th1 cells with RA disease activity was relatively weak, the probable reason might be that it was Th1/Th2 ratio and Th17 cells that played important roles in RA patients, while Th1 cells were mainly participated in the pathogenesis of organ-specific autoimmune disorders.45
So far, no study discloses whether the change of MALT1 expression is correlated with treatment outcomes in RA patients. In our study, it was indicated that the decline of MALT1 expression was related to treatment response or remission in RA patients. The probable reason might be that as mentioned above, MALT1 expression indicated the inflammatory status in RA patients. After achieving treatment outcomes, the inflammation of RA patients was greatly alleviated; then, MALT1 expression decreased consequently.46 As a result, the rapid decline in MALT1 could disclose treatment response and remission in RA patients.
Some limitations occurred in our study. (1) Current study enrolled HCs to evaluate the value of MALT1 in assistance of diagnosing RA, while we did not recruit disease controls, which was needed in the further study. (2) This study was single-center research, which would lead to selection bias. As a result, a multi-center research was necessary to further verify our findings. (3) We assessed the relationship between the decline of MALT1 and treatment outcomes; however, the detailed mechanism on how MALT1 regulated the pathological process of RA required further research to prove.
In conclusion, MALT1, Th1, and Th17 cells are dysregulated, inter-correlated, and correlated with disease activity in RA patients; meanwhile, the decline of MALT1 expression can partly reflect RA treatment response and remission. Hence, MALT1 may serve as a potential biomarker for disease supervision and treatment outcomes prediction for RA.
ACKNOWLEDGEMENTS
This study was supported by Department of Finance of Jilin Province (JLSWSRCZX2020-038) and Department of Finance of Jilin Province (JLSWSRCZX2020-0070).
CONFLICT OF INTEREST
The authors declare that they have no conflict of interests.
Open Research
DATA AVAILABILITY STATEMENT
Data sharing is not applicable to this article as no datasets were generated or analyzed during the current study.


