Developing metabolic gene signatures to predict intrahepatic cholangiocarcinoma prognosis and mining a miRNA regulatory network
Xun Ran and Jun Luo are co-first authors.
Abstract
Background
Metabolic disturbance is closely correlated with intrahepatic cholangiocarcinoma (IHCC), and we aimed to identify metabolic gene marker for the prognosis of IHCC.
Methods
We obtained expression and clinical data from 141 patients with IHCC from public databases. Prognostic metabolic genes were selected using univariate Cox regression analysis. Unsupervised cluster analysis was applied to identify IHCC subtypes, and CIBERSORT was used for immune infiltration analysis of different subtypes. Then, the metabolic gene signature was screened using multivariate Cox regression analysis and the LASSO algorithm. The prognostic potential and regulatory network of the metabolic gene signature were further investigated.
Results
We screened 228 prognosis-related metabolic genes. Based on their expression levels, IHCC samples were divided into two subtypes, which showed significant differences in survival and immune cell infiltration. After LASSO analysis, eight metabolic genes including CYP19A1, SCD5, ACOT8, SRD5A3, MOGAT2, PFKFB3, PPARGC1B, and RPL17 were identified as the optimal genes for the prognosis signature. The prognostic model had excellent predictive abilities, with areas under the receiver-operating characteristic curves over 0.8. A nomogram model was also established based on two independent prognostic clinical factors (pathologic stage and prognostic model), and the generated calibration curves and c-indexes determined its excellent accuracy and discriminative ability to predict 1- and 5-year survival status (c-indexes>0.7). Finally, we found that miR-26a-5p, miR-27a-3p, and miR-27b-3p were the upstream regulators that mediate the involvement of gene signatures in metabolic pathways.
Conclusion
We developed eight metabolic gene signatures to predict IHCC prognosis and proposed potential upstream regulatory axes of gene signatures.
1 INTRODUCTION
Intrahepatic cholangiocarcinoma (IHCC) originates from biliary epithelial cells and accounts for 25% of cholangiocarcinoma.1 It is the second most common primary liver cancer, accounting for 10–20% of newly diagnosed cases of liver cancer.2 IHCC may present as a central periductal infiltrating tumor or as a peripheral mass.3 Surgical excision is the only curative treatment option for patients, but even with surgical intervention, the 1-year and 5-year survival rates of IHCC patients are still at a disappointing 18% and 30%, respectively.4, 5 Therefore, identifying the molecular signatures of high-risk patients to determine prognostic risks for early intervention may allow us to better control disease progression. Next-generation and exome sequencing studies have shown that 30–40% of patients with IHCC have mutations in FGFR fusion, IDH, BRAF, and EGFR.6, 7 Dysfunction of TGF-β1 is associated with cancer development, and a study based on 78 IHCC patients reported that the expression level of TGF-β1 was associated with the survival prognosis of IHCC and could be used as an independent predictor for patients.8 Although these studies have reported a number of genes and mutations associated with IHCC, their genetic pathogenesis has not been clearly described.
Metabolic abnormalities are thought to be closely related to the progression of IHCC. Metabolic syndromes resulting from diabetes or obesity, hepatitis B virus/hepatitis C virus infection, and cirrhosis are risk factors for IHCC.9, 10 Studies have suggested that the pathogenesis of IHCC includes metabolic disorders caused by disruption of transcriptional regulation.11 Jia et al. identified several biomarkers related to intestinal microorganisms and bile acid metabolism for the diagnosis of IHCC and predicting vascular invasion in patients.12 KDM5C was found to affect tumor activity by inhibiting FASN-mediated lipid metabolism.13 Manieri et al. found that JNK-mediated disruption activated by PPARα may lead to changes in cholesterol and bile acid metabolism that promote cholestasis, bile duct proliferation, and IHCC.14 Several prognostic genes of IHCC, which are involved in type 2 diabetes and retinol metabolism pathways, were identified by constructing a long-noncoding RNA (lncRNA)-related competing endogenous RNA network.15 Additionally, lncRNA HAGLROS was also shown to regulate lipid metabolic reprogramming in IHCC through the mTOR signaling pathway.16 These studies have suggested a relationship between metabolism and IHCC, but there is still a lack of systematic understanding of the role of metabolism-related genes in predicting disease prognosis.
Therefore, we analyzed the molecular characteristics of IHCC from the perspective of metabolism-related genes to identify the corresponding prognostic markers of different subtypes and provide a reference for targeted therapy. In this study, we used expression data from public databases together with published metabolic genes to perform unsupervised cluster analysis and identify two IHCC subtypes. Based on the clinical information, we screened prognostic signatures and established a prognostic model and nomogram model to predict IHCC prognosis. Finally, we constructed a miRNA-mRNA regulatory network to explain the roles and regulatory mechanisms of prognostic signatures regulated by miRNAs in the metabolic process of IHCC. Our study aims to identify these metabolic genes and highlight the potential applications of these molecular signatures in the prognosis of IHCC.
2 MATERIALS AND METHODS
2.1 Data acquisition and process
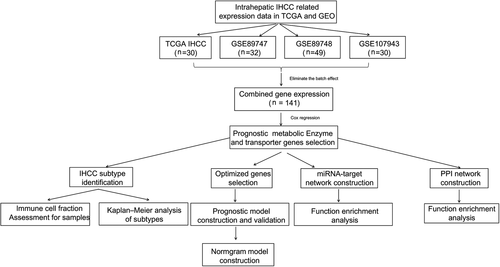
Expression data from Illumina HiSeq 2000 RNA Sequencing and clinical information of 30 IHCC samples were downloaded from The Cancer Genome Atlas (TCGA, https://gdc-portal.nci.nih.gov/). Additionally, four expression profile microarrays were obtained from gene expression omnibus (GEO) that met the following criteria: (a) entity tumor tissue sample, (b) total sample size >40, and (c) clinical information on survival prognosis. Among the microarrays, GSE89747 (detected from Illumina HumanHT-12 V4.0 expression beadchip), GSE89748 (detected from Illumina HumanHT-12 V4.0 expression beadchip), and GSE107943 (detected from Illumina NextSeq 500 (Homo sapiens)) contain mRNA expression data of 32, 49, and 30 IHCC samples, respectively, while the GSE53870 dataset contains miRNA expression data of nine controls and 63 IHCC samples (detected from State Key Laboratory Human microRNA array 1104). Notably, data from TCGA, GSE89747,17 GSE89748,17 and GSE10794318, 19 were used to select prognosis-related metabolic genes and construct prognostic models, and data from GSE53870 were used to build a miRNA regulatory network. The sva package version 3.38.020 (http://www.bioconductor.org/packages/release/bioc/html/sva.html) in R3.6.1 was used to remove the batch effect of TCGA, GSE89747, GSE89748, and GSE107943 caused by different detection platforms. Finally, the expression data of 141 IHCC samples were obtained from the combined dataset. The data sources and workflow were summarized in Figure 1.
2.2 Analysis of prognosis-related metabolic genes
Human metabolic and transporter genes were obtained according to a published article21 (https://www.ncbi.nlm.nih.gov/pmc/articles/PMC3353325/#SD3). Genes associated with metabolism were also selected from the Gene Set Enrichment Analysis (GSEA) database22 (http://software.broadinstitute.org/gsea/downloads.jsp). The expression data for these metabolic genes were extracted from the combined datasets. Taken together with clinical information, univariate Cox regression analysis was performed to select metabolic genes significantly related to survival prognosis (p < 0.05) using survival package version 2.41–123 (http://bioconductor.org/packages/survivalr/).
2.3 Protein–protein interaction (PPI) network construction and enrichment analyses
String version 11.024 (http://string-db.org/) was used to analyze the interactions between the coding proteins of prognosis-related metabolic genes and establish a PPI network. Cytoscape version 3.6.125, 26 (http://www.cytoscape.org/) was used to visualize the interactions between nodes. Gene ontology (GO) biological processes (BP) and Kyoto Encyclopedia of Genes and Genomes (KEGG) pathways of genes in the PPI network were explored using DAVID online tool27 with a false discovery rate (FDR) <0.05.
2.4 Unsupervised cluster analysis to identify IHCC subtypes
Based on the expression data of prognosis-related metabolic genes, pheatmap version 1.0.828 (https://cran.r-project.org/web/packages/pheatmap/index.html) was used to analyze bidirectional hierarchical clusters according to the centered Pearson correlation algorithm,29 thereby identifying different subtypes of IHCC from clustering results. The Kaplan-Meier (KM) curve was created to assess the correlation of survival prognosis between different subtypes using the survival package. The clinical information of samples from different subtypes were compared statistically.
2.5 Association analysis of IHCC subtype and immunity
CIBERSORT30 was used to calculate the proportion of 22 types of immune cells in each sample from the combined dataset. Then, the differences in infiltration abundance of immune cells between different subtypes were compared, and the between-group variance was visualized using a violin plot.
2.6 Construction of a prognostic model

2.7 Efficiency evaluation of the prognostic model
The values of PS in the training, validation, and entire sample sets were computed, and then the samples were divided into high- and low-risk groups according to the median value of PS in each group. The KM method was used to analyze the differences in survival prognosis between the two groups. Receiver-operating characteristic (ROC) curves were created to assess predictive performance by calculating the specificity and sensitivity.
2.8 Establishment of a namogram prediction model
Based on the entire IHCC sample set, univariate and multivariate Cox regression analyses were applied to identify independent prognostic clinical factors with standards of log rank p < 0.05. A nomogram model was constructed to predict 1-, 3-, and 5-year survival for patients using the rms package version 5.1–232 (https://cran.r-project.org/web/packages/rms/index.html). We then calculated the c-index for the nomogram prediction model by using R3.6.1 survcomp version 1.34.033 (http://www.bioconductor.org/packages/release/bioc/html/survcomp.html) to evaluate its discriminative ability.34, 35
2.9 Construction of a prognosis-related miRNA regulatory network
The expression data of miRNA in GSE53870, which contains nine healthy controls and 63 IHCC samples, were used to screen differentially expressed miRNAs (DEmiRNAs) between IHCC patients and controls. DEmiRNAs were then identified based on standards of FDR <0.05, and |log2fold change (FC)| >0.263 using R package limma version 3.34.736 (https://bioconductor.org/packages/release/bioc/html/limma.html). StarBase version 2.0 database37 (http://starbase.sysu.edu.cn/) was used to predict the target genes of the DEmiRNAs. By considering the intersection of miRNA-related genes and prognosis-related metabolic genes, key mRNAs were selected to build a regulatory network based on miRNA-mRNA interactions. The network was visualized using Cytoscape.26 Function and pathway enrichment analyses were performed on hub genes in the above network, and FDR <0.05 was set as the threshold.
3 RESULTS
3.1 Screening of prognosis-related metabolic genes of IHCC
To remove the batch effect of samples from TCGA, GSE107943, GSE89747, and GSE89748, the sva algorithm was applied to obtain a combined dataset. Principal component analysis (PCA) plots before and after removing the batch effect are shown in Figure S1. With batch effect elimination, no significant differences were found between the samples. We then obtained 2742 metabolic genes from published articles and the GSEA database, and expression data of these metabolic genes were extracted from the combined dataset. By applying the univariate Cox regression analysis, 228 prognosis-related metabolic genes were identified.
3.2 PPI and enrichment analyses of prognosis-related metabolic genes
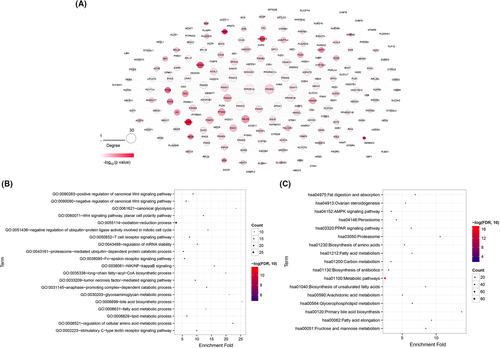
The STRING database was then used to analyze the interactions of the coding proteins of these 228 prognosis-related metabolic genes. We obtained 896 relation pairs with a combined score over 0.4, and established the network shown in Figure 2A. This network contained 218 nodes, and PPP2R1A, PPARG, and PSMC5 were found to have more degrees of connection (degree >25). We then performed function and pathway enrichment analyses of 218 genes in the PPI network, and obtained 62 GO-BP and 17 KEGG pathways. By ranking the values of FDR from small to large, top 20 GO-BP functions and top 17 KEGG pathways were obtained, which are shown in Figure 2B,C. The results suggested that these genes were mainly enriched in metabolic processes of cellular amino acid regulation, lipids, and fatty acids, among others, as well as enriched in metabolic pathways.
3.3 Identification of IHCC subtypes by unsupervised cluster analysis
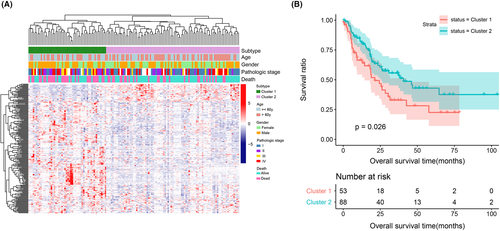
Combined with the clinical information of 228 prognosis-related metabolic genes, we identified IHCC subtypes by bidirectional hierarchical cluster analysis. The heatmap in Figure 3A shows that samples in the combined dataset were divided into two subtypes (cluster 1 and cluster 2, containing 52 and 89 samples, respectively). The expression of these metabolic genes also differed between cluster 1 and 2. By comparing the difference in clinical information between the two clusters (Table 1), we found that the samples were significantly different in terms of age, sex, and death rate (p < 0.05). Thereafter, survival analysis was performed on samples from clusters 1 and 2. The KM curve in Figure 3B suggests that samples in cluster 2 had a better survival status than those in cluster 1 (p = 0.026).
| characteristics |
Cases n=141 |
Subtype | P value | |
|---|---|---|---|---|
| Cluster 1 (n=52) | Cluster 2 (n=89) | |||
| Age(years) | 0.046 | |||
| ≤60 | 64 | 28 | 36 | |
| >60 | 77 | 24 | 53 | |
| Gender | 0.016 | |||
| Male | 77 | 34 | 43 | |
| Female | 64 | 18 | 46 | |
| Pathologic stage | 0.182 | |||
| Stage I | 44 | 14 | 30 | |
| Stage II | 24 | 11 | 13 | |
| Stage III | 15 | 9 | 6 | |
| Stage IV | 43 | 14 | 29 | |
| Dead | 0.043 | |||
| Yes | 72 | 30 | 42 | |
| No | 69 | 22 | 47 | |
Note
- Bold P indicates statistical significance.
- Abbreviation: n, number.
3.4 Analysis of the association between IHCC subtypes and immunity
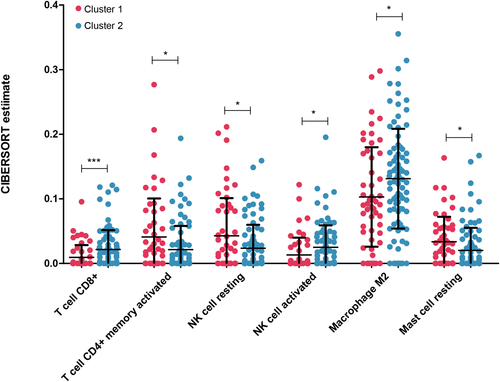
Based on the expression data of samples in the combined dataset, the CIBERSORT algorithm was used to calculate the proportions of 22 types of immune cells in each sample. Then, the immune cell fraction was compared between cluster 1 and 2, and we found that CD8+ T cells, activated CD4+ memory T cells, resting NK cells, activated NK cells, M2 macrophages, and resting mast cells showed significant differences in cell proportion between samples in cluster 1 and 2 (Figure 4).
3.5 Construction and validation of the prognostic model
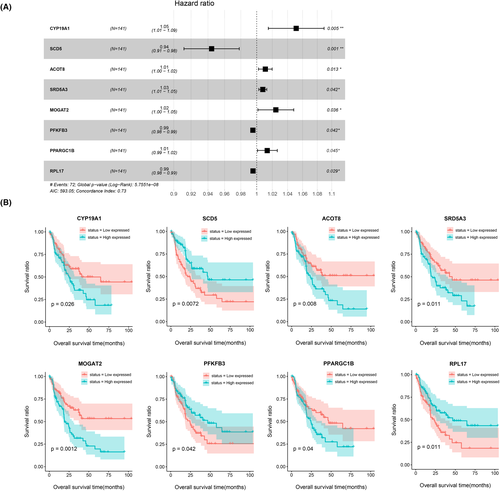
To develop prognostic markers, we divided the samples of the combined dataset into training and validation sets, which contained 70 and 71 IHCC samples, respectively. Then, based on samples in the training set, multivariate Cox regression analysis was used to select 20 independent prognosis-related metabolic genes. Furthermore, a LASSO algorithm was implemented to further identify an eight-metabolic-gene signature as the optimal gene set (1se = 0.08267079). The parameters of the LASSO algorithm are presented in Figure S2. These eight metabolic gene signatures included CYP19A1, SCD5, ACOT8, SRD5A3, MOGAT2, PFKFB3, PPARGC1B, and RPL17, and their correlations with prognosis are shown in Table 2 and Figure 5A along with the hazard ratio (HR), 95% confidence interval, P value, and LASSO coefficient. Then, the samples were grouped into high expression and low expression according to the median expression level of each gene signature for survival analysis. The KM curves in Figure 5B suggest that there were significant differences in survival status (all p < 0.05) between samples from high- and low-expression groups with respect to all eight gene signatures. Importantly, the results in Figure 5B were also consistent with Figure 5A and proved that CYP19A1, ACOT8, SRD5A3, MOGAT2, and PPARGC1B were risk factors for prognosis (HR >1), and patients with high-expression levels had worse survival status. In contrast, SCD5, PFKFB3, and RPL17 played protective roles in IHCC prognosis (HR <1), and higher expression of these proteins indicated a better survival status.
| Symbol | Hazard ratio | 95% Confidence interval | Standard error | Z score | P value | LASSO coefficient |
|---|---|---|---|---|---|---|
| CYP19A1 | 1.051 | 1.015–1.089 | 1.806E−02 | 2.777 | 5.480E−03 | 6.600E−02 |
| SCD5 | 0.944 | 0.912–0.978 | 1.792E−02 | −3.196 | 1.390E−03 | −1.860E−01 |
| ACOT8 | 1.011 | 1.002–1.020 | 4.407E−03 | 2.487 | 1.287E−02 | 2.000E−02 |
| SRD5A3 | 1.003 | 1.002–1.009 | 2.589E−03 | 1.347 | 4.178E−02 | 2.240E−02 |
| MOGAT2 | 1.025 | 1.002–1.048 | 1.161E−02 | 2.095 | 3.616E−02 | 6.700E−02 |
| PFKFB3 | 0.999 | 0.997–0.999 | 9.197E−04 | −1.413 | 4.158E−02 | −1.880E−03 |
| PPARGC1B | 1.005 | 1.003–1.020 | 7.496E−03 | 0.672 | 4.502E−02 | 2.070E−02 |
| RPL17 | 0.999 | 0.998–0.999 | 2.398E−04 | −1.693 | 2.905E−02 | −3.160E−05 |
- Abbreviation: LASSO: least absolute shrinkage and selection operator.
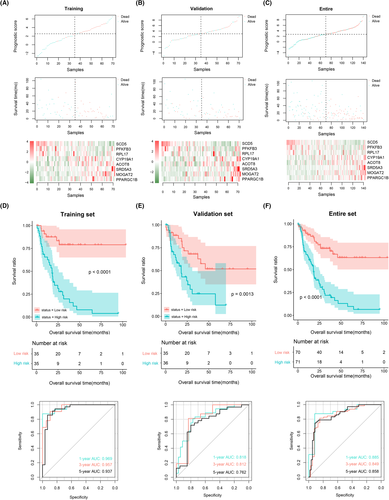
To further verify the predictive ability of these eight metabolic gene signatures, we constructed the PS models in the training, validation, and entire sample sets. The distributions of PS and survival time, as well as the changes in the expression level of the eight gene signatures in these three sample sets, are shown in Figure 6A–C. The results suggested that in these three sample sets, patients with higher PS had higher prognostic risks and shorter survival times. Moreover, patients with lower PS and higher PS had significantly different expression levels of the eight metabolic gene signature. Patients were divided into high-risk and low-risk groups by calculating the median PS values. We then created KM curves and ROC curves to illustrate survival differences and to evaluate the predictive performance of the PS-based prognostic models (Figure 6D–F). The KM curves demonstrate that patients in the high-risk group had worse survival. Meanwhile, the ROC curves suggest excellent abilities of PS-based prognostic models to predict the 1-, 3-, and 5-year prognoses of IHCC patients with areas under the curves (AUCs) over 0.9 in the training set, over 0.75 in the validation set, and over 0.8 in the entire sample set.
We also created a histogram showing the proportional distributions of the two clusters in the high-risk and low-risk groups (Figure S3). Using the chi-square test, we found that the distribution of the two clusters in the high- and low-risk groups was significantly different (p = 0.027). The results also suggested that more samples from cluster 1 were involved in the high-risk group, while more samples from cluster 2 were included in the low-risk group.
3.6 Developing a nomogram prediction model based on independent prognostic factors
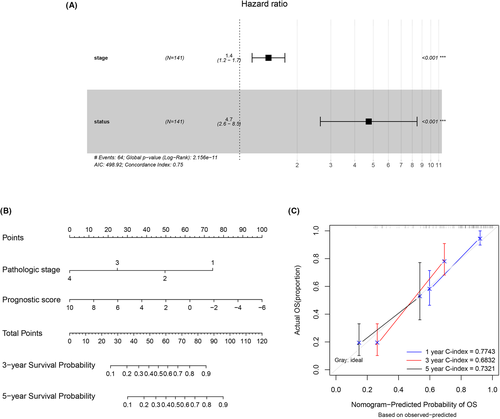
By performing univariate and multivariate Cox regression analyses, we identified pathologic stage and PS status as two independent prognostic clinical factors of IHCC (p < 0.05), as shown in Table 3 and Figure 7A. To further analyze the correlation between prognostic clinical features and survival status, we established a nomogram model to predict the 1-, 3-, and 5-year survival probabilities for patients with IHCC (Figure 7B). Calibration curves (Figure 7C) were created to validate the model, and the results suggested a high fitness of 1- and 5-year actual and predictive survival ratios. C-indexes were also calculated to assess the predictive accuracy of the nomogram model, and the c-indexes of the 1-, 3-, and 5-year prediction models were 0.774, 0.683, and 0.732, respectively. This finding also showed that the nomogram model was accurate in predicting the 1- and 5-year survival probabilities.
| Characteristics | Univariable Cox regression | Multivariable Cox regression | ||
|---|---|---|---|---|
| HR (95% CI) | P value | HR (95% CI) | P value | |
| Age (years, mean ±SD) | 1.013 (0.993–1.034) | 0.212 | – | – |
| Gender (male/female) | 1.292 (0.804–2.075) | 0.289 | – | – |
| Pathologic stage (I/II/III/IV/-) | 1.498 (1.233–1.819) | 2.51E−05 | 1.416 (1.162–1.725) | 5.63E−04 |
| Prognostic score status (high/low) | 4.477 (2.631–7.618) | 1.89E−09 | 4.735 (2.644–8.479) | 1.68E−07 |
Note
- Bold P indicates statistical significance.
- Abbreviation: SD, standard deviation; HR, hazard ratio; CI, confidence interval.
3.7 Construction of a miRNA regulatory network based on prognostic signatures
The expression data of miRNA in the GSE53870 dataset were employed to screen DEmiRNAs between IHCC and controls, and a total of 24 DEmiRNAs, 14 upregulated and 10 downregulated, were obtained. Then, the target mRNAs of the DEmiRNAs were predicted in starBase. By comparing the predicted mRNAs and 228 prognosis-related metabolic genes, overlapping mRNAs were selected to construct a miRNA-mRNA regulatory network (Figure 8A). This network contained 96 mRNAs, 8 miRNAs, and 238 miRNA-mRNA relation pairs. Among them, PFKFB3, SCD5, and PPARGC1B were the metabolic gene signatures of IHCC prognosis, and they were predicted to be regulated by miR-26a-5p, miR-27a-3p, and miR-27b-3p. Then, the function and pathway enrichment analyses of mRNAs in the above network were performed, and the top 20 GO-BP, ranking by FDR from small to large, and all KEGG pathways are shown in the bubble diagrams in Figure 8B. These results suggest that these mRNAs were mainly enriched in lipid metabolic processes and metabolic pathways. Finally, the upstream miRNAs of PFKFB3, SCD5, and PPARGC1B, and their involved pathways were extracted to build a relational network, as shown in Figure 8C. These results suggested that PFKFB3 involvement in fructose and mannose metabolism and AMPK signaling pathways might be regulated by miR-26a-5p; PPARGC1B participation in insulin resistance might be regulated by miR-27a-3p and miR-27b-3p; and role of SCD5 in mediating fatty acid metabolism as well as PPAR and AMPK signaling pathways might be regulated by miR-27a-3p and miR-27b-3p.

4 DISCUSSION
The high aggressiveness of IHCC may lead to multifocal tumor, lymph node metastasis, and vascular invasion, thereby resulting in a high incidence of local recurrence and/or distant metastasis and poor long-term survival after surgical resection.9, 38 IHCC differs from hepatocellular carcinoma in carcinogenesis and biological behavior and is also different from hilar and distal bile duct carcinomas in terms of clinical characteristics, imaging manifestations, and treatment approaches.39, 40 Hence, a unique prognostic model is necessary for hepatobiliary malignancy. Wang et al. constructed a histogram model based on the clinical information of 367 patients, and this model was shown to have a more accurate prognostic prediction ability than the traditional clinical staging system.41 However, the clinicopathological features associated with long-term survival after surgery have not been fully defined, and the clinical manifestations of IHCC are nonspecific, thereby preventing the identification of risk groups and patient susceptibility. Therefore, this study, which was performed based on metabolic genes together with clinical information of patients with IHCC, screened 228 prognosis-related metabolic genes. According to the expression of these genes, samples were divided into two subtypes (cluster 1 and 2), which showed significant differences in survival status and immune cell infiltration. We then optimized the algorithm and identified eight metabolic gene signatures (CYP19A1, SCD5, ACOT8, SRD5A3, MOGAT2, PFKFB3, PPARGC1B, and RPL17) and established a PS-based prognostic model. This model had excellent abilities in predicting patients’ 1-, 3-, and 5-year survival with AUCs over 0.8 in the ROC curves of the combined dataset. Based on independent clinical prognostic factors, we also constructed a nomogram model that exhibited a high accuracy in predicting 1- and 5-year survival probabilities with c-indexes of 0.774 and 0.732, respectively. Finally, we built a miRNA-mRNA regulatory network and revealed that PFKFB3, PPARGC1B, and SCD5 were regulated by miR-26a-5p, miR-27a-3p, and miR-27b-3p and were involved in metabolic pathways.
In this study, we grouped IHCC samples into two subtypes (cluster 1 and 2) based on 228 prognosis-related metabolic genes, and these two clusters showed significant differences in immune cell infiltration, including CD8+ T cells and M2 macrophages. Zhu et al. found an increased expression level of PD-L1 in IHCC cells, and the expression of PD-L1 was positively correlated with CD8+ T cell infiltration.42 It was also found that IHCC patients with higher expression of HLA class I had a lower 5-year overall survival rate, and the CD8+ T cell number in the outer border area of the tumor was positively correlated with the expression of HLA class I.43 In terms of macrophages, studies have illustrated that the number of M2 macrophages in IHCC tissues was significantly higher than that in normal bile ducts.44 Consistent with the above findings, our results suggested that samples in cluster 2 had worse survival status, and the infiltration of CD8+ T cells and M2 macrophages was significantly higher in cluster 2 than that in cluster 1. This further proved that the classification of subtypes based on the expression of 228 prognosis-related metabolic genes could accurately identify the prognostic risk of patients with IHCC.
By applying Cox regression analyses and the LASSO algorithm, we screened out an optimal gene set including eight metabolic gene signatures to identify the molecular characteristics of IHCC prognosis. Among them, CYP19A1 was found to promote cholangiocarcinoma progression with aggressive clinical outcomes achieved by increasing cell migration and proliferative activity.45 Roos et al. proposed an association between PFKFB3 mutations and gallbladder cholangiocarcinoma tissues through sequencing.46 The effects of these eight gene signatures on IHCC have not been widely studied, but by predicting their relationship with DEmiRNAs, we revealed the possible regulatory axis of these metabolic gene signatures. For example, we found that PFKFB3 involvement in the AMPK signaling pathway and fructose and mannose metabolism pathways may be regulated by miR26a-5p. PFKFB3 is an important regulatory factor of glycolysis, and studies have confirmed that miR26a could reduce the injury of rat vascular endothelial cells by inhibiting PFKFB3 and activating the AMPK pathway{Wu, 2019 #65}. This finding provides a good explanation for our results, and we speculate that PFKFB3, regulated by miR-26a-5p, is involved in the glucose metabolism of vascular endothelial cells, which may cause vascular invasion in patients with IHCC.
In this study, we identified eight metabolic gene signatures, and the prognostic model based on these gene signatures was able to predict the survival time for patients with IHCC. However, our research on the regulatory mechanisms of characteristic genes in the IHCC process is not comprehensive. The miRNA-mRNA regulation network based on database prediction lacks experimental verification. Therefore, we will further validate the target binding of predicted miRNAs and metabolic gene signatures and conduct animal experiments to explore the metabolic signaling pathways and molecular regulatory mechanisms of gene signatures in controlling the IHCC process.
To conclude, we selected eight metabolic gene signatures to identify the molecular characteristics of IHCC patients, and these genes can be used as biomarkers to predict the prognosis of IHCC. We also predicted the upstream regulatory mechanisms of the gene signatures and improved our understanding of the roles of candidate genes in the metabolic process of IHCC.
CONFLICT OF INTEREST
The authors declare that they have no conflict of interest.
Open Research
DATA AVAILABILITY STATEMENT
The data that support the findings of this study are available from the corresponding author upon reasonable request.


