A novel multiplex qPCR method for assessing the comparative lengths of telomeres
Funding information
This study is supported by Shanghai Municipal Science and Technology Major Project (Grant No. 2017SHZDZX01)
Abstract
Background
The comparative length of telomeres is considered to be related to diseases such as cancer, aging, and cardiovascular diseases. qPCR is currently one of the main methods for detecting telomere length. However, due to the unique sequence of telomeres (highly repetitive six-base sequence), it is difficult to design primers and probes to expand and detect telomere and to put internal reference gene and telomere into the same tube for detection to reduce the possible inter-pore errors and improve amplification efficiency. Besides, the stability and accuracy of the test results are greatly affected by the difference between reference genes and telomere copy number.
Methods
In this study, the single-copy genes were replaced with high-copy genes (300 copies) as the internal control to reduce the copy number difference of the internal genes and telomere. In addition, a multiplex qPCR system was constructed to detect the telomeres and an internal reference gene product. We also detected the lengths of telomeres in the genomic DNA in immortalized cells (293T and Hela) from different generations of cells.
Results
We detected the comparative telomere lengths of 1500 random Chinese volunteers of different ages with the multiplex qPCR method; the result shows that the comparative length of telomeres is negatively related to age. In addition, we compared our qPCR detection method with a terminal restriction fragmentation (TRF) method. Both of them were highly consistent, indicating that the qPCR method was reliable.
Conclusions
In conclusion, we developed a stable, convenient, and accurate comparative telomere length detection method.
1 INTRODUCTION
The detection of telomere lengths is important in revealing the state of cellular senescence and in evaluating health status 1. The qPCR is commonly used to detect the comparative lengths of telomeres in large studies due to its high throughput capabilities and low DNA input requirements 2, 3. However, the most difficult part of this technique is telomere sequence amplification and detection due to a six-base repetition sequence and non-specific amplification. These challenges were solved by Richard M. Cawthon in 2002 2, 4, who proposed that the upstream and downstream interactions of the primers could be reduced by introducing several bases mutations, yet the pair of primers could still effectively amplify telomeres sequence. As a common telomere length detection scheme, qPCR technology has been widely used in the study of population trends.
Variability in results may arise due to inconsistencies of protocols, reagents, and data analysis between different laboratories. Joglekar provided a step-by-step protocol including details of primers, reagents, PCR instruments, and data analysis steps in 2020 7. Also, Yongqiang Luo et al. were able to more precisely detect the absolute length of single telomeres using digital real-time PCR 8.
Based on the principle of qPCR that the copy number of the internal and target genes should be in the same order, in this study, we screened the genome database for a stable high-copy gene (300 copies) called YH-1 that was used as the internal control gene. Compared to a similar single-copy number internal gene such as 36b4, YH-1 bridges the gap with the copy number of telomeres, improving the stability of telomere detection.
We developed a multiplex fluorescent qPCR system for the detection of telomere length. In this system, telomere products were detected using SYBR green dye originally developed by Cawthorn in 2009 7, 8, while the internal gene products were detected using the fluorescent dye, Vic.
Previously, Joglekar suggested that for quantitative telomere detection systems, it is very important to select a stable standard for comparing the data from different batches 9. It is known that telomere DNA length in immortalized cell lines does not change with cell passage 10. We analyzed genomic DNA from immortalized (293T and Hela) and normal cells (HUVEC). Normal differentiated cells in which the telomere length changed with cell passage were selected as the control group. Genomic DNA from the 293T cell line was used as a stable standard.
To test the reliability of our method, the telomere lengths of five randomly selected samples were detected through multiplex fluorescent qPCR and TRF. Our results showed that the detection system of the two methods was highly consistent. Also, we detected the comparative telomere lengths at random from 1500 Chinese volunteers of different ages. Our data showed that the comparative length of telomeres was negatively related to age.
2 MATERIALS AND METHODS
2.1 Telomere length by quantitative PCR (qPCR)
Mean telomere length was measured by qPCR based on a modification of the method previously described by Cawthon in 2002 2. qPCR was conducted in triplicate, and the reactions included 4 ul of genomic DNA (80 ng), 0.1 ul of telomere primer (10 uM) (forwards: CGGTTTGTTTGGGTTTGGGTTTGGGTTTGGGTTTGGGTT; reverse: (GGCTTGCCTTACCCTTACCCTTACCCTTACCCTTACCCT), 0.1 ul of YH-1 forwards primer (10 uM) (5'-CGCACAGAGTAGTAAG-GAAAGTGAAGTAGGCCGGGC-3’), 1 ul of YH-1 reverse primer (10 uM) (5'-GTGCTGGGATTACAGGCGTGAG-3’), 1 ul of uniprimer2 (VIC-ATGGACAGTGAGATCTGTCCAT-BHQ1CGCACAGAGTAGTAAG), and 10 ul NovoStart® SYBR qPCR SuperMix, in a final reaction volume of 20 ul.
For PCR product testing, we adopted universal molecular beacon technology 11, 12 and the telomere amplifications were detected using SYBR green dye. All PCRs were carried out on a 7500 Real-Time PCR System, and amplification was conducted as follows: Stage 1:5 min at 95℃, Stage 2:30 cycles (telomere and internal gene reaction) of 15 sec at 95℃, Stage 3:1 min at 50℃, Stage 4:45 sec at 72℃, and fluorescence signals were collected at 50℃. The reactions were carried out in a 96-well plate. Software v2.3 was used for analysis. The telomere length for each sample was determined using the telomere to high-copy gene ratio (T/H ratio) by calculating the △Ct [Ct(telomere)/ Ct (high-copy gene)]. The T/H ratio for each sample (x) was normalized to the mean T/S ratio (test sample/standard sample) of the reference sample [2–(△Ctx−2△Ctr) =2−△△Ct], which was also used for the standard curve as a reference sample and as a validation sample. In every run, two reference samples were included to validate each reaction. The experiment was considered reliable if the T/H ratio of the control sample ranged within the 95% variation interval (0.95–1.05).
2.2 Sample collection and preparation
A total of 1,500 random peripheral blood samples were collected from the Central Hospital of Songjiang District, Shanghai. Samples were collected under informed consent from the volunteers. The samples are divided into 6 different age-groups (20–30, 31–40, 41–50, 51–60, and above 60 years of age). The gender ratio of the total sample is basically the same, but the difference is obvious in the age range: take 50 years old as the limit, the sample age ≥50, the number of samples is large, while the sample age <50, the number of samples is small.
2.3 Cell lines
Three cell lines, 293T, Hela, and HUVEC cells, were used in this study. The genomic DNA extraction kit (DP304) produced by Tiangen Biochemical Technology Co., Ltd. (Beijing, China) was used for cell line genome DNA extraction. Cells were cultured in RPMI 1640 medium (Thermo Fisher Scientific Inc., Waltham, MA) supplemented with 100 U/mL penicillin, 100 g/mL streptomycin, and 10% fetal bovine serum (Thermo Fisher Scientific Inc., Waltham, MA). All cell lines were maintained at 37℃ of 5% CO2.
2.4 DNA extractions
200 ul of fresh blood was taken and added to the red blood cell lysate. After 1 min, the DNA was centrifuged for 2 mins at 10,000 rpm/min. DNA was extracted using a commercial DNA extraction kit (Yi he, China) according to the protocol of the vendor. DNA concentrations were measured using a NanoDrop 2000 Spectrophotometer (Thermo Fisher Scientific Inc., Waltham, MA), and the quality of DNA was analyzed by agarose gel electrophoresis.
2.5 Statistical analysis
Statistical data analysis was performed using GraphPad Prism v5 (GraphPad Software Inc., CA, USA).
3 RESULTS
3.1 High copy genes were selected as internal genes
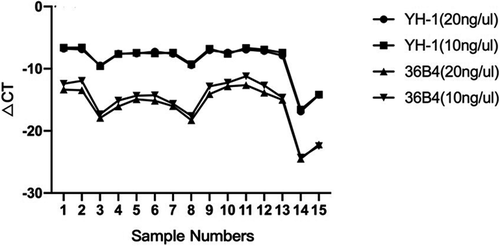
Compared to previous single genes such as 36B4, Figure 1 showed high-copy number genes bridge the gap with the telomere copy number, improving the stability of detection. We detected the lengths of telomeres in fifteen blood samples at DNA template concentrations of 40 ng and 80 ng. Our data showed that the high-copy number gene was approximately 300 bp and the amplification products were around 200 bp.
3.2 Copy number of the internal gene was stable in the population
The high-copy internal gene screened from the genome database had no copy number variation across the population and no non-specific amplification on the sex chromosome (X chromosome) indicating that it could be used as a stable internal control gene.
No variation in the copy number of YH-1 was detected in the population. We screened the genome database for a stable high-copy gene (300 copies) called YH-1 was then used as the internal reference gene. The results of the blast search showed that YH-1 has no copy number variation in the population. Also, Figure 2A showed the common stable keep-housing gene 36B4 was used as a control to test the stability of YH-1 in one hundred blood samples. Results showed that the average CT of 36B4 was approximately 29.22±1.17 and the average CT of YH-1 was approximately 20.86±1.17. The change in YH-1 was consistent with that of 36B4.
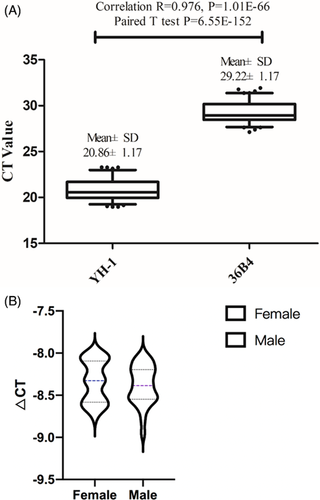
To test the reliability of our system, we examined copy number differences in YH-1 across thirty males and female blood samples. Figure 2B showed that the average △CT of YH-1 in females was approximately −8.25 ± 0.25 and the average △CT of YH-1 in males was approximately −8.38 ± 0.23. These data indicated that the copy number of YH-1 was stable across the sexes.
3.3 Establishment of a multiplex PCR detection system
A multiplex PCR system was constructed to detect the copy number of telomeres and the internal reference gene. This system was found to reduce the error from different tubes and improving the accuracy of the detection results.
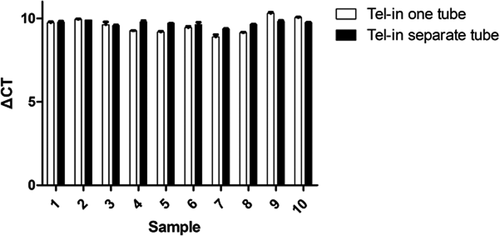
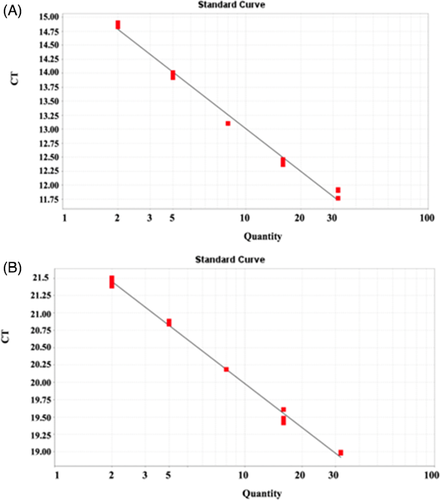
Figure 3 showed that irrespective of whether the internal and telomeres gene were amplified simultaneously, the internal gene did not significantly interfere with the amplification of the telomere gene. Figure 4A and B showed the standard curves of the telomere and internal reference genes were detected as normal. Analysis of the standard curves from the multiplex fluorescence PCR system showed good correlation.
3.4 293T cells were selected as the standard
A previous report showed that in immortalized cell lines such as 293T and Hela, telomere enzyme activity is higher than normal differentiated cell lines resulting in the ability to maintain constant telomere lengths in different cell generations 13, 14. Therefore, both 293T and Hela cells were used as standards.
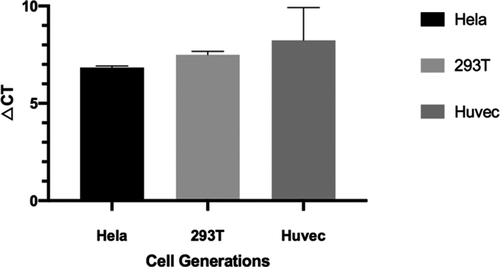
By testing the telomere lengths in different generations of 293T cells and Hela cells, Figure 5 showed that telomere length did not change with the number of generations compared to normal differentiated HUVEC cells.
3.5 Testing of 1500 samples
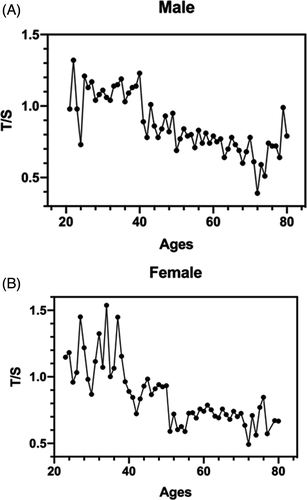
Using the multiplex qPCR system detection system, we detected the telomere lengths of 1500 random volunteers at different age stages and established a small age database of the characteristics of the Chinese population.
Results suggested that telomere length was negatively correlated with age. Figure 6A and B showed comparative telomere length dropped significantly after the age of 40 in both men and women while Figure 6A showed telomere lengths began to rise after 72 in males.
3.6 The TRF method verified the accuracy of the detection results
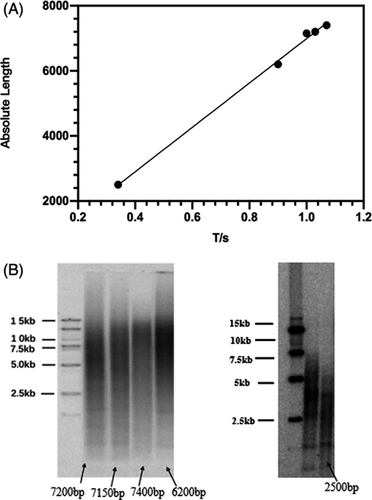
To test the accuracy of the detection results of the multiplex PCR system, a TRF method was used to detect the same sample as the qPCR.
Figure 7A and B showed the comparative length of telomeres from the two different detection methods was highly consistent, demonstrating that the telomere data detected by a qpcr method were reliable.
4 DISCUSSION
Telomere length is a promising biomarker for age-associated diseases and many cancer 15. Several techniques including TRF, analysis by Southern blotting, qPCR, quantitative telomere/centromere fluorescence in situ hybridization (T/C-FISH), fluorescence in situ hybridization combined with flow cytometry (Flow FISH), single telomere length analysis (STELA), and whole-genome sequencing (WGS) 16 have been used to detect the lengths of telomeres. In the normal population, the dynamic variation of telomere length was not significant 17 and so the accurate detection of telomere length is particularly important. Average telomere length is negatively correlated with age, and the difference in the population is about 2–3 times. However, due to the limitation of qPCR accuracy and the possible inter-hole error, there are still many challenges in the individual detection. Therefore, by selecting high-copy internal reference genes and optimizing the detection system, the internal reference genes and telomere were placed in the same tube for detection, which corrected the possible problems such as inter-pore errors and unstable detection results in the past. In the test samples, the copy number of telomeres and the internal gene differed by several dozen (the copy number of telomeres are in the tens of thousands, while the copy number of internal genes are in the hundreds). The SYBR green signal consists of the telomere and internal gene product signals. However, the proportion of the total signal due to the internal reference gene is relatively low and so can be ignored. A one-tube detection method for telomeres and the use of internal reference genes could effectively reduce errors and improve the accuracy of the detection results.
Through the above methods, the newly developed qPCR technology in this study has two advantages: Firstly, it can accurately detect the annual variation of individual telomere length and, secondly, it can accurately grasp the variation trend of telomere length of different age-groups.
A more accurate telomere length detection method could be used to uncover correlations between disease, aging, and changes in telomere length 18-20. Providing researchers a more reliable and convenient platform to perform qPCR for the accurate detection of telomere length.
ACKNOWLEDGMENTS
We would like to thank Shanghai Biowing Applied Biotechnology Co., Ltd., School of Chemistry and Bioengineering, Donghua University, and Department of Central Laboratory, Songjiang Hospital Affiliated First People's Hospital for funding. We thank the Shanghai Science and Technology Special Fund for the help provided.
CONFLICT OF INTEREST
The authors have no conflict of interest to disclose.
AUTHOR CONTRIBUTIONS
J.H.X., G.Z.S., Y.X.Z., and K.L. conceived ideas and designed experiments; G.Z.S. and H.C. lead experiments (with help from B.Y., Y.X.Z., H.C., and J.H.X.,); G.Z.S., J.H.W., and K.L. conducted data analysis and interpretation; J.H.X., J.H.W., and G.Z.S. wrote the paper and provided feedback to all authors. G.Z.S. and H.C. are the first co-authors of this article.
Open Research
Data Availability Statement
All data generated or analyzed during this study are included in this published article.


