Sulfide release and rebinding in the mechanism for nitrogenase
Abstract
Nitrogenases are the only enzymes that activate the strong triple bond in N2. The mechanism for the activation has been very difficult to determine in spite of decades of work. In previous modeling studies it has been suggested that the mechanism for nitrogen activation starts out by four pre-activation steps (A0–A4) before catalysis. That suggestion led to excellent agreement with experimental Elecrtron Paramagnetic Resonance (EPR) observations in the step where N2 becomes protonated (E4). An important part of the pre-activation is that a sulfide is released. In the present paper, the details of the pre-activation are modeled, including the release of the sulfide. Several possible transition states for the release have been obtained. An A4(E0) state is reached which is very similar to the E4 state. For completeness, the steps going back from A4(E0) to A0 after catalysis are also modeled, including the insertion of a sulfide.
1 INTRODUCTION
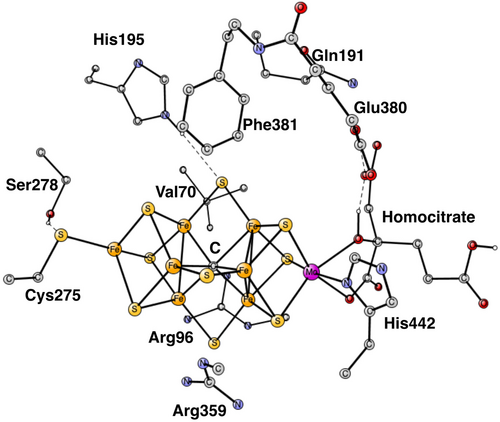
Nitrogenases convert nitrogen in the air into ammonia, which in turn can be used in the synthesis of, for example, amino acids. There are three classes of nitrogenases, Mo- V- and Fe-nitrogenase. An x-ray structure for Mo-nitrogenase was obtained already 30 years ago.1 Subsequently, structures of higher resolution have been obtained. The most important modification of the original structure was obtained 12 years ago, when it was found that there is a carbide in the center of the cofactor.2 The cofactor and its nearest surrounding is shown in Figure 1.
Early experimental kinetic studies3 showed that N2 binds to the cofactor after four reduction steps from the ground state. The result of that investigation is usually referred to as the Lowe-Thorneley (LT) scheme.3 The leading experimental suggestion for the mechanism of the activation of N2 is based on EPR experiments by Hoffman et al.,4-7 which showed that N2 activation occurs concertedly with the disappearance of two hydrides that are released as H2. In that way two additional electrons become bound to the cofactor after the release of H2, important for the electron-demanding reduction of N2. The experiments explained the long-standing question of why a release of one H2 had always been found for the overall reaction. An important part of the suggested mechanism is that the E4 state observed in the EPR experiments should bind N2 after four reductions from the ground state. Since the ground state is known to have an oxidation state with (Mo3+, 3Fe2+, 4Fe3+), the suggestion means that the structure (termed E4), containing two hydrides, that activates N2 should have the same oxidation state as the ground state with four Fe3+. That is very surprising, considering that catalysis requires a very strong reductant with a redox potential between −1.4 and −1.6 V.
In a series of theoretical papers, the experimentally suggested mechanism has been questioned.8-12 Because of the unexpectedly high redox state with four Fe3+ for the suggested E4 state that should activate N2, it was suggested that four additional reductions, termed A0–A4, are made prior to catalysis. That would bring down the redox level of the E4 state to be one where all irons are Fe2+, which is the lowest possible stable redox state for the cofactor. The redox state is then the same as for the P-cluster, which is very similar to the FeMoco cluster but without molybdenum. It is the direct donor of electrons to the Mo-cofactor. In the experimentally suggested mechanism, it has been assumed (not shown) that the state observed to bind N2 in the LT-scheme after four reductions is the same as the E4 state observed by EPR. In the most recent theoretical paper, it was instead suggested, that a structure with only one hydride is the one observed in the LT-scheme. In contrast, the E4 state observed by EPR has two hydrides. The computational arguments for that conclusion are very strong. Errors of more than 40 kcal/mol for the theoretical methods are required to allow the experimental mechanism to be possible. In calculations on several redox enzymes, errors of usually less than 3 kcal/mol were found.13
Another major difference between the suggested theoretical and experimental mechanisms is that a sulfide was found to be released in the computational study.10 Several indications of a possible loss of a sulfide have been found experimentally, but has so far not been suggested to be a part in the leading experimental mechanism. In the present paper, the four pre-activation steps A0–A4, are studied in detail, with particular emphasis on the sulfide release step. Since the cluster returns to the ground state after catalysis, a mechanism for the rebinding of a sulfide also has to be found. Such a mechanism is presented here.
In the following investigations of the reductions of the cofactor, it is important to keep in mind the optimized structure for the binding of N2H2 in E4 from the previous study, see Figure 2.11 N2H2 was found to be bound in the Fe1, Fe2, Fe4 region, with one nitrogen having bonds to Fe1 and Fe2, while the other nitrogen binds to Fe4. The mechanism found for N2 activation agrees with all experimental observations of the E4 state.

2 METHODS
The methods used here are the same as were used in the previous studies of nitrogenase.8-12 DFT (Density Functional Theory) has been used based on the B3LYP functional.14 A difference is that the fraction of exact exchange is reduced to 15% from the standard 20%, which can sometimes improve the results by 3–5 kcal/mol.15 The geometries were optimized using a medium size basis set, lacvp*, which contains an effective core potential. For the final energies a large basis set was used (cc-pvtz(−f)) for the non-metal atoms, while a lacv3p + basis was used for the metals. For zero-point effects and determination of transition states, Hessians were computed using B3LYP with lacvp*. The transition states were linked to the products by moving in small steps. The lacvp basis sets contain a core potential. A dielectric constant of 4.0 was used for the solvation effects, and the D2 approximation was used for the dispersion effects.16 The only significant entropy effects for the present type of reactions are those of translation of free molecules, which do not occur in the present case. The energies given in the text and tables are then approximate free energies. The methods have been extensively tested against other redox enzymes, where the errors were usually found to be 3 kcal/mol or smaller.13, 16, 17 The programs used were Jaguar and Gaussian.18, 19
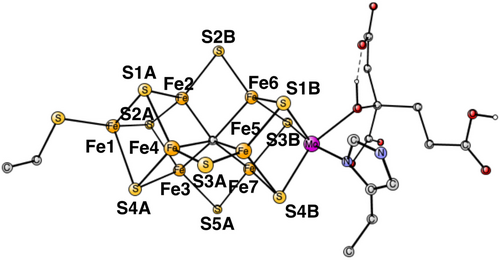
For the modeling of the enzyme active site, a cluster model20 was used with about 180 atoms. The model is the same as the one used in the recent study of the E4-state, see Figure 1.11 The amino acids included can be seen in the figure. The fixed atoms are almost all back-bone alfa-atoms, fixed together with two of its hydrogen atoms. The exceptions are the two arginines, which have been cut a bit down from the backbone. In that case two atoms at the cutting position were fixed. The coordinates that were fixed from the x-ray structure are marked with a # in the SI. An empirical value of 14 kcal/mol was used for the release of H2S, the same value as used for water in the earlier studies. Entropy effects are small and ignored. The spin-couplings used are based on previous experience and are given for each case discussed below. The spin-couplings are described by giving the Fe-atoms with negative spin. For example, (−2, −3, −4) means negative spin for the Fe-atoms 2, 3 and 4, with the numbering taken from the X-ray structure, see Figure 2. The even states are doublets except for the ground state, which is a quartet. The odd states are triplets.
3 RESULTS
The section of the results is divided into two parts. In the first part, the redox transitions from A0 to A4 are discussed including a release of a sulfide. For the cost of taking a (H+,e−)-couple from the medium a value of 348.6 kcal/mol is used based on a redox potential of the donor of −1.5 V.9 It is known that 2 ATP are used for every electron.4-7 To reach that very low redox potential for the donor, which is needed, the model calculations suggest that most of the energy from the ATP hydrolysis is used. How that can possibly be achieved has been described in another paper.8 In short, it involves the binding of two proteins, the Mo-protein and the Fe-protein. That binding could either lead to a removal of a proton or an addition of an electron to the electron donor. Either one of these possibilities should lead to a significant decrease of the redox potential of the donor. At the end, the two proteins are released from each other using the energy of the 2 ATP. The processes involved should all be almost thermoneutral, in order not to lose the energy of the ATP.
Before catalysis, A0 is the resting state. Since the reduction potential of the P-cluster is changed by the use of ATP, the equilibrium in the process shifts towards the products, and A0 is no longer the resting state. After catalysis, when ATP or N2 ceases, the system goes back to the original equilibrium, where A0 is again the resting state. In the second part, the return to the ground state after catalysis is described including a rebinding of a sulfide. For the gain of releasing a (H+,e−)-couple a value of 374.0 kcal/mol is used based on a redox potential of the electron acceptor of −0.4 V.8
There are many theoretical studies of the mechanism of nitrogenase,21-23 but they have all strictly followed the mechanism suggested by experiments, which is quite different from the one discussed here, except for the first transitions. Therefore, they are not discussed further here.
3.1 Initial reduction steps including a release of a sulfide
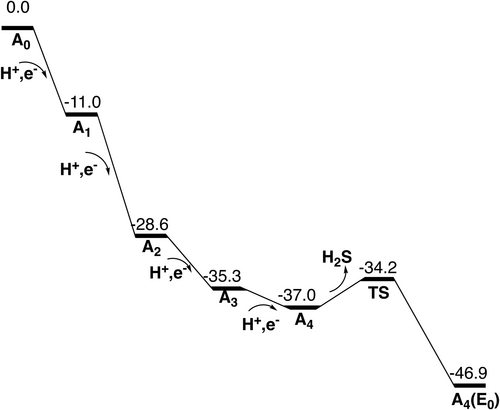
The first two transitions are straightforward and closely follow the findings in previous studies.9, 21-23 The core of the optimized A0 ground state is shown in Figure 3. It is a quartet state with spin-coupling (−2, −4, −7). In the first reduction step the proton binds to S2B. The A1 state is a triplet with spin-coupling (−2, −4, −7). The A0–A1 transition is exergonic by −11.0 kcal/mol. In the next reduction step S3A becomes protonated. A2 is a doublet with spin-coupling (−3, −4, −6). The A1–A2 transition is exergonic by −17.6 kcal/mol.
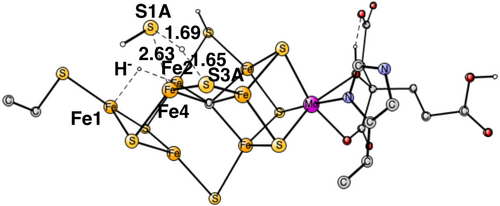
In the A2–A3 transition, the first surprise comes. Rather than protonating the third belt sulfide S5A, S1A becomes protonated, which is −4.2 kcal/mol better. Protonating S2A is +5.2 kcal/mol higher and protonating S1B is much higher in energy. After protonating S1A in A3, the cofactor shows the first sign of instability with a loss of the Fe2-S1A bond. The bond distance increases from 2.35 Å in A2 to 3.36 Å in A3. Therefore, it was tested if S1A could be released from the cofactor in A3. A TS for the release was found, see Figure 4. The barrier is +14.2 kcal/mol, which is below the limit of 18 kcal/mol. However, the release is endergonic by +1.7 kcal/mol. Therefore, the release of a sulfide is postponed to the next transition, see below. The spin-coupling used for A3 is (−3, −4, −6). With a protonated S1A, the A2–A3 transition is exergonic by −6.7 kcal/mol.

The release of a sulfide occurs in A4. Several positions for the added proton in A4 were tried. A formation of a hydride is energetically preferred, as in the previous study.10 Two positions were found to have almost the same energy. In one of them, the hydride binds between Fe1 and Fe2, while in the second one it binds between Fe4 and Fe5. The first one will lead more directly to the E4 state which has two hydrides in the Fe1, Fe2, and Fe4 region, where they are replaced by N2H2, shown in Figure 2. The second one was the best position found in the previous study.10 For the nitrogen reduction mechanism, the choice between the two positions does not matter, since they will lead to the same E4 state. With the hydride in between Fe1 and Fe2, the hydride is already in the right region compared to E4. The exergonicity for the A3–A4 transition is only −1.7 kcal/mol, but see below. For the position in between Fe4 and Fe5, the hydride can easily move to the Fe1, Fe2, and Fe4 region, as was shown in the study of the E4 state.11 The spin-coupling used for A4 is (−2, −3, −4).
The optimized TS for the release of a sulfide in A4 is shown in Figure 5 for the case with a hydride between Fe1 and Fe2. The sulfide released is S1A, which showed a tendency to leave already in A3. At the TS, the distance to Fe4 is elongated from 2.39 Å in A3 to 2.63 Å. The proton used for the formation of H2S is taken from S3A, which is the closest proton and probably also the energetically easiest one to take. At the TS, the distance between S1A and the proton is 1.69 Å, and the one between S3A and the proton 1.65 Å. The barrier for the release is only 2.8 kcal/mol and the exergonicity is −9.9 kcal/mol, using the value of 14 kcal/mol for the binding of H2S in the enzyme or in water. This means that the total exergonicity for the A3–A4 transition becomes –(1.7 + 9.9) = −11.6 kcal/mol.
If the hydride is placed in between Fe4 and Fe5, S3A swings out to leave place for the hydride. S3A-H+ can then form H2S with the proton on S1A. In the TS, structure in Figure 6, the S3A-H+ is 1.74 Å and S1A-H+ distance 1.60 Å.
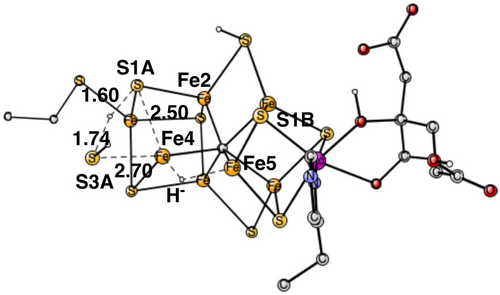
The calculated TS point has an energy only +2.0 kcal/mol higher than the one for the TS in Figure 5. That reaction would leave Fe4–Fe5 without a sulfide bridge while S1A would cover the Fe1, Fe2, and Fe4 region. To reach a structure similar to the one found for E4 in Figure 2, a structural rearrangement is then needed, with the hydride moving to the Fe1, Fe2, and Fe4 region and S1A moving to bridge Fe4–Fe5. That type of rearrangement was found difficult but possible in the previous study of E4, where the hydride was first bound between Fe4-Fe5.11 To directly form a structure similar to the one for the E4 state in Figure 2 going over the TS in Figure 5, with a selectivity of 99% or more, the barrier for the TS in Figure 6, should be higher using a Boltzmann distribution, than the one in Figure 5 by +2.8 kcal/mol, +0.7 kcal/mol more than the calculated difference of +2.0 kcal/mol. Such an error of the methodology is obviously possible and the scenario with a TS as in Figure 5 is, therefore, the most likely possibility. However, even if some percentage of the reactions would go over the TS in Figure 6, there could be a rearrangement after the TS that would lead to the same product. For completeness, the alternative reaction with the hydride between Fe4 and Fe5 was also studied for the case where S3A moves in the opposite direction towards S1B.The barrier is almost as low as the other one where S3A swings out in the other direction, only +2.2 kcal/mol higher than the one in Figure 5. That scenario is exactly the same as studied previously,10, 11 where it was shown that a rearrangement led to the structure in Figure 2 for E4.
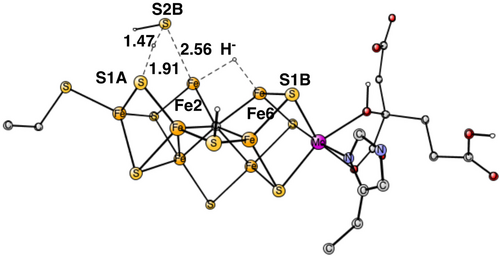
An interesting alternative release of the S1A sulfide is the one where S2B is lost. In X-ray structures where a sulfide is lost, most of the times it is S2B.24-27 When the hydride binds between Fe2 and Fe6, the protonated sulfide S2B swings out and approaches the protonated S1A. At the TS in Figure 7, the S1A-H+ distance at the TS is 1.91 Å and S2B-H+ distance is 1.47 Å. The TS point is 6.0 kcal/mol higher than the one for the TS structure in Figure 5, with a hydride between Fe1 and Fe2 and a release of S1A. An alternative release of S2B is one where the protonated S2B swings out towards a protonated S1B, but the calculated energy at the TS point is even higher, +11.7 kcal/mol above the one for the TS structure in Figure 5. Therefore, a release of S2B as suggested from some experiments. will not occur. It should be noted that the barrier for the reaction in Figure 7 is possible to overcome at the time-scale of catalysis. It is only +8.2 kcal/mol, but it will still not occur during catalysis because the barrier is higher than the one in Figure 5. However, under alternative conditions it could occur, and that is probably the reason a release of S2B has been seen.
In summary, the suggested scenario for the first four reduction steps will lead to a structure for A4, where the S1A sulfide has been released and a hydride binds in the Fe1,Fe2,Fe4 area, that was previously occupied by S1A, see Figure 8. This structure will be the E0 of catalysis. It can be noted that the structure of A4 is very similar to the one of E4 found in the previous study, shown in Figure 2. There is only one protonated sulfur, S2B, and N2H2 just replaces the hydride.

The energy diagram for the four reduction steps in the nitrogenase pre-activation mechanism is shown in Figure 9.
3.2 Return of E0 to A0 including rebinding of a sulfide
In the catalytic cycle, a hydrogen molecule and two ammonia molecules are formed and the cycle comes back to the same A4(E0) state. When ATP or N2 ceases the reduction potential goes back to its original value of −0.4 V. That means that the structure of the cofactor should return to the A0 ground state. In this section, the steps leading from A4(E0) back to A0 are described.
The first result is that S1A cannot rebind in the A4(E0) state. The binding of H2S to A4(E0) is endergonic by +9.9 kcal/mol, see above, where a cost for fetching a H2S of 14 kcal/mol is included. Instead, a (H+,e−) can be removed by the oxidant, reaching an A3 structure (without S1A). Removing the hydride in E0 is calculated to cost 362.1 kcal/mol. Using the energy of 374.0 kcal/mol for the oxidation, see above, the removal is strongly exergonic by −11.9 kcal/mol. In A3, it is easier to insert the sulfide than in A4(E0). It is slightly exergonic by −1.7 kcal/mol. However, it will become even more exergonic in the next step. Instead, another (H+,e−) can be removed to reach an A2 state (with a missing S1A). The cost is 367.3 kcal/mol. With the value for the oxidation of 374.0, the reaction is exergonic by −6.7 kcal/mol. The two oxidations have led back to an A2 state, with a total exergonicity from A4 to A2 of −18.6 kcal/mol.
An alternative route from A4 to A2 is to remove a hydrogen molecule, with a proton from S2B and the hydride. The TS is shown in Figure 10. The calculated barrier is +15.2 kcal/mol, making it a viable pathway. The energy gain of the removal is −10.4 kcal/mol, which includes an entropy contribution for the free H2 of −8.4 kcal/mol. Therefore, the total gain of the two oxidations is −8.2 kcal/mol more favorable than forming H2. It can be added that the two oxidations lead to the same state for A2 as the removal of H2. A difference between the two ways to go from A4 to A2 is that a release of H2 does not require an oxidant and can perhaps be an explanation for observations made in some quench-cryo-annealing experiments.28
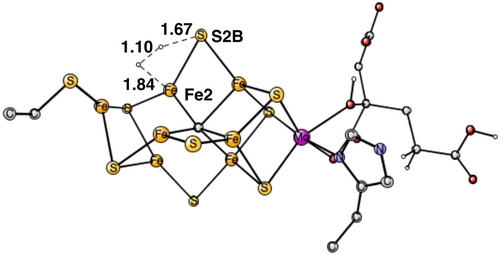
Once the A2 state is formed, H2S can bind to Fe4 of the cofactor. The binding exergonicity is small with −1.2 kcal/mol, including a cost of 14 kcal/mol for bringing H2S from its position outside the cofactor. For moving a proton from H2S on Fe4 to S2B, there is a TS shown in Figure 11 with a very small barrier, which actually becomes zero when dielectric, dispersion and zero-point effects are added. The step is exergonic by −12.4 kcal/mol. Afterwards, the remaining proton on S1A moves to S3A with a small gain of −1.0 kcal/mol. Therefore, the total exergonicity for the insertion of the sulfide at the S1A position is −14.6 kcal/mol.

Two more oxidations are needed to reach the ground state A0. The first transition removes the proton on S3A, and is exergonic by −7.8 kcal/mol. In the final step to reach A0 the proton on S2B is removed, which is exergonic by −14.4 kcal/mol. The full energy diagram from A4(E0) to A0 is shown in Figure 12.

4 SUMMARY
With the use of a large part of the ATP hydrolysis, a very low redox potential of −1.4 to −1.6 V for the P-cluster will be reached. Using the low redox potential, it has been shown that four reductions of the ground state A0 will lead to an A4(E0) state that is very similar to the E4 state found in the previous study after four additional reductions.11 In the A3 to A4 transition a hydride becomes bound in between Fe1 and Fe2. A release of the sulfide S1A is then quite exergonic by −9.9 kcal/mol. The barrier for the release is only +2.8 kcal/mol, which means that the release cannot be avoided. A release of S2B, as observed in many experiments, has a significantly higher barrier with +8.8 kcal/mol. However, it is still a low barrier which can easily be overcome, but will not be preferred compared to the release of S1A.The release of S1A leads to an empty region in between Fe1, Fe2 and Fe4, which is used in E4 to activate N2. This means that N2 activation and protonation will occur after eight reductions in E4, not after four, which was previously believed.3 To explain this difference, a search for a state which binds N2 after only four reductions was made in a previous paper.12 Indeed, a state was found that binds N2 to Fe4 already in E0 after the release of the S1A sulfide, but N2 cannot be protonated at that stage. For the experimentally suggested mechanism to be correct, errors of 40 kcal/mol of the present methods are required.12 In contrast, for a series of redox enzymes, the errors compared to experiments are usually less than 3 kcal/mol.13 Errors of 10 kcal/mol or more have never been seen.
As delivery of N2 or ATP ceases, the equilibrium should change back to its original form, and the cofactor should return to its ground state A0. The return from A4(E0) to A0, occurs by four oxidations. In A2, H2S will bind to Fe4 and after two deprotonations the sulfide will bind in the S1A position. The rebinding of the sulfide is exergonic by −14.6 kcal/mol. The return from A4(E0) to A2 can occur in two ways, either by two oxidations or by release of H2. The two oxidations are favored by −8.2 kcal/mol.
ACKNOWLEDGMENTS
The computations were enabled by resources provided by the National Academic Infrastructure for Supercomputing in Sweden (NAISS) and the Swedish National Infrastructure for Computing (SNIC) at National Supercomputer Centre (NSC) partially funded by the Swedish Research Council through grant agreements no. 2022-22-955 and no. 2018-05973.
Open Research
DATA AVAILABILITY STATEMENT
All data are available as supporting information.


