
Angiogenesis-elicited spectral responses of early invasive skin melanoma: Implications for the evaluation of lesion progression
Abstract
Early invasive skin melanoma (EISM) associated with partial tumor invasion to the thin and optically complex papillary dermis (PD) represents a critical stage before the onset of metastasis. EISM lesions may be accompanied by angiogenesis, which can alter the PD's blood and fibril contents. A comprehensive understanding about these interconnected processes is essential for enhancing the efficacy of EISM optical evaluation methodologies. Employing a first-principles computational approach supported by measured data, we systematically assess the impact that angiogenesis can have on the EISM's spectral responses. Our findings indicate that these responses are discernibly affected by angiogenesis under distinct physiological conditions, with more substantial tissue alterations leading to accentuated spectral changes in the 550–600 nm region. Accordingly, we propose the use of a customized low-cost spectral index to monitor these processes. Furthermore, our investigation provides a high-fidelity in silico platform for interdisciplinary research on the photobiology of evolving skin melanomas.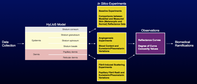
1 INTRODUCTION
Skin melanoma is a highly metastatic form of cancer. It can rapidly become life-threatening once the malignant tumor evolves to a vertical-growth phase (VGP) within the cutaneous tissues [1, 2]. The incidence of this deadly type of cancer has increased worldwide in the last decades, notably in lightly-pigmented populations [3]. In 2023, from 97 610 new cases expected in the United States alone, 7990 were estimated to have led to the patients' death [4]. Despite recent biomedical advances involving skin melanoma therapies, it is still considered a difficult-to-treat cancer, notably after metastasis has been initiated [3, 4].
These aspects make the early screening and correct staging of skin melanoma crucial for its effective treatment and positive prognosis [2, 3, 5, 6], notably in regions with limited access to specialized medical facilities. Such requirements led to the development of noninvasive optical technologies to aid physicians and practitioners to perform the time-sensitive evaluation of melanoma lesions [2, 7, 8], and potentially avoid biopsies that can pose additional risks to patients [6, 9]. These technologies are often based on the interpretation of the suspected lesions' spectral responses, which are usually quantified in terms of cutaneous reflectance.
There are still practical and scientific issues that need to be properly addressed to increase the efficacy of these technologies, however. In particular, more effective protocols are needed for the verification of phase transitions, from radial-growth phase (RGP) lesions to early invasive tumors (VGP lesions), and from those to deeply invasive tumors [1, 10, 11]. In the case of early invasive melanomas, which represent a biologically and clinically critical stage before the onset of metastasis [12], this situation is aggravated by the scarcity of information about the impact that biophysical factors associated with tumor progression may have on the spectral responses of these malignant lesions.
Melanoma lesions arise from melanocytes, specialized cells normally present in the skin, eyes and hair [1]. Within the skin, these cells are predominantly located in the basal layer (stratum basale) of the epidermis tissue [1, 13]. They produce melanin, a strong absorber of light in the ultraviolet (UV) and visible spectral domains [14-16]. Two main types of this pigment, the dark-brown eumelanin and the red-yellow pheomelanin [16], can be found within the cutaneous tissues in a colloidal form (termed melanin dust) or clustered in organelles known as melanosomes [17, 18]. These, in turn, can occur individually or in groups surrounded by a transparent membrane forming structures called melanosome complexes [17, 19].
The cutaneous melanins are responsible for regulating UV-dependent physiological processes such as tanning [20, 21], and for markedly contributing to the skin's visible spectral responses [14, 22]. These are also noticeably affected by the presence of other absorbers (e.g., hemoglobins, bilirubin and beta-carotene) and scatterers (e.g., organelles, collagen fibers and collagen fibrils) found in the skin tissues [14].
Skin melanomas are characterized by the presence of severely atypical melanocytes in the epidermal and dermal tissues [12, 23]. In addition to producing abundant dark melanin, that is, quantities with a ratio of eumelanin to pheomelanin higher than that observed in normal cutaneous tissues [24, 25], these cells may also be subjected to autophagy [26, 27]. During this intracellular process, organelles are sequestrated by membranous vesicles, termed autophagosomes, which eventually dispose of their contents for degradation and recycling [27, 28].
In the case of invasive skin melanomas, the encapsulated organelles have been identified as heavily melanized melanosomes [26]. It has been noted that, besides appearing in the epidermis during the melanomas' RGP, autophagosomes are also commonly observed in the invasive melanocyte cells found in the dermis during the melanomas' VGP [24, 26].
It has also been observed that angiogenesis, the process of generation of new blood vessels from pre-existing ones, may take place as a malignant lesion transitions to a VGP [29-31], with a vascular network being formed adjacent to the upper component of the tumor and subtumoral vessels also being affected [12, 32]. This process ensures the supply of oxygen and nutrients for malignant tumor growth, invasion and metastasis [30, 31]. Accordingly, tumor vascularity has been associated with melanoma mortality rate [33].
As the atypical melanocyte cells and new blood vessels start to occupy the papillary dermis, fibers and fibrils are pushed down into the reticular dermis [34]. The resulting increase in the dermal blood content and reduction of the papillary dermis' volume fraction occupied by fibrils are likely to affect the way that light is attenuated within these skin layers. More precisely, these angiogenesis-elicited changes may increase the amount of light absorbed by blood-borne pigments, notably hemoglobins [14], and reduce the amount of fibril-induced scattering. The effects that these intertwined changes can have on the spectral responses of melanocytic specimens, notably in early tumor invasion stages, remains to be unravelled [23].
In this work, we seek to strengthen the knowledge about these biophysical phenomena and, thus, contribute to the development of more effective procedures employed in the noninvasive optical evaluation of early invasive skin melanoma, henceforth referred to as EISM. We also provide a predictive computational (in silico) platform for fundamental and applied research on elusive photobiological phenomena associated with the progression of melanoma lesions.
More specifically, we examine the impact that angiogenesis and related morphophysiological changes may have on the spectral responses of EISM lesions. Our investigation is focused on skin melanomas classified as Clark level II and Breslow stage I [35], that is, those that have penetrated the upper dermal layer, the papillary dermis, without completely filling it [12], and whose thickness is below 0.76 mm [2], respectively.
Some of the main challenges in this area are associated with the practical difficulties to carry out in vivo and/or in vitro experiments to quantify those tissue changes without altering other biophysical characteristics of the EISM specimens under examination. To overcome these in situ experimental constraints, we employed an investigation framework based on first-principles simulations supported by measured data. We note that similar in silico approaches are often used in the study and testing of biomedical scenarios that cannot be thoroughly investigated using traditional “wet lab” experimental techniques [9, 31, 36, 37].
The in silico approach employed in this work enabled us to conduct controlled experiments in order to obtain a comprehensive assessment of the impact of angiogenesis-triggered tissue changes on EISM's spectral responses. Furthermore, it allowed us to systematically examine the sensitivity of these responses to variations in other relevant EISM parameters. These included distinct values for the ratio of eumelanin to pheomelanin present in their atypical melanosomes, and different values for the radius of the collagen fibrils found in the papillary dermis.
2 MATERIALS AND METHODS
2.1 Specimens' characterization
In this work, we elected to focus on skin specimens, in normal and melanocytic (EISM) states, with a relatively low level of constitutive pigmentation. This choice was motivated by two reasons. First, lightly pigmented specimens represent the population group most susceptible to develop skin melanomas [3]. Accordingly, the available measured spectral datasets for skin melanoma tend to correspond more frequently to lesions found in patients belonging to this group. This, in turn, brings the second reason, namely, consistency with the measured spectral datasets [38] employed as baseline references in our investigation.
The values assigned to the parameters used in the characterization of the skin specimens considered in this investigation and kept fixed during our in silico experiments are provided in Table 1. More precisely, they were used to characterize the main cutaneous tissues, namely (from top to bottom) the stratum corneum (SC), the stratum granulosum (SG), the stratum spinosum (SS), the stratum basale (SB), the papillary dermis (PD) and the reticular dermis (RD). The selection of the parameter values depicted in Table 1 was guided by their reported biophysical ranges whose literature sources are listed elsewhere [22, 39] for conciseness.
| Description | Value |
|---|---|
| Morphological parameters | |
| Ratio of skin surface folds | 0.1 |
| SC thickness (cm) | 0.0008 |
| SG thickness (cm) | 0.0033 |
| SS thickness (cm) | 0.0033 |
| SB thickness (cm) | 0.0033 |
| PD thickness (cm) | 0.01 |
| RD thickness (cm) | 0.1 |
| Melanin parameters | |
| SG colloidal melanin content (%) | 1.5 |
| SS colloidal melanin content (%) | 1.5 |
| SB colloidal melanin content (%) | 1.5 |
| Melanosome parameters | |
| Dimensions (μm × μm) | |
| Mel. complex diam./Mel. major axis | 2.0 |
| Blood and beta-carotene parameters | |
| Oxygenated hemoglobin fraction (%) | 85.0 |
| Functional hemoglobin conc. (g/L) | 135.0 |
| Methemoglobin conc. (g/L) | 1.5 |
| Carboxyhemoglobin conc. (g/L) | 1.5 |
| Bilirubin conc. (g/L) | |
| Beta-carotene conc. (g/L) | |
| SC beta-carotene conc. (g/L) | |
| Epidermis beta-carotene conc. (g/L) | |
| Water and lipid parameters | |
| SC water content (%) | 35.0 |
| Epidermis water content (%) | 90.0 |
| PD water content (%) | 65.0 |
| RD water content (%) | 75.0 |
| SC lipid content (%) | 10.0 |
| Epidermis lipid content (%) | 1.0 |
| PD lipid content (%) | 5.0 |
| RD lipid content (%) | 5.0 |
| Keratin, urocanic acid and DNA parameters | |
| SC keratin content (%) | 55.0 |
| SC urocanic acid density (mol/L) | 0.01 |
| DNA density (g/L) | 0.185 |
| Refractive indices | |
| Melanin refractive index | 1.7 |
| SC refractive index | 1.55 |
| Epidermis refractive index | 1.4 |
| PD refractive index | 1.39 |
| RD refractive index | 1.41 |
| Scattering parameters | |
| PD scatterers (fibrils) refractive index | 1.5 |
| PD scatterers (fibrils) radius (nm) | 100.0 |
- Abbreviations: PD, papillary dermis; RD, reticular dermis; SB, stratum basale; SC, stratum corneum; SG, stratum granulosum; SS, stratum spinosum.
Quantitative data about specific variations in specimen parameters affected by tumor progression are scarcely available in the literature. Thus, the selection of the parameter values used to characterize the EISM specimens was guided by qualitative information compiled from scientific sources addressing the tumor-prompted morphophysiological changes relevant for this investigation. The considered changes included the increased presence of melanin-producing melanocytes [27] in the epidermal layers [12, 24], the abnormal presence of melanin-producing melanocytes in the dermal layers [23, 24], the occurrence and size of autophagosomes [26, 28], the higher eumelanin to pheomelanin ratios in the autophagosome-encapsulated melanosomes [24-26], the increased blood content in the dermal layers [12, 32, 40], and the reduction of the volume fraction occupied by the PD fibrils, which are pushed down by the invasive tumor [12, 34].
Based on the aforementioned aspects, we assigned to those parameters expected to be noticeably affected by the specified morphophysiological changes the values depicted in Table 2. We note that, although a tumor may be expected to alter the presence of water and lipids in the invaded tissue, these materials have a negligible impact on the attenuation of light in visible domain [14]. Hence, in the absence of supporting information, we also elected to assign to the EISM parameters associated with these materials the default values provided in Table 1.
| Description | Normal | EISM |
|---|---|---|
| Melanosome parameters | ||
| SG melanosome content (%) | 0.0 | 1.5 |
| SS melanosome content (%) | 0.0 | 1.5 |
| SB melanosome content (%) | 1.25 | 2.5 |
| PD melanosome content (%) | 0.0 | 8.0 |
| Eumelanin concentration (g/L) | 32.0 | 41.0 |
| Pheomelanin concentration (g/L) | 4.0 | 2.0 |
| Autophagosome parameters | ||
| SG encapsulated melanosome (%) | 0.0 | 50.0 |
| SS encapsulated melanosome (%) | 0.0 | 50.0 |
| SB encapsulated melanosome (%) | 0.0 | 50.0 |
| PD encapsulated melanosome (%) | 0.0 | 100.0 |
| Diam./Mel. major axis | 0.0 | 2.0 |
| Blood parameters | ||
| PD blood content (%) | 0.14 | 2.0 |
| RD blood content (%) | 0.14 | 2.0 |
| Scattering parameters | ||
| PD scatterers (fibrils) fraction (%) | 22.0 | 14.0 |
- Abbreviations: PD, papillary dermis; RD, reticular dermis; SB, stratum basale; SG, stratum granulosum; SS, stratum spinosum.
In this investigation, we carried out three series of controlled in silico experiments, henceforth referred to as baseline, angiogenesis and fibril-induced scattering experiments. They consisted primarily in the computation of directional-hemispherical reflectance curves for normal skin and EISM specimens as described in Section 2.2.
It is worth stressing that our main guideline for the compilation of the specimens' characterization datasets (provided in Tables 1 and 2) was to select parameter values consistent with the related biomedical literature, and whose use would lead to modeled reflectance curves compatible with measured reflectance datasets acquired from real specimens. In this way, the modeled curves (obtained in our first series of experiments) could be employed as well-grounded baselines for our second and third series of experiments. Accordingly, without loss of generality, we used the measured reflectance datasets provided by Urso et al. [38], along with descriptive information about the melanocytic lesions considered in their work, as references for the fine-tuning of our selection of parameter values during the baseline experiments.
In the angiogenesis experiments, for the control (no angionesis) case, we used the default values assigned to the normal specimen's PD and RD blood contents (Table 2). For the subsequent cases, we used increasing values, from 1% to 4%, for the PD and RD blood contents. These values were selected taking into account the increased vascularity reported for areas adjacent to the tumor [12, 32].
In the fibril-induced scattering experiments, for the control case, we used the default value assigned to the PD fibrils' radius (100 nm, Table 2). For the subsequent cases, we used decreasing values from 90 to 60 nm. These values were selected based on ranges reported for this morphological parameter in the literature [41, 42].
At last, following empirical observations reported in related works [24-26], we assigned to the ratios of eumelanin to pheomelanin present in the atypical melanosomes values higher than the ratio (32:4 [15, 16], Table 2) selected for typical melanosomes found in normal lightly-pigmented specimens. More specifically, for the EISM specimens, we assigned to these ratios, henceforth referred to as LowEPR and HighEPR, values equal to 41:2 (default ratio depicted in Table 2) and 50:1, respectively. This allowed us to increase the scope of our observations (Section 2.2).
2.2 In silico experimental framework
The controlled in silico experiments described in this work were conducted using the predictive model of light and skin interactions known as HyLIoS (Hyperspectral Light Impingement on Skin) [22]. This model employs stochastic algorithms that incorporate all main light absorbers and scatterers acting within the cutaneous tissues. Moreover, it explicitly takes into account the intra-tissue distribution of melanin in colloidal and aggregated (clustered within melanosomes) forms.
Recall that atypical, heavily melanized melanosomes present in melanoma lesions are found encapsulated by autophagosomes [27, 28]. Like the melanosome complexes, these membranous vesicles are also accounted for in the melanoma simulations performed using HyLIoS. For conciseness, we refer the reader interested in more information about the model's algorithms to its original description [22].
Within the HyLIoS ray-optics formulation [22], a ray interacting with a given specimen can be associated with any wavelength (denoted by λ) within a selected spectral range, which, in this work, corresponds to the visible domain from 400–700 nm. For uniformity, we considered an angle of incidence of 0° and a spectral resolution of 5 nm in all modeled reflectance curves. These curves were computed using a virtual spectrophotometer [43] and employing 106 sample rays (per sampled wavelength).
In the first series of (baseline) experiments, we computed reflectance curves for normal and EISM specimens. We then compared those curves with measured data provided by Urso et al. [38]. This allowed us to substantiate the plausibility of the specimens' characterization datasets and the predictive capabilities of the in silico experimental framework employed in this investigation. More precisely, we used as reference average reflectance values obtained from in vivo measurements performed on 573 normal specimens and 132 melanoma specimens [38] within the 420–700 nm spectral range, with an interval of approximately 40 nm [44].
In the second series of (angiogenesis) experiments, we computed reflectance curves specifically associated with variations in dermal blood content to examine the impact of distinct angiogenesis levels on the EISM's spectral responses. Subsequently, in the third series of (fibril-induced scattering) experiments, we computed reflectance curves specifically associated with variations in the radius of the PD fibrils to examine how distinct magnitudes of fibril-induced scattering may affect these responses.
We also remark that the second and third series of experiments were carried out twice considering different ratios of eumelanin to pheomelanin present in the atypical melanosomes encapsulated within the autophagosomes (Section 2.1). This enabled us to explicitly assess the effects of these ratios on the specimens' spectral responses.
Arguably, two aspects are essential for the validity of any in silico investigation, namely fidelity and reproducibility. The former is directly associated with the predictive capabilities of the computer model used in the simulations performed during a given investigation, that is, the degree to which it can approximate the behavior of a real material in a measurable manner [45].
Hence, it is relevant to point out that the radiometric predictions provided by HyLIoS have been extensively evaluated through comparisons with measured data [22]. This has enabled its effective use in a number of biomedical investigations involving skin optical properties [46-48]. Moreover, the results obtained in our baseline experiments (Section 3.1), further illustrate the fidelity of its predictions.
Regarding the reproducibility of our findings, we note that we have made HyLIoS accessible for online use [49]. Also, all supporting datasets (e.g., refractive indices and extinction coefficients) employed in our in silico experiments are openly available in a dedicated data repository [50].
2.3 Sensitivity analysis
In order to examine the impact of increasing angiogenesis levels and the effects of decreasing magnitudes of fibril-induced scattering on the EISM's spectral responses across the visible domain, we conducted a differential sensitivity analysis [51, 52] on the corresponding reflectance curves across the blue (400–500 nm), green (500–600 nm) and red (600–700 nm) regions of the light spectrum. For this analysis, we employed a sensitivity index (SI) that provides the rate of the change in the output quantity, which corresponds to skin reflectance in this investigation, to the change in a selected skin characterization parameter while the other parameters are kept fixed [52]. A rate equal to 1.0 indicates complete sensitivity (or maximum impact), while a rate less than 0.01 indicates that the output quantity is insensitive to changes in the selected parameter [47, 53].
2.4 Degree of curve concavity
Upon a closer examination of the reflectance curves obtained in our in silico experiments, we noticed a relevant spectral feature within the 550–600 nm spectral interval. More precisely, the curves computed considering increasing amounts of dermal blood content depicted a noticeable up concavity within this region. Furthermore, this concavity tends to become more pronounced as the smaller values for the PD fibrils' radius are considered.
We note that the curve representing a differentiable function is concave up on the interval where is increasing, and concave down on a interval where is decreasing [54]. Moreover, assuming that is twice differentiable on an interval , then the curve representing over is concave up if , and concave down if . We also remark that corresponds to a given skin reflectance curve in our investigation.
3 RESULTS
3.1 Baseline experiments
The modeled reflectance curves obtained for the normal and EISM specimens are presented in the plots depicted in Figure 1A,B, respectively. In these plots, we can observe the close agreement between the modeled curves and the measured data [38] used as a reference for our in silico experiments. We can also notice the presence of prominent spectral features. More specifically, for the normal specimen (Figure 1A), we can observe the “omega” shape in the 500–600 nm region. This feature, associated with the absorption spectrum of oxyhemoglobin [56], tends to be more accentuated in normal specimens when they have a relatively low melanin content [14]. For the EISM specimen (Figure 1B), on the other hand, we can observe the “step” feature in the 550–600 nm region, as well as the overall lowering and smoothening of its reflectance curve (in comparison with the curve obtained for a normal specimen) due to the increased presence of melanin. These aspects reiterate the plausibility of the employed specimen characterization datasets and the fidelity of the predictions provided by the employed in silico experimental framework.

For illustrative purposes, we generated skin swatches (depicted in Figure 2A) for the normal and EISM specimens whose respective modeled reflectance curves are depicted in Figure 1. The swatches' chromatic attributes were computed through the convolution of the relative spectral distribution of selected illuminants (presented in Figure 2B), the specimens' reflectance data and the spectral responses of the human photoreceptors [57]. This convolution process was carried out using a standard CIEXYZ to sRGB color system conversion procedure [58]. Note that the EISM specimen exhibits a “brownish” coloration observed in this type of lesion [5, 10] instead of a strong dark coloration observed in the deeply-invasive melanomas [24].

3.2 Angiogenesis experiments
To account for different levels of angiogenesis, we varied the blood content of the dermal layers (PD and RD). The resulting reflectance curves were divided in two sets. The first set was obtained considering the LowEPR, and the second considering the HighEPR. These sets of curves are presented in Figure 3A,B, respectively. For comparison purposes, we also addressed the case where the level of vascularity is equal to that of the adjacent healthy skin [32], that is, no evidence of angiogenesis. Accordingly, for this control (no angiogenesis) case, we considered the same dermal blood content employed for the normal specimen as indicated in Table 2.

As it can be observed in Figure 3A,B, without an increase in dermal content, the resulting reflectance curves exhibit a more linear behavior. More precisely, these curves present only a minor up concavity, represented by relatively low DCC values (Tables 3 and 4), in the 550–600 nm spectral interval. In other words, the characteristic “step” feature that can be brought about in this interval is less likely to be reproduced if angiogenesis is not incorporated into the simulations. This aspect is consistent with previous observations indicating that angiogenesis occurs in the early stages of tumor progression and invasion [32]. It also suggests that angiogenesis-elicited spectral responses can provide useful insights about the status of the EISM lesions (classified as Clark level II and Breslow stage I) specifically examined in this work.
| Dermal blood cont. | DCC | |||
|---|---|---|---|---|
| n.a. | 16.97 | 18.64 | 21.12 | 0.8 |
| 1% | 15.95 | 16.84 | 20.39 | 2.7 |
| 2% | 15.40 | 16.19 | 19.78 | 2.8 |
| 3% | 15.07 | 15.67 | 19.36 | 3.0 |
| 4% | 14.81 | 15.43 | 19.03 | 3.1 |
- Note: The reflectance (ρ) values (in %) at 550, 575 and 600 nm employed in the calculations are presented for reproducibility purposes.
- Abbreviation: n.a., no angiogenesis.
| Dermal blood cont. | DCC | |||
|---|---|---|---|---|
| n.a. | 15.56 | 16.84 | 19.04 | 0.9 |
| 1% | 14.73 | 15.68 | 18.48 | 1.8 |
| 2% | 14.33 | 15.16 | 18.08 | 2.1 |
| 3% | 14.09 | 14.75 | 17.81 | 2.4 |
| 4% | 13.89 | 14.58 | 17.51 | 2.2 |
- Note: The reflectance (ρ) values (in %) at 550, 575, and 600 nm employed in the calculations are presented for reproducibility purposes.
- Abbreviation: n.a., no angiogenesis.
For the angiogenesis cases, the effects of an increased dermal blood content are more noticeable in the 500–600 nm interval. This aspect can be verified by examining the curves presented in Figure 3A,B, as well as in the corresponding MSI graphs presented in Figure 4A,B. Moreover, as the dermal blood content increases, following the formation of larger vascular networks adjacent to the tumor [12, 32], the reflectance curves tend to present an up concavity in the 550–600 nm interval markedly more prominent than that observed for the no angiogenesis case.

We note that these aspects are discerned in both sets of reflectance curves. However, the set obtained considering the HighEPR depicted a lower magnitude associated with the higher volume fraction of eumelanin, which is a stronger absorber than pheomelanin in the visible domain [60]. In addition, the curves in that set were relatively closer to each other. Such a proximity was translated to lower MSI values (Figure 4A,B) in comparison with those calculated for the LowEPR specimens. This indicates a lower impact of angiogenesis on the spectral responses of the EISM specimen characterized by the HighEPR.
As it can be verified in Tables 3 and 4, the computed DCC values show a similar progression in response to increased dermal blood content. However, in the examined cases, the up concavity of the curves in the 550–600 nm interval showed only minor variations associated with higher dermal contents. This behavior, in turn, may result in non-monotonic DCC values for the corresponding levels of angiogenesis as illustrated in the transition from a 3% to 4% dermal blood content for the EISM specimen characterized by the HighEPR. We also note that the DCC values obtained for the EISM specimens characterized by the HighEPR were lower than those values obtained for the specimens characterized by the LowEPR. This indicates that the DCC may vary for different specimens subjected to the same level of angiogenesis. Hence, the DCC may be unsuitable for the absolute quantification of this phenomenon. Nonetheless, considering that angiogenesis is a dynamic process, the use of DCC values in the monitoring of its evolution in a given EISM lesion should not be discarded. We elaborate on these aspects in Section 4.2.
3.3 Fibril-induced scattering experiments
Natural variations of specimen characteristics can pose additional challenges to noninvasive optical procedures for lesion evaluation [7, 8]. In the case of EISM specimens, typified by a partial invasion of a tumor into the PD layer, the role played by PD fibril-induced scattering on light attenuation can become particularly relevant since it may elicit noticeable spectral alterations [12]. It has been reported that the fibrils' radius, a pivotal parameter for this type of light attenuation [22, 61], can vary considerably among individuals and skin sites [41, 42]. The question then becomes to what extent these variations in the fibrils' radius can affect the spectral responses of EISM specimens. During this series of experiments, we focused on this issue.
As it can be observed in Figure 5A,B, the overall magnitude of the resulting reflectance curves becomes markedly lower when smaller fibril radii were considered for a given level of angiogenesis (associated with the dermal blood contents depicted in Table 2). This can be explained by the fact that a decrease in the fibrils' radius leads to a scattering reduction. This type of scattering corresponds to the Rayleigh limit of the Mie scattering theory [61], and it is characterized by forward and backward lobes leading to an isotropic behavior on average [48, 62]. Hence, its reduction raises the probability of light to traverse the PD layer and reach the RD layer. The resulting longer light path length, in turn, increases the probability of absorption events to take place, which decreases the cutaneous reflectance.

Furthermore, as indicated by the MSI values depicted in Figure 6A,B, the impact of variations in the fibrils' radius was stronger in the green (500–600 nm) and blue (400–500 nm) regions. This can be explained by the fact that the fibril-induced (Rayleigh-type) varies with [61, 62]. Thus, spectral intervals associated with shorter wavelengths tend to be more affected.

We also note that the observed impact of the variations in the fibrils' radius was qualitatively similar for both sets of reflectance curves presented in Figure 5A,B, which were obtained considering the LowEPR and the HighEPR, respectively. This qualitative similarity was also endorsed by the MSI values depicted in Figure 6A,B. However, the set of curves obtained considering the HighEPR presented a lower overall magnitude.
Lower values for the PD fibrils' radius also resulted in an increase in the up concavity observed in the 550–600 nm region, with higher DCC values being obtained considering the LowEPR as it can be verified in Tables 5 and 6. More precisely, for a given level of angiogenesis, smaller values assigned to the PD fibrils' radius led to larger DCC values. This further highlights the need for taking into account the specimens' variability when interpreting their spectral responses [7, 8].
| PD fibrils' radius | DCC | |||
|---|---|---|---|---|
| 100 nm | 15.40 | 16.19 | 19.78 | 2.8 |
| 90 nm | 14.34 | 15.01 | 18.88 | 3.2 |
| 80 nm | 13.25 | 13.70 | 17.87 | 3.7 |
| 70 nm | 12.04 | 12.58 | 17.08 | 4.0 |
| 60 nm | 10.94 | 11.30 | 16.27 | 4.6 |
- Note: The reflectance (ρ) values (in %) at 550, 575 and 600 nm employed in the calculations are presented for reproducibility purposes.
- Abbreviation: PD, papillary dermis.
| PD fibrils' radius | DCC | |||
|---|---|---|---|---|
| 100 nm | 14.33 | 15.16 | 18.08 | 2.1 |
| 90 nm | 13.43 | 14.03 | 17.05 | 2.4 |
| 80 nm | 12.25 | 12.82 | 16.14 | 2.8 |
| 70 nm | 11.25 | 11.67 | 15.32 | 3.2 |
| 60 nm | 10.11 | 10.59 | 14.51 | 3.4 |
- Note: The reflectance (ρ) values (in %) at 550, 575, and 600 nm employed in the calculations are presented for reproducibility purposes.
- Abbreviation: PD, papillary dermis.
4 DISCUSSION
4.1 Feasibility of controlled experiments
Despite its relatively small thickness in comparison with the RD layer, the PD layer contains important light absorbers and scatterers. In order to systematically examine the distinct effects that tumor-trigered changes may have on the spectral responses of EISM specimens, it is necessary to control the specific variations in these PD biophysical parameters while accounting for the presence of atypical autophagosome-encapsulated melanosomes. Such comprehensive studies are still not feasible under in vivo conditions, however.
Although a number of biological variables can be kept constant under in vitro experimental conditions, the systematic modification of selected specimen's traits (e.g., reduction of its fibrils' radius) is still not attainable. Moreover, when a specimen, or a skin graft, is extracted for experimentation, its optical properties are likely affected since the extraction procedure itself can alter its morphology and physiology [6].
In short, the EISM's characteristics, notably associated with the tumor partial invasion into the optically complex PD layer [12], make their study difficult to be conducted using traditional experimental in vivo and/or in vitro approaches. As shown in this work, the use of an in silico experimental framework represents a practical alternative for conducting controlled, in-depth studies of EISM lesions, provided that it incorporates all relevant biophysical factors, and there is tangible evidence of the fidelity of its predictions.
4.2 Angiogenesis and EISM evaluation
The possibility of detecting angiogenesis using noninvasive data acquisition technologies has been previously discussed in the literature [33]. To the best of our knowledge, however, the impact of angiogenesis-triggered tissue alterations on the spectral responses of EISM lesions has not been explicitly examined in related works to date. In fact, the limited experimental data in this area has been highlighted by the scientific community [23, 33, 40].
As showcased by our in silico experiments, one of the major obstacles for the noninvasive optical quantification of angiogenesis effects is the inter- and intra-specimen variability of related biophysical parameters. In the case of EISM specimens, such a variability may involve not only different ratios of eumelanin to pheomelanin present in their atypical melanosomes encapsulated by the autophagosomes, but also distinct values for the PD fibrils' radius.
For the noninvasive evaluation of angiogenesis progression in EISM lesions, the examination of selected spectral features, similar to those that have been previously proposed for the characterization of RGP and deeply-invasive VGP lesions [23, 25, 38, 63, 64], may be considered. Such features may include the proposed computation of DCC values. We remark that, even though this spectral index may not be suitable for obtaining a quantitative measure of the angiogenesis levels of distinct EISM lesions due to specimen variability issues, it can potentially be employed to assist time lapse studies of a given lesion [23, 25, 33] without incurring significant costs. More precisely, DCC values may provide qualitative information regarding the onset of angiogenesis and its progression in EISM lesions, with a sudden increase of these values indicating the former, and an incremental increase indicating the latter as illustrated by the DCC values presented in Tables 3 and 4.
4.3 Data constraints
We remark that the characterization of melanoma lesions that are the object of spectrophotometric and imaging studies usually includes only a general description of the patient's level of pigmentation and the lesion's phase. Indeed, specimen-specific data, such as its pigment content and the size of its scatterers, are not reported in these studies. Moreover, when specimen information is made available, it is often disclosed in a summary format, that is, average, minimum and maximum values are provided with respect to a group of examined specimens. This situation is even more restrictive with respect to phenomena like angiogenesis [31, 33, 40] and for melanoma lesions in their early invasive stages [23].
These constraints underscore two important aspects. First, the need for more measured data of good quality, that is, accompanied by a detailed characterization of the target specimens. Second, the pairing of traditional experimental efforts with in silico investigation approaches may be instrumental for future advances in this area. While the former may be used to strengthen the predictive capabilities of the latter, this, in turn, may be used to generate reliable data for a wide range of specimens under different experimental and physiological conditions.
5 CONCLUSION
Our findings suggest that variations in EISM's spectral responses prompted by angiogenesis can potentially lead to the establishment of reliable spectral markers for the progression of these malignant lesions. They also indicate that these responses are inversely modulated by pivotal specimen traits, notably their eumelanin to pheomelanin ratio and the size (radius) of the PD fibrils.
Due to the PD's morphophysiological characteristics as well as technical constraints, controlled experiments to extensively investigate the effects of angiogenesis-induced PD alterations on the EISM's spectral responses have not be conducted under in situ conditions to date. Our in silico experimental results indicate, however, that these effects and their modulation by specific specimen's traits need to be taken into account so that these responses can be correctly interpreted.
We proposed the use of a spectral index, DCC, to quantify variations in angiogenesis-elicited spectral responses of EISM lesions. This index can be obtained using only three spectral samples. Thus, it could be incorporated into noninvasive protocols to monitor lesion evolution at a relatively low cost. This aspect is particularly relevant for point-of-care technologies.
The timely evaluation of skin melanomas can significantly increase the chances of recovery and prolonged survival of patients. Accordingly, the search for cost-effective and low-risk technologies that can be used to aid clinicians to perform this task continues to be a focal point for scientific and engineering efforts in this area [7, 8, 10, 11]. The development of these technologies, however, requires a comprehensive understanding about the interconnected biophysical phenomena associated with these lesions.
Besides contributing to these efforts, this investigation can also be seen as a proof of concept for the employed in silico experimental framework. This first-principles simulation platform can be instrumental to future biomedical studies and applications by enabling not only the predictive testing of hypotheses associated with melanoma photobiology, but also the generation of in silico spectral datasets to support those research initiatives.
FUNDING INFORMATION
This work was supported by the Natural Sciences and Engineering Research Council of Canada (NSERC Discovery Grant 238337).
CONFLICT OF INTEREST STATEMENT
The authors declare that there are no competing interests.
Open Research
DATA AVAILABILITY STATEMENT
We remark that the computer model (HyLIoS) employed in our investigation is available for online use [49] upon request, and the supporting biophysical datasets (e.g., refractive indices and extinction coefficient curves) used in our in silico experiments are openly available in a dedicated data repository [50]. Additional data and information can also be obtained from the contact author (Gladimir Baranoski, [email protected]) upon request.