Potential of Raman-Reflectance Combination in Quantifying Liver Steatosis and Fat Droplet Size: Evidence From Monte Carlo Simulations and Phantom Studies
Funding: The work was supported by Research Nova Scotia.
ABSTRACT
This study explores a combined strategy of Raman and reflectance spectroscopy for quantifying liver fat content and fat droplet size, crucial in assessing donor livers. By using Monte Carlo simulations and experimental setups with oil-in-water phantoms, our findings indicate that Raman scattering can solely differentiate between varying fat contents. At the same time, reflectance intensity is influenced by both fat content and oil droplet size, with a more pronounced sensitivity to fat droplet size. This study demonstrates the efficacy of combined Raman and reflectance spectroscopy in assessing liver steatosis and fat droplet size, potentially aiding in assessing donor livers for transplantation.
Abbreviations
-
- HS
-
- hepatic steatosis
-
- IR
-
- infrared
-
- Ld-MaS
-
- large droplet macrosteatosis
-
- LT
-
- liver transplantation
-
- MaS
-
- macrosteatosis
-
- MiS
-
- microsteatosis
-
- PNF
-
- primary non-function
-
- Sd-MaS
-
- small droplet macrosteatosis
1 Introduction
Hepatic steatosis (HS), a condition marked by the accumulation of fat within hepatocytes, plays a pivotal role in liver diseases. [1] The observable fat accumulation consists of two forms: either as smaller (<0.5 μm in diameter), distinct droplets mixed with the cytoplasm without displacing the nucleus, known as microsteatosis (MiS), or as large droplets (several microns in diameter) that are able to push aside the cells' cytoplasm and nucleus, known as macrosteatosis (MaS). [2-4] The latter includes the subtypes of small droplet macrosteatosis (Sd-MaS) and large droplet macrosteatosis (Ld-MaS). [3] Sd-MaS is identified by multiple lipid droplets (e.g., 1–2 μm in diameter) within hepatocytes that do not displace the nucleus, while Ld-MaS involves a singular, sizable lipid droplet (up to 50 μm in diameter) that causes the nucleus to be displaced [2, 5, 6].
As the only lifesaving option for patients with end-stage liver failure, liver transplantation (LT) is impacted by the degree of HS which is a significant consideration in the selection of donor livers. [7] While there is still some debate about the effect of MiS on liver transplant failures, the prevailing view is that MiS does not increase the risk of primary non-function (PNF) in liver transplants, except in situations where a re-transplantation is involved. [8, 9] Sd-MaS and MiS are usually considered as one entity, with a relatively low risk to PNF in LT, [10] though limited studies reported that Sd-MaS was associated with post-LT rejection. [11, 12] Ld-MaS is widely believed to be the major type of HS negatively impacting LT. There are common agreements, including the Banff consensus, that a donor liver with greater than 30% Ld-MaS is directly linked to the occurrence of reperfusion syndrome following LT, and severe (>60%) Ld-MaS is associated with a high risk of poor graft function. [8, 13, 14] It can be readily inferred that larger fat droplets and a higher degree of HS (Ld-MaS) correlate with an increased potential risk of graft dysfunction.
It is worth noting that both donor and recipient factors influence the outcome; therefore, a defined Ld-MaS percentage cutoff does not result in the best overall benefits for all LT recipients. [14, 15] When liver biopsy (the “gold” standard) informs the LT team about the type (Mis, Sd-MaS, and Ld-MaS) and extent of HS of donor livers, expanding utilization of steatotic livers helps ease the shortage of liver grafts and save more lives, without detriment to graft outcome. [16] However, only a small portion of donor livers are assessed by biopsy before or during donor liver recovery. In the United States, only 32.8% of eligible donor livers during the period of January 2017 to March 2021 had biopsy results recorded, according to our previous study on data from the Organ Procurement and Transplantation Network. [17] Obviously, aiming at best utilizing all eligible donor livers, there is a demand for quick and accurate approaches to quantifying fat content and fat droplet sizes in steatotic donor livers as a supplement to liver biopsy.
Spectroscopic methods, due to their non-invasiveness and immediacy, are hopeful for realizing non-invasive real-time quantification of HS. [18] Infrared (IR) spectroscopy, [19-21] reflectance spectroscopy, [22-24] and Raman spectroscopy [25-27] were all reported valid in quantifying liver fat; however, size measurements of fat droplets using these spectroscopic methods lack investigation. This could be due to the limitations of current data analysis techniques, which may not be enough to simultaneously interpret both fat content and fat droplet size from the same spectroscopic data.
Although they are all spectroscopic methods, the physical information carried by reflectance spectroscopy differs from that of IR spectroscopy and Raman spectroscopy. On a molecular level, IR and Raman spectroscopy provide information about rotations and vibrations of chemical bonds [28], while reflectance spectroscopy is sensitive to electronic transitions which depend on molecule type and particle size. [29] This opens the possibility of simultaneously measuring fat content and fat droplet size by combining reflectance spectroscopy and Raman/IR spectroscopy. In our previous study, we developed an ambient light-compatible spectroscopic probe that combines Raman and reflectance spectroscopy and evaluated 70 human liver specimens. [27] Some evidence showed that the Raman-reflectance method could classify Ld-MaS from overall HS; [27] however, this speculation lacked support from fundamental studies.
Monte Carlo simulations are potent tools for exploring biophysical mechanisms. Ghugre et al. conducted studies on the effects of liver iron overload (correlated with HS) on MRI outcomes. [30] Shrestha generated a realistic fatty rodent liver model, including sizes and distribution of fat molecules, for MRI characterization of HS. [31] Utilizing human liver biopsy samples, Wang et al. simulated the spatial distribution of fat droplets in fatty livers, paving the way for advanced biophysical studies that leverage the distribution of these fat droplets [32].
In this study, we focus on using a combination of Raman and reflectance spectroscopy for measuring liver fat content and droplet size. Through Monte Carlo simulations and experimental setups, it aims to enhance our understanding of light-tissue interaction for quantifying liver steatosis and fat droplet size, thereby linking theoretical models to practical biomedical applications.
2 Materials and Methods
2.1 Oil-In-Water Phantoms
We created lecithin-based emulsions as oil-in-water phantoms by adding sunflower oil into an aqueous solution, simulating the properties of steatotic livers. These emulsions were crafted with varying fat fractions of 30%, 40%, and 50%. The composition of these emulsions included a blend of sunflower oil, lecithin, glycerin, and water. Within this formulation, lecithin played a crucial role as an emulsifier, facilitating the dispersion of oil droplets throughout the aqueous medium. [33-35] Concurrently, glycerin functioned as a co-solvent, enhancing the stability and uniformity of the emulsion, ensuring consistency in the mimicry of HS [34].
We prepared the aqueous solution by adding 4.3 mL of vegetable glycerin (Noeast Foods, Canada) and 1.5 g of edible salt (NaCl) to 150 mL of deionized water in a beaker. This beaker was then placed on a hot plate at 25°C, with a stirring rate of 800 rpm. Subsequently, we added 3.0 mL of sunflower liquid lecithin (Now Foods, Bloomingdale, IL, USA) into the solution, administering it drop by drop. The stirring process was continued for more than 2 h until the complete dispersion of the lecithin within the aqueous solution.
Based on the fat content, the aqueous solution was divided into three parts, each mixed with sunflower oil. This mixture was then blended using the FoodVille MF05 Milk Frother at 23000 rpm for 3 min, resulting in “large droplet” emulsion samples with fat contents of 30%, 40%, and 50%. Each emulsion sample was split in two; one part was stored, and the other was further processed with a Biosonik III probe ultrasonicator at 35 W for 3 min to produce “small droplet” emulsions. For each fat concentration, we combined the “small droplet” and “large droplet” emulsion samples in varying ratios (0:5, 1:4, 2:3, 3:2, 4:1, 5:0) in glass scintillation vials to create three sets of phantoms (5 mL each) with distinct droplet size distributions, as shown in Figure S1. The phantoms were named “0%, 20%, 40%, 60%, 80%, or 100% large droplet” according to the “large droplet” ratios.
2.2 Microscope Characterization
Approximately 10 μL of each phantom sample was added onto a microscope slide, which was then covered with a coverslip on the same day the sample was prepared. The slides were sealed using nail varnish. Differential interference contrast imaging of these samples was performed the following day, with a ZEISS Axio Observer Z1 Confocal Microscope (ZEISS Microscopy) at 100× magnification.
2.3 Particle Size Distribution Analysis
The phantoms were stored at 4°C for 5 days and examined by a Beckman Coulter LS 13320 Particle Size Analyzer (Beckman Coulter, Indianapolis, IN, USA), equipped with the Aqueous Liquid Module for sample handling and was used to determine the particle size distribution of the oil-in-water emulsion samples. Samples at room temperature were slowly tipped up and down for 1 min to ensure homogeneity before being transferred to the sample chamber via pipette. Analysis was conducted for 60 s.
Utilizing a Fourier lens and a set of ring detectors to measure the angle of refraction, the instrument generates a scattering pattern of particles within the solution. Each particle's scattering pattern is distinctive to its size; larger particles scatter at small angles, while smaller particles scatter at larger angles. The particle size distribution of the scattering pattern is determined by applying the Mie theory of light scattering. [36] Mie theory assumes spherical, smooth, homogeneous particles with a known refractive index. For this study, a refractive index of 1.46 was assigned to the oil emulsion based on literature values using 10% intralipid [37].
To extend the lower limit of the measured particle size range, Polarization Intensity Differential Scattering (PIDS) technology is employed in the LS 13320. As accuracy diminishes for smaller particles due to increasing refracted angles, the PIDS method combines polarization effects of scattering with wavelength dependence at high angles, enhancing resolution for smaller particle sizes. The LS 13320 with PIDS application has a measuring range from 0.04 μm to 2000 μm, with results reported as volume percentages for each size bin in the distribution.
2.4 Mie Scattering Calculator
The Mie scattering calculator, available at the Oregon Medical Laser Center website (https://omlc.org/calc/mie_calc.html), was utilized to estimate the light scattering properties of particles within our samples. [38] This online tool implements the Mie theory to calculate scattering and absorption by spherical particles. Parameters such as particle size, wavelength of light, and refractive indices of the particle and medium were input based on our experimental conditions. The calculator provided us with detailed information on scattering coefficients, reduced scattering coefficients, and scattering anisotropy factors, which were integral to our Monte Carlo simulations.
2.5 Monte Carlo Simulations
A prism measuring 120 pixels × 120 pixels × 260 pixels was designed for the HS model, where each voxel measures 0.5 μm on each side. As Figure 1 depicts, a photon detector with a 30-μm diameter (equivalent to 60 pixels) was centrally positioned on the model's bottom surface. Voxel properties within a 10-μm (20-pixel) depth from this bottom surface were assigned to emulate the optical characteristics of water at a wavelength of 1064 nm. The remaining voxels were randomly assigned optical properties representative of fat and water at the same wavelength, with the probability of a voxel mimicking fat directly proportional to predetermined fat contents of 30%, 40%, and 50%. A “disk” beam with a diameter of 5 μm was introduced at the center of the plane, 10 μm above the bottom surface, and oriented to propagate upwards. By combining multiple adjacent voxels into one, we are able to adjust the size of the “fat” voxels.
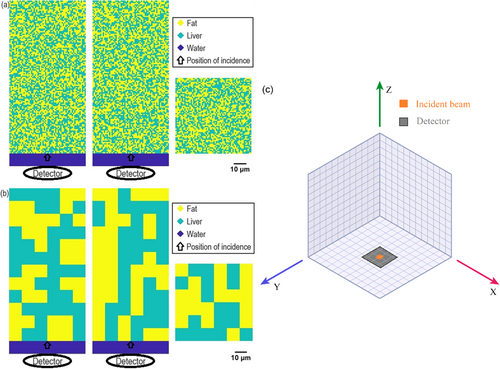
MCX (Monte Carlo eXtreme), an open-sourced Monte Carlo model for photon transport in complex bio-tissues, was applied to simulate the distribution of the excitation photons within the liver tissue model and detected reflectance photons by the photon detector. [39, 40] The distribution of the excitation photons was considered as a three-dimensional light source (which generates Raman scattering) inside the tissue volume. The inverse distribution method (also known as the “isoweight” approach), a photon emission approach for Raman scattering simulation atop MCX, was applied to simulated detected back-scattering Raman photons by the photon detector (https://github.com/alexandrepdumont/Raman-Monte-Carlo-Extreme). [41] The “isoweight” method includes a step where emission photons are launched in all directions (isotropically) with an initial value (weight) of one. This means each photon starts with the same chance of interacting with the tissue. The method then simulates how these photons move through the tissue, using the tissue's specific optical properties at the given wavelength.
Simulations were conducted using an Amazon EC2 g4dn.2xlarge instance, equipped with an NVIDIA T4 GPU (driver version 442.50). The computational environment consisted of a C++ compiler (installed through Microsoft Visual Studio 2017) and MATLAB 2017b. The actual cross-section of Raman scattering was not considered in these simulations, as the focus was solely on the relative intensity of Raman scattering across different models. The simulation files have been deposited here: https://github.com/HaoGuoMedPhys/Raman-Reflectance-based-on-MCX.git.
2.6 Ambient Light-Compatible Spectroscopic Probe
Our study employed a custom-developed spectroscopic system compatible with ambient light, as detailed in previous publications. [26, 27] This optical setup incorporated a continuous-wave laser at 1064 nm for sample illumination, a portable hand-held probe, and an optical filtering system for characteristic wavelength selection. To enhance signal detection, a benchtop lock-in amplifier SR510 (Stanford Research Systems, Sunnyvale, CA, USA) was utilized to amplify and isolate the detected voltage signals by InGaAs photodiodes (together with a customized transimpedance amplifier). The origin of the signals was the laser beam's excitation, modulated by a 5600 Hz periodic wave signal. The light reflected from the oil-in-water phantom is captured, guided back into the system, split into two distinct wavelength domains (reflectance at 1064 nm and Raman scattering at 1550 nm with a bandwidth of 30 nm, which corresponds to Raman characteristic peaks of lipids/proteins in the 2750–3050 cm−1 high-wavenumber region) and measured by the InGaAs photodiode detectors for further analysis, as depicted in Figures S2 and S3.
2.7 Measurement Procedures for Raman Scattering and Reflectance
During the measurements, the user (HG) held the handheld probe and positioned it on the bottom surface of the phantom containers. An incident light beam with a power of approximately 200 mW was directed at the phantom through the handheld probe and the container. The lock-in amplifier was adjusted to the phase where the maximum signal voltages were detected. Each measurement consisted of 100 data points, recorded at 100 ms intervals. The measurements were repeated three times for each sample.
3 Results
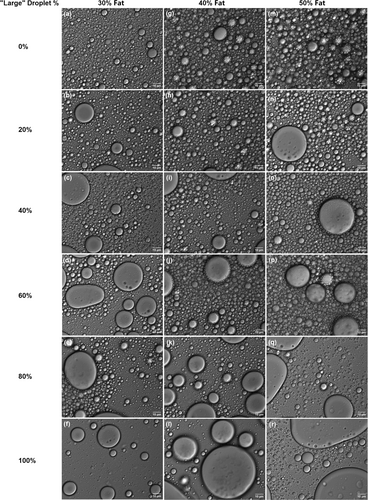
A total of 18 phantom samples, each with varying compositions of fat content and oil droplet size, were synthesized and examined. Figure 2a–r shows that with increasing proportions of “large droplet” samples, a higher incidence of droplets exceeding 20 μm was observed at 100× magnification. This trend was notable in all series with 30%, 40%, and 50% fat content. Additionally, a reduction in the number of droplets was observed in phantoms composed almost entirely of “large droplet” samples, attributable to an increase in the average droplet volume.
The particle size distribution measurements from the LS 13320 corroborated the trends seen in the microscopic images, as Figure 3a–c shows. Phantoms with a higher fraction of “large droplet” samples displayed a greater number of oil droplets in the >20 μm range, contrasting with the <20 μm range. Notably, the phantoms with “0% large droplet” exhibited a surprising scarcity of droplets with diameters <0.5 μm, deviating from the initial expectations (i.e., the “0% large droplet” phantoms should have the most droplets with diameters <0.5 μm and least droplets with diameters >20 μm) and inferences drawn from Figure 2. This anomaly could be attributed to the initial instability of the tiny droplets, which tend to merge into larger, more stable droplets during the transition from a metastable to a relatively stable state in the absence of ‘large droplet’ samples.

Assuming spherical geometry for the oil droplets, alterations in the diameter and concentration of these spheres (normalized based on the fat volume fractions), corresponding to the fat content, enabled the Mie scattering calculator to produce values for the scattering anisotropy, and scattering coefficient, . These values, together with the refractive index and the absorption coefficient of pure fat, as delineated in Table 1, were then utilized in subsequent Monte-Carlo Simulations. The scattering coefficient initially increases with increasing oil sphere diameter and decreasing oil sphere concentration, indicating a typical transition from the Rayleigh scattering region to the Mie scattering region. [42, 43] Beyond a certain point, the scattering coefficient decreases with fluctuations, consistent with the characteristics of Mie scattering. Notably, for a given oil sphere diameter , is positively correlated with the oil sphere concentration , indicating that oil (fat) contributes more to than water does. The detailed input parameters utilized for the Mie scattering calculator can be found in Table S1.
| 50%, 40% and 30% fat | 50% fat | 40% fat | 30% fat | 50% fat | 40% fat | 30% fat | ||||
| 1064 | 0.5 | 0.624 | 1.4747 [44] | 0.005364 [45] | 7.6E+00 | 6.1E+00 | 4.6E+00 | 103.6 | 82.83 | 62.09 |
| 1 | 0.867 | 9.5E−01 | 7.6E−01 | 5.7E−01 | 270.3 | 216.2 | 162.2 | |||
| 2 | 0.949 | 1.2E−01 | 9.5E−02 | 7.2E−02 | 519.2 | 416.7 | 312.4 | |||
| 3 | 0.966 | 3.5E−02 | 2.8E−02 | 2.1E−02 | 639.1 | 510.9 | 382.7 | |||
| 6 | 0.962 | 4.4E−03 | 3.5E−03 | 2.7E−03 | 370.5 | 296.7 | 222.1 | |||
| 10 | 0.931 | 9.5E−04 | 7.6E−04 | 5.7E−04 | 146.2 | 116.9 | 87.70 | |||
| 12 | 0.946 | 5.5E−04 | 4.4E−04 | 3.3E−04 | 160.4 | 128.2 | 96.28 | |||
| 20 | 0.942 | 1.2E−04 | 9.5E−05 | 7.2E−05 | 88.77 | 71.24 | 53.41 | |||
In the Monte Carlo simulations, the reflectance simulations were executed with a total of 108 incident photons, whereas the Raman simulations used 107 photons. The results of the Raman simulations are presented in arbitrary units due to the omission of the actual Raman scattering cross-section in these simulations. The reflectance simulations quantify the proportion of photons captured relative to the total number of incident photons. As demonstrated in Figure 4a,b, there was a positive correlation between the intensities of both Raman scattering and reflectance with the fat content, particularly noticeable with smaller oil droplet sizes. Notably, oil droplet size exerted a more pronounced effect on the intensity of reflectance than fat content, indicating a high sensitivity of reflectance to changes in oil droplet size. In contrast, while the intensity of Raman scattering varied with different oil droplet sizes, it exhibited less sensitivity to these size variations compared to reflectance.
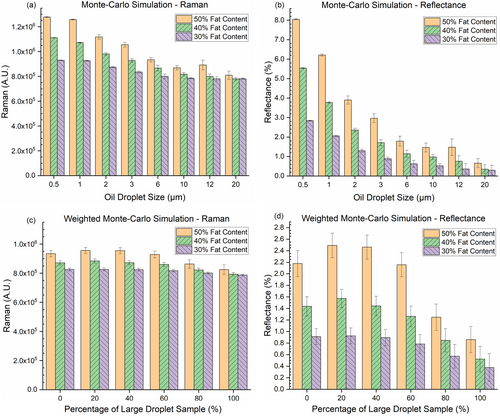
The weighted (by volume fraction) Monte Carlo simulations, as shown in Figure 4c,d, reveal comparable outcomes. We can barely extract size effects on the Raman scattering intensities. For the reflection intensities, they were sensitive to both the fat content and the oil droplet size. Notably all samples with “0% large droplet” displayed relatively weaker signals in both Raman scattering and reflectance in these weighted simulations. This observation could be attributed to the previously noted unexpected scarcity of droplets smaller than 0.5 μm in diameter in these samples, as discussed in Figure 3a–c.
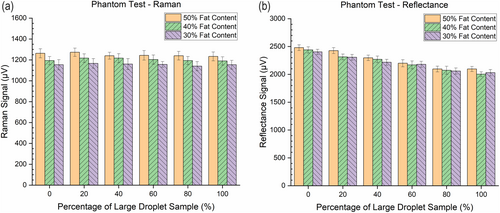
The results from measurements of Raman scattering and reflectance, by using the ambient light-compatible spectroscopic probe on oil-in-water phantoms, align with the outcomes of Monte Carlo simulations. As demonstrated in Figure 5a, the Raman channel could differentiate phantoms with varying fat content. However, the Raman signal voltages for phantoms with identical fat content but differing oil droplet sizes fell within error margins, rendering them ineffective for distinguishing phantoms with varied oil droplet size distributions. In contrast to the Raman channel, the signal voltages in the reflectance channel were influenced by both fat content and oil droplet size, as presented in Figure 5b. Not surprisingly, the oil droplet size exerted a more pronounced impact on the reflectance intensities than the fat content.
4 Discussion
This study aimed to understand the effectiveness of combining Raman and reflectance spectroscopy for measuring liver fat content and droplet size. We accomplished this by comparing Monte Carlo simulation results with experimental data obtained from oil-in-water phantoms. This finding is probably due to the change of the anisotropy factor g. The anisotropy factor is lower for smaller droplets, which leads to isotropic rather than forward scattering.
Despite the prominent size disparity between MiS (<1 μm in diameter) and Ld-MaS (up to 50 μm in diameter), as reported in previous studies, [2, 5, 6] the classification of Sd-MaS and Ld-MaS lacks a definitive physical size cutoff due to its reliance on cell morphology. [14] However, the reported typical droplets of Ld-MaS were usually larger than 20 μm in diameter. [2, 46] For practicality in sample preparation, size distribution analysis, and Monte Carlo simulations, we empirically designated droplets larger than 20 μm in diameter as representing Ld-MaS and those smaller as representing Sd-MaS and MiS.
The outcomes from non-weighted Monte Carlo simulations indicated a notable finding: samples with the smallest lipid droplets (<0.5 μm in diameter) exhibited reflectance intensities eight to 10 times higher than those with the largest droplets (>20 μm in diameter), given equal overall fat content. With smaller droplets the anisotropy factor tends to be lower, which leads to more isotropic scattering. Therefore, more light is backscattered than forward-scattered. In contrast, a 10% difference in fat content with constant droplet sizes, resulted in only a 20% relative difference in reflectance intensity. This pronounced discrepancy due to droplet size was also noted in the results of the weighted Monte Carlo simulations and actual optical measurements. In the Monte Carlo simulations, the photon counts are free from background noise, unlike actual optical measurements which include various sources of noise. Despite this difference, the observed trend that samples with a higher percentage of larger droplets exhibit weaker reflectance remains consistent. Since the change of reflectance intensity with oil droplet size is monotonical, with knowledge of the fat content in the oil-in-water phantoms, we could estimate their characteristic oil droplet size based on reflectance signal intensities, implying that these intensities are indicative of the phantoms' characteristic oil droplet size.
Although non-weighted Monte Carlo simulations suggested that Raman scattering intensities are influenced by both fat content and droplet size, this trend was not mirrored in the weighted simulations. Real-world optical measurement results on Raman scattering showed that samples with identical fat content had similar signal intensities, within the margin of uncertainty, while fat content positively influenced signal intensity. These findings are consistent with previous tests, indicating that Raman scattering is effective for accurate assessment of fat content in phantoms and liver specimens. [25-27] Thus, Raman scattering can determine overall fat content but cannot differentiate between samples with identical fat content and different oil droplet sizes. Combining fat content information, from Raman scattering, and reflectance measurements enables the identification of samples with larger oil droplets. This capability explains why the Raman-reflectance combination was effective in quantifying overall HS and Ld-MaS in prior trials on snap-frozen human liver specimens [27].
Our previous study on duck liver samples found the limit of detection for differentiating lipid content in tissue could be as low as 5% fat. [26] We observed a significant voltage difference between 0% and 40% large droplet content, consistent for the 50% fat phantom, with the 40% and 30% fat phantoms showing even better results. Given that tissue is unlikely to have 50% fat, a 20% limit of detection of large droplets in real liver tissue is more realistic. This estimated limit of detection would aid donor liver assessments, where the cut-offs for moderate and severe Ld-MaS are 30% and 60%. [8,13,14]A major limitation of this study was the comparatively small size of the fatty liver model used in the Monte Carlo simulations, measuring just 60 μm × 60 μm × 130 μm (120 pixels × 120 pixels × 260 pixels). This size is insufficient to adequately generate Raman scattering photons, especially considering the penetration depth of the 1064 nm laser in biological tissues, which can reach several millimeters. [47, 48] However, we believe that the overall size of the MC model is appropriate for all of the particle dimensions. As shown in Figure S4, the simulated reflectance was found to be strongly positively correlated with the reduced scattering parameter (which describes the diffusion of photons in a random walk) as expected. Among four common fitting models (presented in Figure S4 and Tables S1 and S2), a linear model, as previously reported [49, 50], can approximately describe the relationship between reflectance and the reduced scattering coefficient of biological materials The discrepancy between the Raman simulations and the experimental results may be attributed to this size limitation, primarily due to the computational capacity of the CPU and the memory of the GPU. While approximately served as a scaling factor in intragroup comparisons among reflectance at 1064 nm and Raman intensities at 1550 nm, the substantial differences in the absorption coefficients of fat and water at 1064 nm and 1550 nm (see Figure S3) suggest that a larger model could reveal a more pronounced nonlinearity in the relationship (as illustrated in Figure S4) between simulated reflectance and reduced scattering coefficient. [50] However, the real-world optical experiments helped to mitigate this simulation constraint.
Another limitation was the inhomogeneity of oil droplets in both the “large droplet” and the “small droplet” samples. Although size distribution analysis confirmed successful creation of concentration gradients in “large droplet” samples, spontaneous droplet amalgamation occurred, echoing phenomena reported in other studies. [51-53]. A potential alternative to the oil-in-water phantoms could be liposomes or lipid nanoparticles. [54] However, a new protocol would need to be developed and tested to imitate fat.
Additionally, our model, which utilizes fat droplets in aqueous solution, does not account for the complex cellular structures and large molecules (such as hemoglobins) present in liver tissues. These factors could affect the size-sensitive performance of reflectance measurements. This potential impact needs to be further explored to enhance the applicability of this method to real liver tissues.
5 Conclusions
This study unveiled the potential of a combined approach using Raman and reflectance spectroscopy for the quantitative assessment of liver fat content and fat droplet size. This approach is particularly pertinent in evaluating large droplet macrosteatosis of donor livers for transplantation. Using Monte Carlo simulations and experimental data obtained from oil-in-water phantoms, this study demonstrated that Raman scattering is effective in distinguishing between different levels of fat content. However, the Raman scattering measurements by our spectroscopic device did not provide significant differentiation based on fat droplet sizes. On the other hand, reflectance spectroscopy shows a distinct sensitivity to both the fat content and the droplet size, with a notably higher responsiveness to variations in droplet size.
Future research should focus on further optimizing these techniques for clinical use, ensuring they can be effectively applied in real-time assessments during the donor liver selection process. Overall, the insights provided by this study enhance our capabilities in the precise evaluation of hepatic steatosis, potentially leading to improved outcomes in liver transplantation.
Acknowledgements
The authors thank Gerard Gaspard for training Hao Guo for using the ZEISS Axio Observer Z1 Confocal Microscope. The authors also thank Mamadou Diop for critical reviewing this manuscript.
Conflicts of Interest
The authors Hao Guo and Kevin Hewitt have filed a patent application (PCT 112399W-90) in the US and China based (in part) on the results reported in this manuscript. Publication of this work confers legitimacy to their claims, and they stand to benefit as a result.
Open Research
Data Availability Statement
Additional data that supports the findings of this study are available in the supplementary material of this article.


