Rapid, label-free identification of cerebellar structures using multiphoton microscopy
Abstract
The cerebellum is the prominent laminar structure of the mammalian brain that has been implicated in various psychiatric and neurological diseases. Although clinical brain imaging techniques have provided precise anatomic images of cerebellar structures, a definitive diagnosis still requires adequate resolution to identify individual layers in cerebellar cortex, the extent of tumor, even requires the histological tissue examination during surgical procedures. In this study, multiphoton microscopy (MPM), based on second harmonic generation (SHG) and two-photon excited fluorescence (TPEF), was perform on the rat cerebellar structures and pathology with the combination of image analysis methods. Results show that MPM can reveal the cerebellar vermis, hemispheres, medulla, and ventricle, as well as axon bundles, Purkinje cells, capillaries, and the pia mater of the cerebellum. Together with custom-developed image processing algorithms, MPM could further differentiate between the gray and white matter, as well as evaluate the Purkinje cell layer, identify the cerebellar tumor boundary, and distinguish between the tumor core and peritumor regions. Our results establish a direct visualization and rapid assessment approach for the cerebellar structures, as well as suggest the feasibility of in vivo multiphoton microendoscopes and fiberscopes as clinical tools for neuropathological diagnoses.
1 Introduction
The cerebellum is the prominent laminar structure of the mammalian brain that plays a crucial role in motor learning and coordination 1, 2. Cerebellar vermis and two lateral hemispheres are composed of lobules formed by groups of folia 3. Abnormalities of cerebellar structures have been implicated in various psychiatric and neurological diseases, including stroke 4, tumors 5, schizophrenia 6, autism 7, and Alzheimer's disease 8. The visualization and understanding of these morphologic changes have also been associated with histoarchitectural features, such as cellularity, vascularity, and inflammatory infiltration. Therefore, to evaluate these features of the cerebellar structures, a technique that provides the morphology of tissue for a definitive diagnosis and intraoperative assessment is required.
To date, various approaches have been developed to improve neuroimaging accuracy. Integrated positron emission tomography/ magnetic resonance imaging (PET/MRI) should offer several options and complementary information involved in the disorders of the brain 9, while conventional MRI has been limited to preoperative or postoperative studies owing to the magnetic interference and restrictions of the surgical field 10. Intraoperative MRI (iMRI) provides a guide for neurosurgical interventions with noninvasive imaging, thus enabling the neurosurgeon to make decisions 11. However, compared with conventional surgery, iMRI-guided surgery requires 1 hour or longer for performance and interpretation. Additionally, the adoption of an iMRI system has substantially greater capital costs. Thus, these important technologies are limited, found in only the most advanced operating rooms, and restricted for many surgeons and patients 12, 13. Additionally, given the complex and convoluted structure of the cerebellum, such limited contrast and resolution are inadequate to clearly identify the boundaries of different layers and the histoarchitecture of the cerebellum at the subcellular level 14.
In recent years, label-free techniques have been increasingly potential in neuroscience. Optical coherence microscopy allows single myelin fiber imaging with >300 μm penetration depth on living rodents 15. Spectral confocal reflectance microscopy and near-infrared reflectance microscopy have detected myelinated axons in health and disease on fluorescent transgenic mice 16, 17. Coherent anti-stokes Raman scattering microscopy and stimulated Raman microscopy have identified brain tumor with high chemical selectivity 18, 19. Compared with these methods, although the imaging depth of MPM is limited to resolve deeper structures, MPM has ability to not only reveal axons but also visualize cell morphology and the extracellular matrix of tissue by unfixed, unstained, and non-fluorescent specimen at subcellular resolution. Meanwhile, based on two-photon excited fluorescence (TPEF) and second harmonic generation (SHG), MPM has showed multicolor imaging by allowing excitation of intrinsic various biomacromolecule with the same laser.
Although MPM could allow for subcellular resolution imaging in seconds, the image analysis of MPM images is a necessary and vital part for biophotonic diagnostics. Traditional image analysis method usually requires commercial image processing software to manual or semi-automatic processing, such as nucleus to cytoplasm ratio and fluorescence intensity, which is time-consuming and inaccuracy in histological examination. In this context, the combination of MPM and custom-developed image processing algorithms is emerging as a rapid, label-free, and reliable method that directly reveals morphological information and automatically provides quantitative description of images at high speed. Furthermore, several novel imaging algorithms have been developed to quantitatively characterize collagen morphology and segment the cell boundaries from MPM images of previous studies 20, 21.
To further illustrate the clinical potential of such a method, we combined MPM and image analysis methods to image normal and diseased cerebellar specimens without the need for fluorescent labels. In particular, by adding custom-developed image processing algorithms, MPM clearly reveals normal cytoarchitectural features of the rat cerebellum and pathologic hallmarks of human cerebellar tumors that offer rapid information supplemental to standard neuropathology, thus suggesting its potential application for the in vivo study of cerebellar diseases and monitoring of therapeutic intervention.
2 Materials and methods
2.1 Rat cerebellar specimen preparation
Five 8-week-old experimental Sprague-Dawley rats (250–300 g) were killed with cervical dislocation and decapitated. The whole cerebellum was obtained, embedded in OCT compound, and kept frozen at −20 °C until needed. Consecutive coronal and sagittal sections (10-μm thickness) were obtained with a Leica CM3050 freezing microtome. To keep the tissue structurally intact, we also prepared paraffin sections from formalin-fixed and paraffin-embedded cerebellar tissue. During the imaging process, the unstained specimens were perfused with a small amount of phosphate-buffered saline (PBS) to avoid tissue shrinkage. Immediately afterward, a cover slip was placed on the PBS-moistened specimens for imaging. For histological comparison, three consecutive sections were directly cut by cryostat microtome without standard histology procedures. Two of them were used for multiphoton microscopic imaging and the middle section was subjected to standard hematoxylin and eosin (H&E) staining to histological comparison to the multiphoton microscopic results. All experimental preparations were performed in accordance with the animal welfare guidelines of the First Affiliated Hospital of Fujian Medical University, China.
2.2 Human cerebellar specimen preparation
A total of seven human cerebellar hemangioblastomas specimens were obtained from the Department of Neurosurgery at the First Affiliated Hospital of Fujian Medical University. Patients were written informed consent for obtaining prior to study participation and approved the Fujian Medical University Clinical Research Screening Committee for Studies Involving Human Subjects. During preparation process, a portion of the tissue for routine diagnosis was transferred to the pathology laboratory with ice. Tissue section and MPM imaging was treated as described above. The pathological diagnoses of cerebellar tumor specimens were reaffirmed independently by two experienced neuropathologists.
2.3 Multiphoton microscopy
Multiphoton microscopic imaging system used in this experiment has previously been described in detail 22. Imaging was performed with high-throughput scanning inverted Axiovert 200 microscope (Zeiss LSM 510 META, Jena, Germany). The laser system used a mode-locked femtosecond Ti:Sapphire laser (Coherent Mira 900-F, Coherent, Inc., Santa Clara, CA, USA), tunable from 700 to 980 nm (Verdi-10; Coherent, Inc., Santa Clara, CA, USA). A Plan-Apochromat oil immersion objective (63×, NA=1.4, Zeiss) was employed to focus the excitation beam and collect the backwards signals. All images were obtained with ∼6 mW (at 810 nm excitation) average power at the objective. The META detector consists of an optimized 32-channel photomultiplier tube (PMT) array and high quality reflective grating to detect all signals in backscattered geometry.
Our experiments used two independent channels of the META detector to capture the TPEF and SHG signals from the specimen. One channel detected TPEF signals at 430 to 716 nm (color-coded red); whereas another channel detected SHG signals at 387 to 419 nm (color-coded green). The different independent channels have independent optimal parameters to adjust the image contrast and brightness, such as laser intensity, detection gain, amplifier offset, and amplifier gain. An optional HRZ 200 fine-focusing stage (HRZ 200 stage; Carl Zeiss, Jena, Germany) and automated tiling functions procedure were used to achieve large-scale images. The image acquisition time is 1.97 sec/frame with a resolution of 512 pixels×512 pixels. Acquisition times for the large-scale images are 27 min 3 sec (Figure 1), 24 sec (Figure 2), 18 sec (Figure 3), 2 min 6 sec (Figure 4), and 3 min 42 sec (Figure 5), respectively. Acquisition, reconstruction, and analysis of total images were acquired within 35 min. All images had a 12-bit pixel depth in our system.
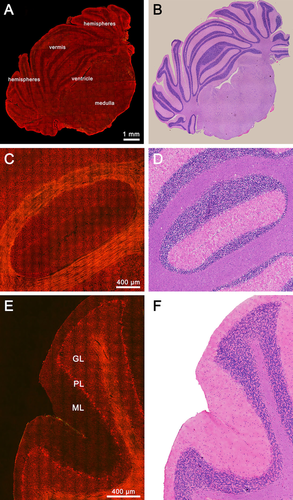
Normal rat cerebellar structures. (A) TPEF/SHG image of normal rat cerebellum in a full coronal section. (C) Representative TPEF/SHG image of cerebellar lobules in a coronal section. (E) Representative TPEF/SHG image of cerebellar lobules in a sagittal section. (B, D, F) Corresponding H&E-stained images. GL: granular layer; PL: Purkinje cell layer; ML: molecular layer.
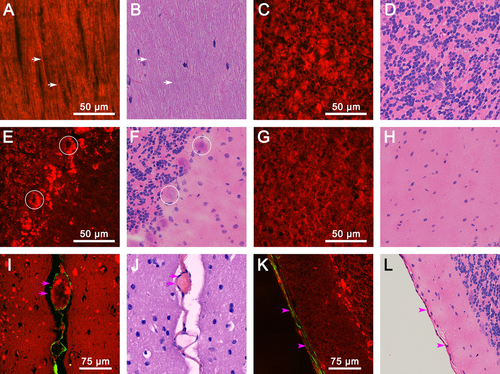
Magnified images of various cerebellar structures. (A) TPEF/SHG image of axon bundles. white arrows: axons. (C) TPEF/SHG image of the granular layer. (E) TPEF/SHG image of the Purkinje cell layer; circles: Purkinje cells. (G) TPEF/SHG image of the molecular layer. (I) TPEF/SHG image of the cerebellar capillary; pink arrows: fissure. (K) TPEF/SHG image of the cerebellar pia mater; pink arrowheads: pia mater. (B, D, F, H, J, L) Corresponding H&E-stained images.
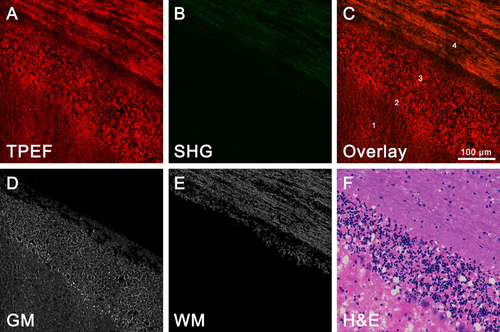
Differentiation of gray and white matter. (A) TPEF image (color-coded red). (B) SHG image (color-coded green). (C) Overlaid TPEF/SHG image. (D) Segmentation results of the gray matter. (E) Segmentation results of the white matter. (F) Corresponding H&E-stained images. 1: molecular layer; 2: Purkinje cell layer; 3: granular layer; 4: white matter; GM: gray matter; WM: white matter.
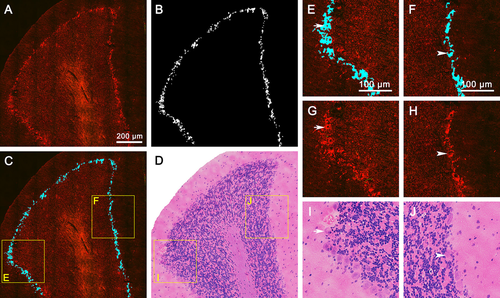
Detection of the Purkinje cell layer. (A) TPEF/SHG image of a representative cerebellar lobule. (B) Segmentation results of the Purkinje cell layer in a cerebellar lobule. (C) The Purkinje cell layer is highlighted in blue superimposed by the segmentation results. (D) Corresponding H&E-stained images of (A). (E, F) Zoom-in images in (C) show a magnified Purkinje cell layer compared with TPEF/SHG images. (G, H) Corresponding MPM images of (E, F); (I, J) Zoom-in images in (D) show corresponding H&E-stained images of (E, F). White arrows and arrowheads: representative Purkinje cells.
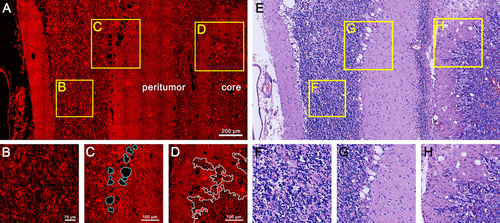
Identification of cerebellar tumor. (A) TPEF/SHG image of human cerebellar hemangioblastomas with representative tumor core and peritumor regions. (B) Zoom-in images in (A) show an abnormal granule cell layer. (C) Zoom-in images in (A) show segmentation results of vacuolated cells in the Purkinje cell layer (blue lines). (D) Zoom-in images in (A) show segmentation results of the boundary between the tumor core and peritumor regions (white lines). (E, F, G, H) Corresponding H&E-stained images.
2.4 Image analysis methods
2.4.1 Differentiation of gray and white matter
MPM images are segmented and analyzed using custom software developed in the MATLAB Image Processing Toolbox (The MathWorks, Inc.). Compared with gray matter, myelinated axons in white matter could emit the specific SHG signal. To further differentiate between gray and white matter, we use the following algorithm to extract the gray and white matter areas. First, the original SHG image of the white matter is converted to a grayscale image. Next, the Wiener filter is used to enhance the grayscale image 23, which can restore a blurred and noisy image. Second, the processed grayscale image is converted to a binary image, and the small objects (impurity areas) are removed, eventually creating a mask of white matter. Finally, the gray and white matter areas are segmented from the original TPEF image using the mask of white matter, setting the gray and white matter channels, respectively. Meanwhile, the impurity and noisy areas of these two channels are also removed.
2.4.2 Detection of the Purkinje cell layer
The Purkinje cell layer would be present in all subdivisions of the cerebellum, which is needed to depict the cerebellar cortex with higher resolution imaging. To automatically detect the Purkinje cell layer, the MPM images are processed using the following algorithm: first, the original MPM image in the RGB color space is converted to CIE Lab space. CIE Lab color space can analyze and compare different colors in the color space by computing the geometric distance, which has good performance in measuring tiny color variations. Additionally, channel L of the CIE Lab image is extracted and set as the grayscale image. Second, the grayscale image is enhanced by utilizing the Gaussian filter to denoise and extract the edge features. The morphological operators are employed to remove the small noises and fill the holes to obtain the outer contour of the targets. Next, the rough target area is obtained using the outer contour of the targets with morphology corrosion processing. Finally, the rough target area is processed using Fuzzy C–Means clustering with the spatial information (SFCM) algorithm to obtain the final segmentation results 24.
2.4.3 Delineation of the cerebellar tumor boundary
Visualizing the tumor boundary is critically important during surgery. A precision boundary could help the surgeon clearly see the tumor versus normal tissue. Thus, we developed the following program to delineate a clear cerebellar tumor boundary. First, the K-means clustering method was used to process original RGB images and remove unwanted noise from the images. Second, the wanted region was roughly selected as our new image, which was converted to a texture image using the entropyfilt function before it was converted to a binary image. Meanwhile, the hole of the new image was filled. Next, the Bwareaopen function of Matlab was chosen to remove the small objective of the new image. Third, edges of the left objective were created, indicating the border between the tumor cell region and the normal cell region. This edge was also used as a mask to label the tumor cell region and the normal cell region.
3 Results
3.1 Visualizing normal rat cerebellar structures
We start with the imaging of normal, intact, unstained tissue sections from the rat cerebellum. The large-scale mosaic MPM images of the entire cerebellum in Figure 1 A show a representative coronal section, containing the vermis, hemispheres, medulla, and ventricle, demonstrating the ability of MPM to detect large-scale histoarchitectural features. Meanwhile, magnified cerebellar lobules in both coronal and sagittal views can also display a tightly folded cortex, a central core of white matter, fissure, and the pia mater, which covers the cerebellum (Figure 1C and E). We effectively observe the striking contrasts between highly cellular regions within the gray matter and tightly packed fiber tracts within the white matter. In cellular regions, we also clearly identify the three-layered cerebellar cortex, namely, the granular layer (GL), Purkinje cell layer (PL), as well as molecular layer (ML).
At higher magnification, increasing detailed information about various cerebellar structures is shown in Figure 2. Linear, myelinated axon bundles and single myelinated axon fibers (white arrows) in white matter are clearly identified. They appear to be color-coded yellow because the uniform polarity microtubule arrays inside myelinated axons could both emit comparable SHG and TPEF signals (Figure 2 A) 25. The magnified granular layer, Purkinje cell layer, and molecular layer show visible clarity in Figure 2C, E and G. The cell nuclei are lacking fluorescent signals and appear as dark spots. By contrast, the cellular outline can clearly identify by the strong TPEF signals of NAD(P)H and FAD in the cytoplasm 26. In Figure 2C, densely packed small granule cells and Golgi cells appear as oval or round structures, which concentrate in cytoplasm-rich inclusions in the granular layer. Figure 2E displays a single row of Purkinje cells with large cell bodies (circles) and numerous fluorescent granules encircling neuronal nuclei in the Purkinje cell layer. However, glial cells and basket cells of the molecular layer present no fluorescent granules in the cytoplasm (Figure 2G). These results indicate that the cells in the cerebellar cortex have a highly regular arrangement and distinct composition of the cytoplasmic content. On the other hand, capillaries and the pia mater of the cerebellum could be recognized by the SHG signal of collagen fibers (pink arrows in Figure 2I and pink arrowheads in Figure 2 K) 26, which can be identified by the cerebellar lobules outlined and depicted in the collagen deposition. Thus, MPM can offer detailed information to visualize the normal cerebellar structures. The tissue architecture details are in perfect agreement with the corresponding H&E-stained images (Figure 1B, D, and F, Figure 2B, D, F, H, J, and L).
3.2 Automated differentiation of gray and white matter
The gray and white matter regions of the cerebellum can be used to divide the layers of the cerebellum. Differentiating between these two regions could aid the neurosurgeon in improving surgical precision. Thus, we obtained representative TPEF/SHG images of the gray-white matter junction in the cerebellar lobule (Figure 3). The overlaid image clearly display that large amounts of axons condense into thread-like axon bundles. Numerous white matter tracts were identified using the TPEF signal and comparable SHG signal, presenting a yellowish color (position 4 in Figure 3C). While the adjacent cortex gray matter included a molecular layer (position 1 in Figure 3C), the Purkinje cell layer (position 2 in Figure 3C) and granular layer (position 3 in Figure 3C) appeared red in color due to the strong TPEF signal. Molecularly, white matter and gray matter have distinct differences in composition. Thus, these distinct contrasts in MPM images provide an effective means to differentiate between the white matter and surrounding gray matter.
To further evaluate the contrasts, we next applied a program (See Materials and Methods 2.4.1) for the automated differentiation of gray and white matter in MPM images. In Figure 3D and E, representative images of gray and white matter segmentation are converted to grayscale images. Meanwhile, the impurity and noisy areas are also removed. We observe the striking contrast in the segmentation results and identify axon fibers more obviously. The average of images evaluation time required 4.8 sec with Figure 3D and E. Furthermore, the MPM images, segmentation results, and H&E-stained image (Figure 3F) show clear correlation at the subcellular level. These results indicated that the combined MPM and automated image analysis have further differentiated between the gray and white matter, as well as discerned a precise delineation of the border of the gray-white matter junction.
3.3 Automated detection of the Purkinje cell layer
Purkinje cells are the central functional unit of the cerebellar cortex 27. Generally, Nissl staining is a standard histological method for visualizing Purkinje cell bodies, while in the original MPM image, the middle Purkinje cell layer, the most superficial molecular layer, and the deepest granular layer of three-layered cerebellar cortex can be seen in the representative cerebellar lobule. Figure 4 A depicts that the Purkinje cell layer mainly contains a monolayer of Purkinje cells, showing stronger TPEF signals than background signals.
To rapidly evaluate the Purkinje cell layer in MPM images, we developed another program (See Materials and Methods 2.4.2) to automatically detect the location of the Purkinje cell layer throughout all subdivisions of the cerebellar cortex. The segmentation results of the Purkinje cell layer display clearly the background and enhanced boundaries (Figure 4B). In Figure 4C, the Purkinje cell layer is highlighted in blue and is superimposed, revealing the Purkinje cells are typically presented in a single row at the boundary between the molecular and the granular layer. Figure 4E and F illustrate magnified images with a precision boundary comparable to those of the MPM images. Representative Purkinje cells are marked with white arrows (Figure 4E, G, and I) and arrowheads (Figure 4F, H, and J). Compared with corresponding H&E-stained images (Figure 4D), the contrast of the segmentation results is obviously enhanced, and the Purkinje cell layer can be rapidly identified by highlighting. To assess the accuracy of the Purkinje cell layer detection, the segmentation results of the Purkinje cell layer (Figure 4B) and corresponding H&E-stained images were compared and confirmed by a certified pathologist. The average of images evaluation time required for evaluating the Purkinje cell layer is 1.9 sec with each image (Figure 4C).
3.4 Rapid identification of cerebellar tumors
Visualizing the normal cerebellar structures, including the gray matter, white matter, and Purkinje cell layer, is of utmost importance as a reference to identify cerebellar tumors. Figure 5 A shows human cerebellar hemangioblastomas, which focus on the tumor core and peritumor regions, revealing the extent of the tumor and secondary effects of the surrounding tissue. Tumor-induced ischemia and hypoxia of peritumoral tissue lead to cytoplasmic rarefaction of the granule cell layer, as well as Purkinje cell loss and vacuoles of the Purkinje cell layer. Figure 5B and C clearly depict an abnormal granule cell layer and vacuolated cells of the Purkinje cell layer by combining the image analysis methods, which are used for discriminating normal tissue from peritumor regions. In the tumor core, a high concentration of tumor cells and increased cell densities are readily detected in MPM images, showing densely packed tumor cells and large irregular shape of tumor cell nuclei compare to peritumoral cells, which can be efficiently differentiated tumor core from peritumor regions based on striking nuclear atypia.
Again, we delineated the boundary between the tumor core and peritumor regions in white lines through the image analysis method (See Materials and Methods 2.4.3), and a precision boundary could greatly aid in tumor resection decision making. The average of images evaluation time required 21.6 sec with Figure 5C and D. In future work, we will also use this edge as a mask to label the tumor cells in both the tumor and normal regions. Comparison of the corresponding H&E-stained images (Figure 5E) revealed that MPM images could rapidly discriminate cerebellar tumors from peritumor and normal tissue. In particular, the secondary effects in the peritumor regions are hallmark features of cerebellar hemangioblastomas, a finding that could be of tremendous help for predicting prognosis.
4 Discussion
Rapid assessment of Purkinje cell layer and tumor boundary remain a significant challenge for pathologist and neurosurgeon. MPM based on endogenous contrast mechanisms has become a valuable tool to permit the exploration of Purkinje cell layer and tumor boundary without fluorescent labeling and special staining. However, these MPM images are not intuitive enough for clinical diagnosis because they only emit comparable TPEF signals, relatively lack of the SHG signals by contrast. Furthermore, the frame of MPM image is brighter in the center than the periphery region owing to limited chromatic aberration correction of the objective. For these reasons, image analysis and processing, as a useful complementary tool, can reduce uncertainty results, enhance the image contrast, and automatically analyze images in seconds. Thus, the combination of label-free multiphoton imaging and image analysis is necessary to provide more adequate interpretation to augment the diagnostic accuracy of neuropathology with high efficiency.
Here, we demonstrate that MPM could be used to acquire large-scale images of the cerebellar structures and pathology. Together with custom-developed image processing algorithms, MPM performs well to reveal the histoarchitectural structures of the cerebellum in both coronal and sagittal views, as well as to automatically detect the gray matter, white matter, and three-layered cerebellar cortex, especially the Purkinje cell layer. Additionally, MPM creates the possibility of the rapid identification of cerebellar tumors. By comparison, the normal region, peritumor regions, and tumor core can be readily discriminated by the secondary effects of peritumor regions and the boundary between the tumor core and peritumor regions. The overall results that we obtained are promising and depict the combined MPM and image analysis method for cerebellar structures as a rapid, label-free diagnostic method, which holds great potential in evaluating the effectiveness of diagnosis.
Presently, there are many previous studies that have been applied MPM for imaging various brain regions. Alex et al. have observed autofluorescence and SHG at senile plaques of hippocampus in brain slices from transgenic Alzheimer's disease mouse models 28. Jan et al. and Sven et al. have demonstrated MPM can visualize normal brain such as cortex, white matter, and basal ganglia. Moreover, solid tumor and single invasive tumor cells also could be distinguished from normal brain in an experimental mouse and human biopsy specimens 29, 30. MPM focused on ex vivo evaluation of cerebellum and other brain regions for subcellular resolution imaging from unprocessed sections, which may provide means for supplementary metrics to pathologists and surgeons in combination with image analysis. Although this method based on imaging of thin sections for in vivo imaging may still face major hurdles such as respiratory and pulse induced movement artifact, laser penetration depth, or large footprint imaging instrumentation, our study also opens the door of new approaches for in situ tissue analysis, for example, to detect residual tumor at the resection edge. Furthermore, these hurdles may soon be overcome for the development of miniaturized MPM in clinical implementation.
During neurosurgical operation, the ultimate value of MPM would be integrated this technique into neurosurgical workflow for in vivo, non-destructive optical diagnosis of tissue. Recent advances of two-photon microendoscopes and fiberscopes have provided gradient index lens 31 or optical fiber bundles 32 that well connect to the multiphoton microscope system, which is a flexible tool for in vivo imaging of neurons down to at least 250 μm below the brain surface in freely moving animals 33. Many groups have used microprism technique that provides large field-of-view of vertical network of neurons 34 and functional imaging of individual neurons across all cortical layers 35. Additionally, clinical multiphoton tomography has successfully provided optical biopsies for in vivo imaging on humans during a neurosurgical procedure 36. These advances would be an important step for the translation of MPM into the clinic. Future studies will combine the groundwork for clinical in vivo multiphoton microendoscopes and fiberscopes to perform intraoperative imaging, and further optimizing the algorithm to quantify diagnostic criteria. The next step requires demonstrating the likelihood that the needle-like objective (GRIN) will be safe for use in the human cerebellum because this may associate with the stability and accuracy of intraoperative diagnosis. With miniaturization and optimization of probes and optical fiber, we anticipate that MPM would be used in an operating room for pathological analysis and neuronavigation, which can rapidly provide histology-based images and automated image analysis that decreases the rate of intraoperative assessment.
5 Conclusion
In summary, we demonstrate that MPM associated with image analysis methods can be used to rapidly identify cerebellar structures and pathology on several scales. This approach has not only visualized normal rat cerebellum, differentiated between the gray and white matter, and evaluated the Purkinje cell layer but also identified the cerebellar tumor boundary, as well as distinguished between the tumor core and peritumor regions. Our work establishes the feasibility of MPM for the rapid pathological diagnosis of unstained cerebellar tissue and provides preliminary proof of principle needed to translate in vivo multiphoton microendoscopes and fiberscopes into clinical use.
Acknowledgements
The project was supported by the National High Technology Research and Development Program of China (2015AA020508), the National Natural Science Foundation of China (Grant No. 81671730), the National Key Basic Research Program of China (2015CB352006), the Joint Funds of Fujian Provincial Health and Education Research (WKJ2016-2-28), and the Program for Changjiang Scholars and Innovative Research Team in University (Grant No. IRT_15R10).
Conflict of Interest
The authors declare that they have no conflict of interest.
Author biographies
Please see Supporting Information online.


