Deep learning-based reconstruction on intensity-inhomogeneous diffusion magnetic resonance imaging
Abstract
Background
Ultra high field diffusion magnetic resonance imaging (dMRI) provides diffusion-weighted (DW) images with a high signal-to-noise ratio, but increases inhomogeneity, which affects the accuracy of dMRI metric reconstruction. Current methods for correcting inhomogeneity rarely consider the accuracy of the reconstructed dMRI metrics. Deep learning models for reconstructing metrics from dMRI signals typically assume that DW images have a homogeneous intensity. To address these challenges, we propose a deep learning model capable of directly reconstructing high-accuracy dMRI metric maps from inhomogeneous DW images.
Methods
An attention-based q-space inhomogeneity-resistant reconstruction network (qIRR-Net) is proposed for the voxel-wise reconstruction of diffusion tensor imaging and diffusion kurtosis imaging metrics. A training procedure based on data augmentation and consistency loss is introduced to ensure that the reconstruction results of qIRR-Net are not affected by signal inhomogeneity. The 3T and 7T dMRI data from the Human Connectome Project are used for model training, testing, and evaluation.
Results
On the 3T dMRI data with simulated inhomogeneity, qIRR-Net improves the peak signal-to-noise ratio by 5.39 and the structural similarity index measure by 0.18 compared with weighted linear least-squares fitting. On the 7T dMRI data, the metric maps reconstructed by qIRR-Net not only exhibit clearer tissue structures but also demonstrate greater stability compared with the weighted linear least-squares results.
Conclusions
The proposed qIRR-Net enables the accurate reconstruction of dMRI metrics from inhomogeneous DW images. This approach could potentially be expanded to obtain multiple artifact-free metric maps from ultrahigh field dMRI for neuroscience research and neurology applications.
Abbreviations
-
- AD
-
- axial diffusivity
-
- AK
-
- axial kurtosis
-
- CAB
-
- cross-attention block
-
- DKI
-
- diffusion kurtosis imaging
-
- dMRI
-
- diffusion magnetic resonance imaging
-
- DTI
-
- diffusion tensor imaging
-
- DW
-
- diffusion-weighted
-
- FA
-
- fractional anisotropy
-
- HCP
-
- Human Connectome Project
-
- KFA
-
- kurtosis fractional anisotropy
-
- MD
-
- mean diffusivity
-
- MK
-
- mean kurtosis
-
- MSE
-
- mean squared error
-
- PSNR
-
- peak signal-to-noise ratio
-
- RD
-
- radial diffusivity
-
- RK
-
- radial kurtosis
-
- SAB
-
- self-attention block
-
- SSIM
-
- structural similarity index measure
-
- UHF
-
- ultrahigh field
-
- WLS
-
- weighted linear least-squares
1 INTRODUCTION
Diffusion magnetic resonance imaging (dMRI) is a medical imaging technique used to investigate detailed structural information at a sub-voxel level [1, 2]. In recent decades, dMRI has been extensively used for the detection of central nervous system diseases and brain science research [3-7]. One important application of dMRI involves fitting the dMRI signals based on biophysical models to obtain metrics related to microstructural properties. Among them, diffusion tensor imaging (DTI) [8] and diffusion kurtosis imaging (DKI) [9] have gained widespread clinical acceptance because of the simplicity of their fitting procedures. Nevertheless, the reconstruction of diffusion metrics is constrained by the inherent magnetization of tissue, which is generated by the magnetic field of the scanner. As a result, conventional 3T dMRI acquisition leads to low-resolution maps of diffusion metrics.
The emergence of ultrahigh field (UHF, ≥7T) MRI, which has a very high signal-to-noise ratio, has facilitated progress in dMRI; however, there are several challenges when implementing UHF dMRI [10-12]. In UHF dMRI, inhomogeneity is more likely to occur in the B0 field, which causes cumulative phase desynchronization during scanning, leading to signal distortion and blurring [13]. Additionally, UHF dMRI requires short-radiofrequency pulses, which may form standing waves within tissues, further contributing to inhomogeneity in diffusion-weighted (DW) images [14]. The presence of inhomogeneity may affect the accuracy of the reconstructed dMRI metrics.
Currently, there are various approaches for correcting inhomogeneity in MR images. Methods such as N3 [15], N4 [16], and BiCal [17] assume that the spatial distribution of the inhomogeneous bias field has certain properties, such as low frequency or adherence to a specific functional form. Based on these assumptions, polynomial or B-spline bias fields are estimated and then removed from the image. In recent years, with the development of deep learning technology, various deep learning-based methods for inhomogeneity correction have been proposed [18-24]. These models do not require prior assumptions; instead, they are trained on large paired datasets of homogeneous and inhomogeneous data. For instance, Harrevelt et al. introduced a ResNet-18-based model to correct inhomogeneities induced by the radiofrequency field for prostate T2 weighted imaging at 7T [25], while Venkatesh et al. proposed InhomoNet for the intensity inhomogeneity correction of brain and abdomen T1 weighted MRI [21]. These models typically use homogeneous images and simulated inhomogeneous bias fields for supervised learning. However, most models concentrate on assessing the similarity between the inhomogeneity-removed images and the ground truth, with little consideration given to the accuracy of the dMRI metrics derived from the model output.
Deep learning methods have also been applied to the reconstruction of dMRI metrics. Numerous end-to-end reconstruction models have been suggested as alternatives to the fitting process of biophysical models [26-34]. However, current deep learning algorithms for reconstructing dMRI parameters typically presume that the DW images are homogeneous, neglecting the inhomogeneity issue. As a result, additional preprocessing is often required to reduce inhomogeneity effects before using these deep learning models.
The purpose of this study is to design an end-to-end deep learning model to reconstruct high-precision dMRI metric maps from inhomogeneous DW images. A training framework and loss functions are designed to ensure that the reconstruction results of the proposed q-space inhomogeneity-resistant reconstruction network (qIRR-Net) are unaffected by the inhomogeneous intensity of the images. To overcome the challenge of obtaining homogeneous 7T data, the model is trained and tested using 3T dMRI data from the Human Connectome Project (HCP) and further evaluated on a 7T dMRI dataset to assess its performance on UHF images.
2 METHODS
2.1 Dataset
The data used in this study were sourced from the HCP dataset [35]. A total of 142 subjects with both 3T and 7T dMRI data available were selected. Among them, data from 113 subjects were used to form the training set, while the data from the remaining 29 subjects were used to construct the test set. The 3T dMRI data for each subject consisted of 18 images with a b-value of 0 s/mm2, 90 images with a b-value of 1000 s/mm2, and 90 images with a b-value of 2000 s/mm2. The 7T dMRI data for each participant included 16 images with a b-value of 0 s/mm2, 64 images with a b-value of 1000 s/mm2, and 64 images with a b-value of 2000 s/mm2. During both training and testing, the mask provided by the HCP dataset was employed to discard background voxels.
The method proposed in this paper was validated by reconstructing eight indices derived from DTI and DKI: mean diffusivity (MD) and mean kurtosis (MK), which measure the average diffusion intensity and kurtosis over the entire spherical space; axial diffusivity (AD) and axial kurtosis (AK), which measure the diffusion intensity and kurtosis parallel to the principal diffusion direction; radial diffusivity (RD) and radial kurtosis (RK), which measure the diffusion intensity and kurtosis perpendicular to the principal diffusion direction; and fractional anisotropy (FA) and kurtosis fractional anisotropy (KFA), which represent the anisotropy of diffusion intensity and kurtosis in spherical space. These metrics were estimated using weighted linear least squares (WLS) [36, 37], as implemented with the Dipy Python package [38].
In the HCP preprocessing pipelines for the 3T dMRI data, the b0 image intensity across runs was normalized, EPI distortions, eddy-current-induced distortions, and subject motion were removed, and gradient-nonlinearities were corrected [39]. Thus, the metric maps fitted from the HCP 3T dMRI data were regarded as the inhomogeneity-free ground truth for model training. The effectiveness of the model was validated using 3T dMRI data with simulated inhomogeneity and 7T dMRI data.
2.2 Data augmentation
To enhance the inhomogeneity resistance and cross-dataset generalization of qIRR-Net, three augmentation techniques were employed: simulated inhomogeneity, random q-space undersampling, and q-space rotation.
There are differences in magnitude between different dMRI metrics. For ease of model training, the values of MD, AD, and RD were initially constrained within the range of 0–0.004, and the values of MK, AK, and RK were initially constrained within the range of 0–4. All metrics were then scaled to the range of 0–1. FA and KFA naturally vary within the range of 0–1, so they did not require any adjustments.
2.3 Details of qIRR-Net
The qIRR-Net is a deep learning model designed for voxel-wise reconstruction of homogenous dMRI metrics. This model employs self-attention and cross-attention [40] to integrate signals from different q-space sampling points. Self-attention allows feature vectors from different sampling points to interact and compensate for information loss caused by inhomogeneity. The cross-attention mechanism enables the model to capture the most valuable information for reconstructing dMRI metrics from across all feature vectors. Consistency loss and reconstruction loss were applied during training to constrain the weight updates of the model. In the following sections, we will detail the data augmentation techniques and loss functions used during training, as well as the specifics of the model.
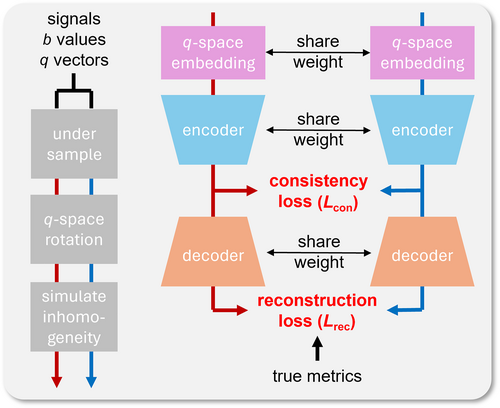
Training framework of qIRR-Net. After undergoing three data augmentation operations, a single original input yields two paired inputs (blue and red streamlines). Consistency loss is imposed on the latent features extracted by the encoder from the paired inputs, whereas reconstruction loss is imposed on the decoder output.
The structure of the q-space embedding block is illustrated in Figure 2a. The signal, b-value, and q-vector are included as inputs to this block, and the output is a feature vector. Because the dMRI signals exhibit exponential decay, they are transformed into logarithmic space. The b-value, which is related to the size of the q-space shell to which the sampling point belongs, is replaced by a set of one-hot encodings that identify different shells. The q-vector can be represented as a unit vector in Cartesian coordinates. After transforming each element of the inputs as described above and concatenating them, a linear transformation is applied to increase the dimensionality, resulting in the final feature vector. In the entire q-space embedding block, only the linear transformation matrix contains trainable weights, resulting in little computational burden during the training process.
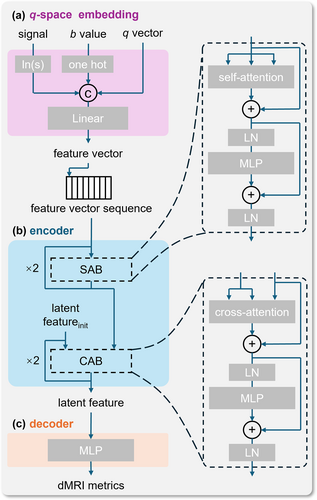
Architecture of qIRR-Net. (a) q-space embedding block; (b) encoder block of qIRR-Net; and (c) decoder of qIRR-Net. CAB, cross-attention block; LN, layer normalization; SAB, self-attention block.
Figure 2b shows the encoder structure of qIRR-Net. The encoder receives the sequence of embedded feature vectors and fuses them into a latent space comprising two self-attention blocks (SABs) and two cross-attention blocks (CABs). In the SABs, the Key, Value, and Query matrices all come from the feature vector sequence. These blocks calculate attention scores between the feature vectors, facilitating information exchange based on these scores. In the CABs, the Key and Value matrices come from the feature vector sequence processed by the SABs, while the Query comes from a learnable initial latent space feature. The CABs use a multi-head attention mechanism to compute the attention scores of the latent space feature for each feature vector, and update the latent space feature based on these scores. During training, the SABs learn the relationships between different feature sequences, whereas the CABs learn which information is crucial for reconstructing the dMRI metrics.
The decoder of qIRR-Net is lightweight, consisting of only a two-layer multilayer perceptron. Once the encoder has successfully extracted the features, a basic network is sufficient to accurately reconstruct the dMRI metrics. A lightweight decoder also helps avoid unnecessary consumption of computational resources (The code and the trained model are available at https://github.com/AI4DMR/qIRR-Net).
2.4 Evaluation
To quantify the reconstruction accuracy of qIRR-Net, the structural similarity index measure (SSIM) and peak signal-to-noise ratio (PSNR) of the dMRI metric maps were calculated.
2.5 Statistical analysis
Statistical analysis was performed to evaluate the reconstruction results of the comparison experiment between qIRR-Net and WLS fitting on synthetic inhomogeneous 3T dMRI datasets. The normality of the data was assessed using the Kolmogorov–Smirnov test. The one-tailed paired t-test was used to validate the significance of the improvements from qIRR-Net (p < 0.001 was considered significant).
3 RESULTS
3.1 Ablation experiments
To explore the impact of specific components of the method on the accuracy of the reconstruction results, we conducted ablation experiments by modifying individual components of interest while keeping all other components constant. Four ablation experiments were performed: removing the consistency loss function, removing undersampling augmentation, removing q-space rotation augmentation, and removing simulated inhomogeneity augmentation. During the test stage, models with different ablations were applied to the same dataset that includes all types of data augmentations.
Table 1 presents the accuracy with which each metric was reconstructed on the test set. The model trained without the consistency loss function achieved the highest PSNR in reconstructing KFA. Additionally, the model trained without undersampling augmentation demonstrated the optimal performance in reconstructing FA. It is worth noting that the model trained without simulated inhomogeneity achieves the highest SSIM for MD, AD, and RD, as well as the highest PSNR for MD and RD. In the remaining cases, the complete qIRR-Net model demonstrated the optimal performance.
| Ablation methods | Evaluation metrics | MD | AD | RD | FA | MK | AK | RK | KFA |
|---|---|---|---|---|---|---|---|---|---|
| qIRR-Net | SSIM | 0.88 | 0.90 | 0.85 | 0.75 | 0.65 | 0.68 | 0.67 | 0.68 |
| ±0.02 | ±0.01 | ±0.03 | ±0.03 | ±0.03 | ±0.03 | ±0.03 | ±0.03 | ||
| PSNR | 24.50 | 25.14 | 23.01 | 17.97 | 19.78 | 20.98 | 18.66 | 17.14 | |
| ±1.64 | ±1.10 | ±1.67 | ±0.61 | ±1.02 | ±1.07 | ±0.91 | ±0.70 | ||
| w/o Lcon | SSIM | 0.81 | 0.79 | 0.84 | 0.74 | 0.57 | 0.60 | 0.59 | 0.73 |
| ±0.03 | ±0.02 | ±0.02 | ±0.03 | ±0.03 | ±0.03 | ±0.03 | ±0.03 | ||
| PSNR | 22.04 | 20.17 | 22.37 | 16.63 | 18.93 | 20.28 | 17.38 | 17.53 | |
| ±1.26 | ±0.79 | ±1.27 | ±0.67 | ±0.73 | ±0.81 | ±0.63 | ±0.95 | ||
| w/o under sample | SSIM | 0.83 | 0.78 | 0.82 | 0.73 | 0.61 | 0.63 | 0.61 | 0.63 |
| ±0.01 | ±0.01 | ±0.01 | ±0.02 | ±0.03 | ±0.03 | ±0.03 | ±0.04 | ||
| PSNR | 22.31 | 20.66 | 22.25 | 18.05 | 19.48 | 20.57 | 18.38 | 15.58 | |
| ±0.91 | ±0.65 | ±1.01 | ±0.43 | ±0.94 | ±1.07 | ±0.78 | ±0.69 | ||
| w/o q-space rotation | SSIM | 0.95 | 0.87 | 0.95 | 0.63 | 0.53 | 0.58 | 0.57 | 0.64 |
| ±0.00 | ±0.01 | ±0.00 | ±0.03 | ±0.03 | ±0.03 | ±0.03 | ±0.03 | ||
| PSNR | 27.17 | 19.47 | 26.47 | 13.21 | 19.08 | 20.67 | 16.45 | 13.88 | |
| ±0.81 | ±0.44 | ±0.65 | ±0.40 | ±0.96 | ±1.15 | ±0.66 | ±0.35 | ||
| w/o simulate inhomogeneity | SSIM | 0.96 | 0.91 | 0.95 | 0.64 | 0.54 | 0.56 | 0.56 | 0.59 |
| ±0.00 | ±0.01 | ±0.01 | ±0.03 | ±0.03 | ±0.03 | ±0.04 | ±0.04 | ||
| PSNR | 28.05 | 24.77 | 27.37 | 17.65 | 17.85 | 19.05 | 17.63 | 16.77 | |
| ±0.73 | ±0.32 | ±0.70 | ±0.40 | ±0.72 | ±0.77 | ±0.81 | ±0.72 |
- Note: The best reconstruction results of each dMRI metric are highlighted in bold.
- Abbreviations: AD, axial diffusivity; AK, axial kurtosis; FA, fractional anisotropy; KFA, kurtosis fractional anisotropy; MD, mean diffusivity; MK, mean kurtosis; RD, radial diffusivity; RK, radial kurtosis.
The results of the ablation study demonstrate that the consistency loss function, undersampling augmentation, and q-space rotation augmentation make positive contributions to the reconstruction performance across all metrics. Furthermore, the simulated inhomogeneity augmentation specifically improves the accuracy of metrics related to kurtosis. Therefore, all components are essential for the performance of the qIRR-Net model.
3.2 Reconstruction of dMRI metric map at 3T
Next, we applied qIRR-Net to a synthetic inhomogeneous 3T dMRI dataset and compared the dMRI metric maps reconstructed by the model with those obtained by directly fitting the inhomogeneous data. The homogeneous data used to synthesize the inhomogeneous dataset were taken from test set samples, and the bias field was randomly generated using a third-order polynomial with an intensity range of ±10%. A different bias field was applied to each image in the dMRI data.
Figures 3 and 4 show the ground truth, qIRR-Net reconstruction results, and fitting method reconstruction results for the DTI and DKI metrics. The metric maps reconstructed by qIRR-Net are in good agreement with the ground truth, whereas the maps obtained by the fitting method exhibit significant errors, especially in the MK and KFA metrics.
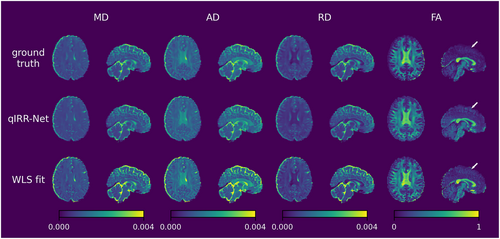
DTI metric maps reconstructed by qIRR-Net and WLS fitting on the synthetic inhomogeneous 3T dMRI dataset. The first row shows the DTI metric maps fitted by WLS with inhomogeneity-free DW images (ground truth). The second row shows the DTI metric maps reconstructed by qIRR-Net with synthetic inhomogeneous DW images. The third row shows DTI metric maps fitted by WLS with synthetic inhomogeneous DW images. AD, axial diffusivity; FA, fractional anisotropy; MD, mean diffusivity; RD, radial diffusivity; WLS, weighted linear least squares.
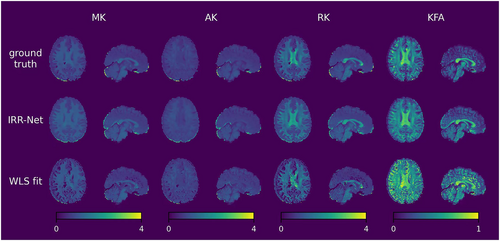
DKI metric maps reconstructed by qIRR-Net and WLS fitting on the synthetic inhomogeneous 3T dMRI dataset. The first row shows the DKI metric maps fitted by WLS with inhomogeneity-free DW images (ground truth). The second row shows the DKI metric maps reconstructed by qIRR-Net with synthetic inhomogeneous DW images. The third row shows DKI metric maps fitted by WLS with synthetic inhomogeneous DW images. AK, axial kurtosis; KFA, kurtosis fractional anisotropy; MK, mean kurtosis; RK, radial kurtosis; WLS, weighted linear least squares.
Table 2 compares the reconstruction results of qIRR-Net and WLS fitting. Across all metrics, qIRR-Net achieved higher reconstruction accuracy, and this improvement was confirmed to be significant by a one-tailed paired t-test (p < 0.001). On average, qIRR-Net improved the PSNR by 5.39 and the SSIM by 0.18.
| Method | Evaluation metrics | MD | AD | RD | FA | MK | AK | RK | KFA |
|---|---|---|---|---|---|---|---|---|---|
| qIRR-Net | PSNR | 30.26 | 29.23 | 29.68 | 23.45 | 23.96 | 24.91 | 22.81 | 21.24 |
| ±0.82 | ±0.60 | ±0.74 | ±0.95 | ±0.87 | ±0.80 | ±0.93 | ±1.02 | ||
| SSIM | 0.98 | 0.97 | 0.98 | 0.93 | 0.86 | 0.86 | 0.86 | 0.88 | |
| ±0.00 | ±0.00 | ±0.00 | ±0.02 | ±0.03 | ±0.03 | ±0.03 | ±0.03 | ||
| WLS fit | PSNR | 25.01 | 23.21 | 25.69 | 19.39 | 19.33 | 20.10 | 17.80 | 11.93 |
| ±0.62 | ±0.48 | ±0.64 | ±0.73 | ±0.84 | ±0.88 | ±0.75 | ±0.45 | ||
| SSIM | 0.94 | 0.93 | 0.95 | 0.86 | 0.54 | 0.52 | 0.59 | 0.52 | |
| ±0.01 | ±0.01 | ±0.00 | ±0.02 | ±0.04 | ±0.04 | ±0.05 | ±0.04 |
- Abbreviations: AD, axial diffusivity; AK, axial kurtosis; FA, fractional anisotropy; KFA, kurtosis fractional anisotropy; MD, mean diffusivity; MK, mean kurtosis; RD, radial diffusivity; RK, radial kurtosis.
The reconstruction experiments conducted on the synthetic dataset demonstrate that the results produced by qIRR-Net from inhomogeneous datasets are similar to those generated by WLS on homogeneous datasets, both in terms of quantitative evaluation metrics and visual assessment. This illustrates the effectiveness of qIRR-Net in reconstructions that are not affected by inhomogeneities.
3.3 Reconstruction on 7T dataset
UHF dMRI images not only contain stronger inhomogeneity but also have a higher signal-to-noise ratio. Thus, it is more valuable to reconstruct accurate dMRI metric maps from inhomogeneous 7T dMRI data. However, the lack of effective algorithms for correcting inhomogeneity in UHF dMRI makes it challenging to obtain homogeneous 7T dMRI data. Therefore, it is difficult to supervise the training process on 7T data. The qIRR-Net model trained on the 3T dMRI data was directly applied to the 7T data without fine-tuning, thereby eliminating the need for homogeneous 7T dMRI data. This subsection compares the reconstruction results with those obtained using WLS fitting on both 3T and 7T dMRI data.
Figures 5 and 6 show the DTI and DKI metric maps obtained by the different methods. Compared with the WLS fitting results on 3T data, the qIRR-Net and WLS fitting results on 7T data exhibit clearer tissue structures, such as the boundary between gray matter and white matter. Comparing the metric maps reconstructed with the same 7T DW images, the results from qIRR-Net are more uniform, whereas the metric maps from WLS fitting contain many regions with reconstruction anomalies, especially for the DKI metric.
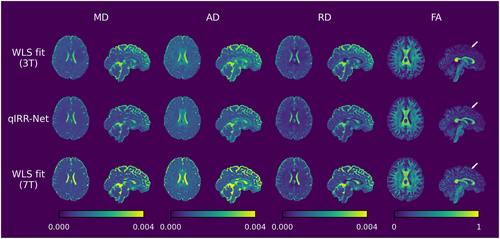
DTI metric maps reconstructed by qIRR-Net and WLS fitting on the 7T dMRI dataset. The first row shows the DTI metric maps fitted by WLS with 3T DW images. The second row shows the DTI metric maps reconstructed by qIRR-Net with 7T DW images. The third row shows DTI metric maps fitted by WLS with 7T DW images. AD, axial diffusivity; FA, fractional anisotropy; MD, mean diffusivity; RD, radial diffusivity; WLS, weighted linear least-squares.
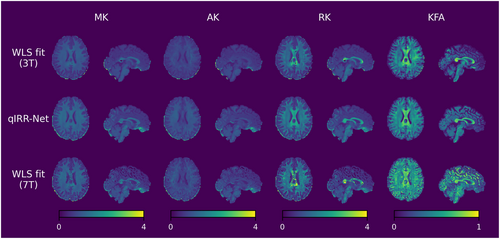
DKI metric maps reconstructed by qIRR-Net and WLS fitting on the 7T dMRI dataset. The first row shows the DKI metric maps fitted by WLS with 3T DW images. The second row shows the DKI metric maps reconstructed by qIRR-Net with 7T DW images. The third row shows DKI metric maps fitted by WLS with 7T DW images. AK, axial kurtosis; KFA, kurtosis fractional anisotropy; MK, mean kurtosis; RK, radial kurtosis; WLS, weighted linear least squares.
The experimental results presented in this subsection demonstrate that the qIRR-Net model is capable of reconstructing metric maps with high visual quality when applied to real UHF dMRI datasets. Furthermore, the results confirm the robustness of the model across datasets acquired at different field strengths.
4 DISCUSSION
Inhomogeneity correction and metric reconstruction are two pivotal processes in dMRI. A multitude of studies have attempted to incorporate deep learning methodologies in each of these two domains. A ResNet-18-based model was introduced to correct inhomogeneities induced by the radiofrequency field [25], and InhomoNet was introduced for inhomogeneity correction of brain and abdomen MRI [21]. To reconstruct dMRI metrics, a variety of models based on disparate constructs, for example, METSC [26], diffNet [31], and GCNN [28], have been proposed. However, no study has yet attempted the combined optimization of inhomogeneity correction and dMRI metric reconstruction. Given that the results of inhomogeneity correction impact the reconstruction of metrics, a single model that completes both processes simultaneously would offer increased processing efficiency and improved accuracy. In this study, we developed an original deep learning model, qIRR-Net, along with a training process based on data augmentation and consistency loss, to achieve accurate reconstruction of DTI and DKI metrics from inhomogeneous DW images. A series of ablation experiments demonstrated the effectiveness of each component in qIRR-Net. The performance of qIRR-Net on the 3T data with simulated inhomogeneity and on the realistic 7T data demonstrates its ability to mitigate the effects of inhomogeneity in DW images.
The results of the ablation experiments indicate that the reconstruction accuracy of the complete qIRR-Net model is optimal in the majority of cases. Thus, all individual components are essential for achieving the best performance. A notable result is that, for low-order dMRI metrics, particularly MD and RD, the qIRR-Net model trained with simulated inhomogeneity did not demonstrate superior performance over the model trained without simulated inhomogeneity. This is probably because inhomogeneity has little impact on the reconstruction accuracy of low-order dMRI metrics and the introduction of simulated inhomogeneity makes it difficult for the model to learn the relationship between the metrics and the signal. In contrast, the reconstruction of high-order dMRI metrics demonstrated that models trained with simulated inhomogeneity exhibit a notable enhancement in accuracy over those without simulated inhomogeneity, indicating that the introduction of simulated inhomogeneity is essential in reconstructing high-order dMRI metrics.
In the dataset with simulated inhomogeneity, the WLS fitting demonstrated a significantly higher accuracy on the DTI metrics than on the DKI metrics. This further indicates that inhomogeneity has a lesser effect on the reconstruction of low-order dMRI metrics compared with its effect on that of high-order metrics. Nevertheless, the influence of inhomogeneity on the results of the WLS is still discernible in Figures 3 and 6. In the presence of inhomogeneity, WLS is biased toward overestimating the AD and FA values, which is consistent with previous findings [41]. Additionally, the FA map reconstructed by WLS displays indistinct boundaries between white and gray matter (indicated by a white arrow), which may impact DTI-based fiber tracking and potentially result in the early termination of the tracking process [42]. In metric maps reconstructed by qIRR-Net, the effects caused by inhomogeneity are partially corrected.
As higher-order features of diffusion intensity, kurtosis-related metrics are very sensitive to measurement errors in diffusion intensity. As illustrated in Figures 4 and 6, the presence of synthetic inhomogeneity results in the emergence of numerous anomalous voxels (depicted as dark patches in the metric maps) during the process of fitting the DKI metric maps. The robustness of the deep learning model enables qIRR-Net to produce reasonable results for voxels in which the WLS fitting reconstruction fails.
In this study, the model trained on the 3T HCP dataset was directly applied to the 7T dataset without any fine-tuning, thus obviating the need for training models on homogeneous DW images from UHF scanners. The excellent cross-dataset generalization ability of qIRR-Net is attributable to two main factors. First, it benefits from the nature of dMRI data—the diffusion coefficients are independent of the field strength. This is not feasible for T1 weighted and T2 weighted images, in which the values of T1 and T2 vary with the field strength [43, 44]. Second, the data augmentation techniques employed during training, such as random undersampling and q-space rotation, enable the model to adapt to various q-space sampling strategies.
Only imaging results obtained at 3T and 7T were compared in this work. Intensity inhomogeneity is a common issue for any UHF. Although 5T MRI technology has recently undergone several noteworthy developments [45-48], it remains susceptible to inhomogeneities. It would thus be beneficial to correct such inhomogeneities using the proposed qIRR-Net model. Tissue diffusivity is independent of magnetic field strength and the variations in signal intensity are eliminated through S0 normalization, so qIRR-Net is not limited by the field strength of the datasets. Thus, it is possible to adapt the model to 5T brain data without fine-tuning. Furthermore, the 5T dMRI data exhibit less inhomogeneity than 7T data and offer a higher signal-to-noise ratio than 3T images [49]. Therefore, qIRR-Net may potentially perform better on datasets acquired at 5T. However, publicly available 5T datasets are rare, so this study did not attempt to validate qIRR-Net on 5T data.
Several limitations should be noted. The current q-space embedding block is only applicable to multi-shell q-space sampling schemes. Moreover, this study only validated the model's effectiveness on DTI and DKI metrics. Additionally, the performance of the model on brain imaging data with lesions remains to be verified. The proposed approach could be extended to a variety of q-space sampling strategies and incorporate more biophysical models.
5 CONCLUSION
The present study developed a novel deep learning model for the accurate reconstruction of dMRI metrics from inhomogeneous images. A training framework based on data augmentation and consistency loss was introduced to ensure that the model's reconstruction results were unaffected by signal inhomogeneity. The effectiveness of the proposed method was validated on both simulated inhomogeneous dMRI data and UHF dMRI data. The proposed method enhances the convenience and robustness of acquiring UHF dMRI metric images, thereby facilitating the application of UHF dMRI technology in medicine and clinics.
AUTHOR CONTRIBUTIONS
Zaimin Zhu: Conceptualization (lead); investigation (lead); methodology (lead); software (lead); validation (lead); visualization (lead); writing—original draft (lead). He Wang: Resources (supporting); supervision (supporting); writing—review and editing (supporting). Yong Liu: Funding acquisition (equal); project administration (equal); resources (lead); supervision (supporting). Fangrong Zong: Conceptualization (equal); funding acquisition (lead); project administration (lead); resources (equal); supervision (lead); writing—review and editing (lead).
ACKNOWLEDGMENTS
None.
CONFLICT OF INTEREST STATEMENT
The authors declare no conflicts of interest.
ETHICS STATEMENT
Not applicable.
INFORMED CONSENT
Not applicable.
Open Research
DATA AVAILABILITY STATEMENT
The data that support the findings of this study are available in WU-Minn HCP Data at https://db.humanconnectome.org. The code and the trained model are available at https://github.com/AI4DMR/qIRR-Net.


