Conserving urban tropical biodiversity by connecting networks of green patches
连通绿地斑块, 保护热带城市生物多样性
Memulihara biodiversiti tropika bandar dengan menghubungkan rangkaian tompok kawasan hijau
Abstract
enTropical Southeast Asia is a hotspot for global biodiversity, and also a hotspot for rapidly expanding urbanisation. There is a need to identify, protect, restore and connect remaining green spaces in the urban matrix before this opportunity is lost to urban development. The objective of this study is to characterise ecological connectivity for mammals and identify important patches and linkages for connecting urban green spaces for Greater Kuala Lumpur (KL), Malaysia. We first map land cover across the region using a linear mixture model with preprocessed multidate cloud-free mosaics derived from Sentinel 2 remote sensing data in Google Earth Engine. We then model connectivity using the land cover maps, expert-based parameterisation of Euclidian distance and graph-based connectivity models for a range of dispersal guilds representing small and medium terrestrial and arboreal mammals. Our analysis showed large differences in the effects of fragmentation within Greater KL on the different dispersal groups, with some groups perceiving the landscape as disconnected. However, our analysis identified a network of green patches and pathways which potentially could support connectivity in the urban landscape. Our results demonstrate the potential for Southeast Asian megacities to support biodiversity in the urban context, and the potential for a different kind of urban development, which supports biodiversity in its urban fabric.
Abstract
zh东南亚热带地区是全球生物多样性热点地区,也是城市快速扩张的热点地区。在城市发展到一定阶段之前,有必要识别、保护、恢复和连通城市中剩余的绿地。本文研究马来西亚大吉隆坡市哺乳动物的生态连通性,并识别连接城市绿地的重要斑块和通道。我们首先利用Google Earth Engine中的Sentinel 2遥感数据,生成预处理一段时间内的无云影像,并基于此建立线性混合模型,绘制该地区的土地覆盖图。然后,利用土地覆盖图,基于专家的欧几里得距离参数化,以及基于影像的中小型陆生与树栖哺乳动物连通性模型,对连通性进行建模。结果显示,大吉隆坡市的景观破碎化对不同动物的影响存在较大差异,对某些动物来说景观缺少连通性。然而,本研究也发现了一个由绿地斑块和廊道组成的网络,该网络有助于加强城市景观的连通性。研究结果表明,东南亚特大城市具有在城市环境中维持生物多样性的潜力,城市可以在发展的同时保有其生物多样性。
Abstract
msAsia Tenggara Tropika ialah kawasan titik panas untuk biodiversiti global, dan juga tempat titik panas untuk perbandaran yang berkembang pesat. Terdapat keperluan untuk mengenal pasti, melindungi, memulihkan dan menghubungkan baki ruang hijau dalam matriks bandar sebelum peluang ini hilang kepada pembangunan bandar. Objektif kajian ini adalah untuk mencirikan keterhubungan ekologi untuk mamalia dan mengenal pasti tompok dan perhubungan penting dalam menghubungkan ruang hijau bandar untuk Lembah Klang (KL), Malaysia. Kami mulakan dengan pemetaaan litupan tanah di seluruh kawasan kajian menggunakan linear mixture model dengan imej pra-proses yang telah dimozek dan bebas awan dari pelbagai tarikh yang berbeza yang diperoleh dari data penderiaan jauh Sentinel 2 dalam Enjin Google Earth. Kami kemudiannya memodelkan keterhubungan menggunakan peta litupan tanah, penentuan parameter jarak Euclidean berasaskan pakar dan model keterhubungan berasaskan graf untuk julat penyebaran cara pemakanan yang mewakili mamalia daratan dan arboreal kecil dan sederhana. Analisis kami menunjukkan perbezaan besar dalam kesan fragmentasi di sekitar KL pada kumpulan penyebaran yang berbeza, dengan sesetengah kumpulan menganggap landskap adalah terputus. Walau bagaimanapun, analisis kami dapat mengenal pasti rangkaian tompok dan laluan hijau yang berpotensi untuk menyokong keterhubungan dalam landskap bandar. Keputusan kajian kami menunjukkan potensi bandar mega Asia Tenggara untuk menyokong biodiversiti dalam konteks perbandaran, dan potensi untuk jenis pembangunan bandar yang berbeza, yang menyokong biodiversiti dalam fabrik bandar.
Plain language summary
enThis study focuses on Greater Kuala Lumpur (KL) in Southeast Asia, which is home to many different plants and animals. The region is also experiencing rapid urbanisation, which means that many green spaces are being lost due to development. The study aims to identify important patches of green spaces and create pathways that connect them in Greater KL, Malaysia. By using technologies such as remote sensing, maps were created that show how different groups of animals move through the urban environment. These maps show that some animals are more affected by urban development than others, but also identified some areas where green spaces could be connected to support wildlife. This study shows that it is possible for large cities in Southeast Asia to protect and promote biodiversity within their urban areas. In this way, it is possible to create urban development that is more considerate of biodiversity and thus protects it.
通俗语言摘要
zh本文的研究区域是东南亚大吉隆坡市,是许多动物和植物的家园。该区域正在经历快速的城市化,这意味着许多绿地正在因此而消失。本研究旨在识别大吉隆坡市的重要绿地,并创建连通这些绿地的廊道。利用遥感等技术绘制的地图显示,不同的动物在城市环境中的活动方式不同,某些动物受城市发展的影响更深。我们也确定了一些可以增加绿地连通性、支持野生动物活动的区域。本研究表明,东南亚大城市有潜力保护和促进其城市区域内的生物多样性,有可能开创支持生物多样性保护的城市发展道路。
Ringkasan Bahasa Biasa
msKajian ini memberi tumpuan kepada Lembah Klang (KL) di Asia Tenggara, yang merupakan rumah kepada pelbagai tumbuhan dan haiwan. Kawasan ini juga mengalami pembandaran yang pesat, yang menunjukkan bahawa banyak ruang hijau hilang akibat pembangunan. Kajian ini bertujuan untuk mengenal pasti tompok penting ruang hijau dan mewujudkan laluan yang menghubungkannya di KL, Malaysia. Dengan menggunakan teknologi seperti penderiaan jauh, peta yang menunjukkan cara kumpulan haiwan yang berbeza bergerak melalui persekitaran bandar telah dihasilkan. Peta ini menunjukkan bahawa sesetengah haiwan lebih terjejas oleh pembangunan bandar berbanding yang lain, malah ianya dapat mengenal pasti beberapa kawasan ruang hijau mana yang boleh dihubungkan untuk menyokong hidupan liar. Kajian ini menunjukkan bahawa bandar besar di Asia Tenggara boleh melindungi dan mempromosikan biodiversiti dalam kawasan bandar mereka. Dengan cara ini, adalah mungkin untuk mewujudkan pembangunan bandar yang lebih prihatin terhadap biodiversiti dan seterusnya dapat melindunginya.
Practitioner points
en
-
Protecting and connecting remaining green spaces in urban areas is crucial for preserving biodiversity in rapidly urbanising regions, such as Southeast Asia.
-
Mapping land cover and modelling connectivity using remote sensing data can help identify important green patches and linkages for connecting urban green spaces and supporting the movement of small and medium terrestrial and arboreal mammals.
-
The identification of a network of green patches and pathways provides a foundation for urban development that supports biodiversity in Southeast Asian megacities.
实践者要点
zh
-
保护和连通城市绿地,对于保护东南亚等快速城市化地区的生物多样性至关重要。
-
利用遥感数据绘制土地覆盖图、构建连通性模型,有助于识别重要的绿地斑块和廊道,以连通城市绿地,支持中小型陆生与树栖哺乳动物的活动。
-
绿地斑块和廊道网络的识别,为东南亚特大城市维持生物多样性的发展模式奠定了基础。
Titik Pengamal
ms
-
Melindungi dan menyambungkan tinggalan ruang hijau di kawasan bandar adalah penting untuk memelihara biodiversiti di kawasan yang pesat membangun seperti Asia Tenggara.
-
Pemetaan litupan muka tanah dan pemodelan keterhubungan menggunakan data penderiaan jauh boleh membantu mengenal pasti tompok hijau yang penting dan hubungan untuk menghubungkan ruang hijau bandar dan menyokong pergerakan mamalia darat dan arboreal kecil dan sederhana.
-
Pengenalpastian rangkaian tompok dan laluan hijau menyediakan asas bagi pembangunan bandar yang mengekalkan biodiversiti di bandar-bandar mega Asia Tenggara.
1 INTRODUCTION
The fragmentation and loss of habitat reduce wildlife connectivity, leading to a constriction of species movement and an increase in the risk of extinction (Richards et al., 2017; Scolozzi & Geneletti, 2012; Syphard et al., 2011; Vergnes et al., 2012). In urban environments, green spaces are isolated by a matrix of buildings and roads, which restricts the movement of animals between green spaces, such as urban forests and parklands (Goddard et al., 2010; Nor, Corstanje, Harris, & Brewer, 2017). Urbanisation is a significant cause of habitat fragmentation, particularly in low- and middle-income countries, where cities are rapidly urbanising due to high rates of population growth, rural–urban migration and economic modernisation (Lechner et al., 2020; Richards & Belcher, 2019; Richards et al., 2017; Shathy & Reza, 2016).
Southeast Asia is one of the most rapidly urbanising regions in the world, with poorly planned cities resulting in habitat degradation, loss and fragmentation, negatively impacting on biodiversity and urban ecosystem services (Lourdes et al., 2021; Richards et al., 2017; Seto et al., 2012). Urbanisation in Southeast Asia is of particular concern for conservation globally, as the region is home to four out of 34 of the planet's biodiversity hotspots (Myers et al., 2000). Furthermore, many of the countries in the region still have some relatively intact locations with high forest cover, such as Indonesia and Malaysia (Hughes, 2017; Lechner et al., 2021; Wilcove et al., 2013). The region is also undergoing rapid social and environmental changes, due in part, to infrastructure development spurned on by increasing investment, such as in transport networks (Ng et al., 2020; Teo et al., 2019) and massive urban development schemes such as Indonesia's new planned capital in Borneo (Teo et al., 2020). However, unlike many cities in the highly urbanised Global North, urban green spaces such as in Greater Kuala Lumpur (KL), an urban conurbation with a population of around 7.5 million people, have the capacity to support biodiversity, even though they are found with a high-density urban matrix (Samantha et al., 2020; Tee et al., 2018; Teo et al., 2021). Within Southeast Asia, Greater KL is remarkable for its rich wildlife, including threatened mammals, like, tapirs (Tapirus indicus), serows (Capricornis sumatrensis), gibbons (Hylobates bar), pig-tailed macaques (Macaca nemestrina) and pangolins (Manis javanica).
The continuing loss of biodiversity due to anthropogenic land use changes from urbanisation is a special concern in countries like Malaysia, which is one of the most urbanised countries in Southeast Asia (United Nations, 2019). Malaysia's urbanisation percentage was 42% in 1980 and 76% in 2018 (United Nations, 2019). Urbanisation in Greater KL has led to the loss of green space, including primary and secondary forests and former plantations (Mc Donald et al., 2008; Ramakreshnan et al., 2018; Seto et al., 2012), resulting in a decline of the total green space per capita from 13 m2 in 2010 to 8.5 m2 in 2014 (Kanniah & Siong, 2017). Clearly, given the rapid pace and scale of infrastructure development in Malaysia and other cities in the region, there is a need to protect and conserve existing green space before it is lost to development (Lechner et al., 2021). Conservation of green spaces for biodiversity and ecosystem services need to be embedded into planning, in particular ensuring that these cities incorporate urban greening efforts to ensure resiliency and support ecological processes, such as connectivity (Lourdes et al., 2021; Sanusi & Bidin, 2020).
Characterising landscape connectivity using spatially explicit geographic information system (GIS) modelling approaches is critical to realistically describe networks of urban green spaces and their potential to support urban planning approaches that consider and maintain biodiversity values (Honeck et al., 2020). While there are extensive examples of the application of connectivity modelling to urban environments in the Global North, such as across Europe and North America (Balbi et al., 2021; Han & Keeffe, 2021; Serret et al., 2014; Tannier et al., 2016), there are very few examples in the tropics, in particular Southeast Asia with the majority of connectivity studies confined to agricultural or forested landscapes (e.g., Brodie et al., 2015; Hearn et al., 2018; Torre et al., 2019). This study represents one of the first urban connectivity studies conducted in a Southeast Asian city.
Common approaches to modelling the impact of fragmentation on connectivity utilise graph theoretic approaches to characterise a landscape as a network of patches and linkages, and their importance for connecting landscapes (Minor & Urban, 2008; Rayfield et al., 2011). Potential for dispersal between patches is based on ecological characteristics such as minimum viable patch size and interpatch dispersal distance (Tiang et al., 2021; Lechner, Doerr, et al., 2015). In addition to quantifying the importance of patches and linkages using graph metrics, graph components can identify patches that are interconnected but isolated from other groups of patches (Minor & Urban, 2008; Rayfield et al., 2011). The patterns in size and shape of these components can be used to characterise fragmentation and isolation (Lechner, Doerr, et al., 2015). Alternative approaches for modelling connectivity include the application of Circuitscape and least-cost pathway and corridors modelling (Adriaensen et al., 2003; McRae et al., 2008).
Underlying any connectivity modelling approach is spatial data characterising habitat and how the matrix may impede or support dispersal. In rapidly urbanising countries, major changes in land use can occur within a space of years and therefore it is essential to use spatial data that represent recent land cover (Gao & O'Neill, 2020; Ngo et al., 2020; Richards & Belcher, 2019). In Malaysia and many other developing countries, available spatial data are either not publicly available or have unsuitable spatial or temporal resolution and thus bespoke remote sensing approaches may often be needed. Remote sensing approaches, utilising multidate mosaics in Google Earth Engine (GEE) (Ang et al., 2021), were used in this study to address cloud cover, critical for mapping in the tropics, and also to provide an up to date characterisation of land cover. Such approaches hold great potential for providing high quality inputs for connectivity modelling.
The objective of this paper is to characterise ecological connectivity for mammals within Greater KL and identify important patches and linkages for connecting urban green spaces. We first map land cover across Greater KL with GEE to identify potential habitat. We then model connectivity using the remote sensing data, expert-based parameterisation and graph metrics for a range of dispersal guilds representing small and medium terrestrial and arboreal mammals. We conclude by discussing how such methods could be rapidly applied to other urban areas and the implication of the analysis for connecting urban habitat in the tropics such as in Greater KL, and other highly urbanising and fast-developing Southeast Asian cities.
2 METHODS
2.1 Study area: Greater KL
The conurbation of Greater KL (~3°8′N, 101°41′E) includes the federal capital of Malaysia KL and the 10 surrounding municipalities forming a contiguous urban region. KL evolved in the 1870s from an unknown small state to a booming mining city and finally became the capital of Malaysia, which subsequently developed into a megacity and has taken on all the challenges of rapid, often unplanned, urban growth (Nor et al., 2011). KL is the fastest-growing metropolitan region and has become the economic, financial and cultural capital of the country and one of the three Malaysian Federal Territories (United Nations, 2019). To the east of Greater KL is the extensively forested Titiwangsa mountain range protected by a number of National and State parks and forest reserves (FRs).
2.2 Study approach
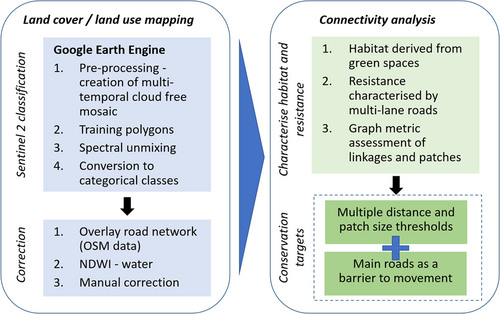
This study employs two main approaches: (1) land cover mapping of remotely sensed imagery using GEE, and (2) characterising connectivity of urban green spaces using a graph theoretic approach (Figure 1). The connectivity analysis included an assessment of how fragmentation in urban Greater KL varies with the ecological characteristics of movement and patch size.
2.3 Land cover mapping
The land cover map was derived from a combination of Sentinel 2, 10 m satellite data (Blue, Green, Red and Near Infrared bands) processed first in GEE and further supplemented by GIS data including OpenStreetMap data (OSM) and agricultural plantation data derived from a secondary data source. The Sentinel 2 data were used to accurately classify the spatial extent of major land cover classes, while the coarser scale ancillary data were used to reclassify vegetation into higher thematic resolution (agriculture and nonagriculture land covers) which are difficult to differentiate accurately with spectral data alone. Nine land cover classes were mapped: impervious, nonagricultural vegetation, water, bare soil, minor roads, major roads, oil palm, rubber tree and other agriculture (Supporting Information Appendix 1). The final land cover maps were assessed for accuracy using freely available high-resolution World View 2 imagery in Google Earth Pro.
2.3.1 GEE land cover classification
We created a land cover map of Greater KL in GEE, which is a cloud-based platform for planetary geodata analysis. GEE hosts the entire Sentinel 2 archive, provides tools and applications for accessing, processing and mosaicking images, and performs all analyses in parallel on Google's cloud-based processing platform (Gorelick et al., 2017). We used Java scripting in GEE application programming interface to acquire, preprocess and classify the data.
First, for the multitemporal cloud-free mosaic, the best available imagery of 2018 was selected, which had favourable seasonal conditions (low precipitation) mainly between February and May, so that the cloud cover was less than 40%. A total of 20 images were included in the mosaic. Cloudy pixels within image date were removed using a cloud filtering algorithm based on bands 2 (blue—490 nm) and 10 (short wave infrared—high atmospheric absorption band). The multitemporal image mosaic addresses difficulties associated with high cloud cover over the study area that otherwise makes it impossible to identify a single cloud-free image. From the mosaic a single image was created based on the median value for each pixel.
We then applied spectral unmixing/endmember analysis to the mosaic, to identify the percentage cover of vegetation (which included agricultural and nonagricultural vegetation), impervious surfaces, water and bare soil. For each of these landcover classes, 40 samples will be used to train the algorithm using a combination of the Sentinel 2 imagery and freely available high-resolution imagery provided by ArcGIS and Google Earth Pro (see Supporting Information Appendix 2 for further details spectral unmixing classification method).
2.3.2 Ancillary data for mapping agriculture and roads
In the second step we combined the spectral unmixing outputs from GEE with ancillary data to identify different kinds of agriculture land from vegetation and major and minor roads. First, we used land-use data from Malaysia's Iplan, integrated planning and information system (http://iplan.townplan.gov.my) to reclassify pixels classified as vegetation in the previous step, using spectral unmixing, to nonagricultural vegetation, oil palm, rubber and other agriculture. While we used a road layer from OSM (www.openstreetmap.org), an open-access crowd-sourced topographical spatial database to classify major and minor roads. From this database, road polylines were identified (Supporting Information Appendix 3), which were then buffered by 7.5 m on both sides for an average width of 15 m and overlayed to replace other land cover pixels.
2.3.3 Manual correction
As some landcovers were systematically misclassified after applying the supervised classification and updating with ancillary data, for example, roads were classified as water, several manual edits were made to the landcover layer in ArcMap 10.7.1. In addition, Normalised Difference Water Index with a threshold value of 0.1 was applied in GEE and specific regions were reclassified to water using this data. This threshold was identified through a visual assessment.
2.3.4 Accuracy assessment
A randomly spatial distributed set of 40 validation points per land cover type (Supporting Information Appendix 1) was produced using the same method as the training data, to construct a confusion matrix and quantitatively assess the effectiveness of land cover mapping.
2.4 Connectivity modelling
A graph theoretic approach along with modelling Euclidian distance of animal's movement between patches based on ecological parameters was used to assess green space connectivity within Greater KL. This approach allowed us to characterise the landscape as a network of patches connected by links (Dale & Fortin, 2010; Minor & Urban, 2008). Modelling was conducted using Graphab 2.4 software (Foltête et al., 2012). The outputs were interpreted through visualising fragmentation by identifying linkages between patches and quantifying the importance of patches and linkages through graph metrics (Lechner, Harris, et al., 2015).
2.4.1 Parameterisation and model scenarios
This study characterises green spaces connectivity based on movement patterns and patch sizes described by two key parameters: (1) a minimum patch size required to support viable populations and (2) an interpatch crossing distance that limits the maximum distance an animal is able to move between patches. Due to the lack of empirical data these parameters were obtained through consultation with 8 experts (Table 1) which include mammal ecologists from local NGOs and universities who have extensive experience in conservation work with local species, including the coauthors. Experts were consulted both individually and in group meetings using an iterative approach where the final parameter values were decided by the coauthor group through synthesising the various expert opinions (Lechner et al., 2017). The parameter values were derived by considering allometric relationships between species body mass (Sutherland et al., 2000) similar to previous studies which have used expert opinion to derive dispersal distances (Sahraoui et al., 2017).
| Group | Subgroup | Weight (kg) | Minimum habitat patch size (ha) | Interpatch crossing distance (m) | Example species of conservation concern |
|---|---|---|---|---|---|
| Small | Arboreal | <2 | 5 | 250 | Common grey-bellied squirrel, common tree shrew |
| Terrestrial | <2 | 5 | 1000 | Leopard cat | |
| Medium | Arboreal | 2–20 | 100 | 500 | Long-tailed macaque, black giant squirrel |
| Terrestrial | 2–20 | 100 | 5000 | Sunda pangolin, Malayan porcupine, Malay civet |
- Note: Species names by order of appearance in the table: Callosciurus caniceps, Tupaia flis, Prionailurus bengalensis, Macaca fascicularis, Ratufa bicolour, Manis javanica, Hystrix brachyura and Veverra tangalunga.
Four dispersal guilds were characterised which represent functional groups ranging from small to medium, arboreal and terrestrial mammals. Due to the highly urbanised nature of Greater KL, we modelled connectivity only for small- and medium-sized mammals. We did not model large mammals as large patches that support larger mammals are concentrated at the eastern border of the study area, specifically in the Selangor–Pahang border. These mammals have no incentive to move westward within Greater KL as there are no patches that fit their habitat profile (5000–10,000 ha).
We ran the connectivity model using Euclidean distance as there is insufficient knowledge of how species move through urban landscapes in Malaysia. In addition, we included a scenario for medium and small terrestrial subgroups, whereby movement across main roads was considered to be a barrier. This was used to determine the impact of main roads on connectivity for species that rely on terrestrial dispersal.
2.4.2 Characterising fragmentation and quantifying the importance of patches and links
Landscape connectivity was quantified using graph metrics and visualised with component boundaries. First, we visualised patch isolation using component boundaries. The boundaries were identified at the midpoint between two isolated patches or interconnected groups of patches. Large components describe multiple patches that are linked and characterising regions that are connected. Numerous small components represented by single or several small patches describe regions where dispersal is highly constrained. Spatial patterns of these components are useful for characterising fragmentation and barriers to connectivity at the regional scale (Lechner, Doerr, et al., 2015).
After, connectivity was quantified using graph metrics. We calculated two patch-scale graph metrics: (1) delta integral index of connectivity (dIIC) (Pascual-Hortal & Saura, 2006; Saura & Pascual-Hortal, 2007) and (2) clustering coefficient (CC) (Minor & Urban, 2008; Ricotta et al., 2000). The dIIC describes the impact of the loss of habitat availability caused by the removal of the focal patch or linkage between patches relative to the connectivity network. The higher the value, the greater the importance for landscape connectivity. While the CC measures path redundancy between the patch and its neighbouring patches. A higher value means alternative pathways exist for linking neighbouring patches. We also calculated the landscape-scale graph metric, number of components (NCs). As the NCs increase as connectivity across the landscape is poor and decreases as connectivity improves, the NCs act as an index of overall connectivity (Urban & Keitt, 2001).
At the landscape scale, to compare between the different species and the two major roads as barrier scenarios we calculated a range of descriptive statistics and landscape scale graph metrics. The descriptive statistics were average patch size (ha), standard deviation of patch size (ha), size of largest patch (ha), total patch area (ha), number of linkages, average interpatch crossing distance (m) and standard deviation of interpatch crossing distance (m). For the graph metrics we calculated the largest component size (ha), NCs, mean size of components (ha) and integral index of connectivity (IIC) (Lechner, Doerr, et al., 2015). The IIC represents the probability that two dispersers randomly located in the landscape can access each other, where higher values describe more connected landscapes and vice versa (Pascual-Hortal & Saura, 2006; Saura & Pascual-Hortal, 2007).
2.5 Land cover mapping
The land cover of Greater KL (Figure 2) was made up of the following land covers: impervious (19.4%), nonagricultural vegetation (47.5%), water (1.9%), bare soil (2.2%), minor roads (10.9%), major roads (2.0%), oil palm (7.9%), rubber tree (3.04%) and other agriculture (5.23%). Nonagricultural vegetation was the dominant type of classified land cover, accounting for about 147,959 ha of the total study area, followed by impervious (60,359 ha), while the land cover with the smallest area was water and accounted for 584,718 ha of the total study area (311,522 ha).
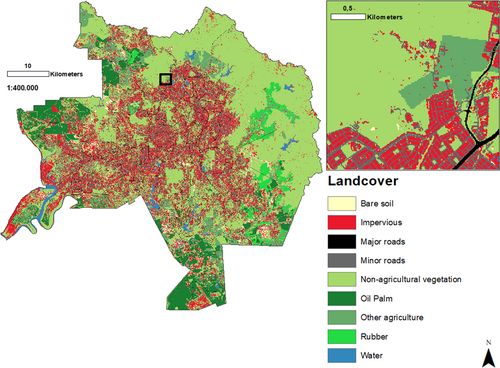
The overall accuracy of our land cover classification was 89.4% and the individual accuracy for the classes varied between 78.6% for nonagricultural vegetation and 100% for minor and major roads (see Supporting Information Appendix 5 for confusion matrix). The impervious area includes settlements, groups of buildings and other artificial surfaces (industrial and residential). Producer accuracy was between 78.62% for nonagricultural vegetation and 100% for major and minor roads and the accuracy of the user was between 65% for other agriculture and 100% for minor and major roads and 100% for water.
2.6 Wildlife connectivity modelling
2.6.1 Assessment of connectivity pathways and graph analysis
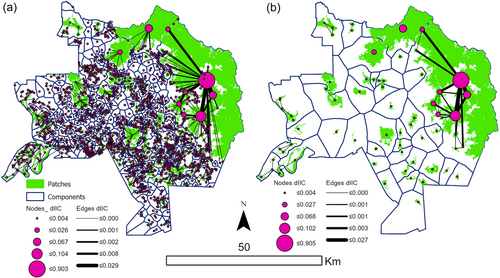
Habitat was represented by nonagricultural vegetation and the rest of the land covers were treated as matrix for the connectivity modelling (Figure 3), except for major roads which were used in the roads as barrier scenario analysis. Large circles in Figure 3 denote patches that are crucial patches for landscape connectivity (i.e., high dIIC values) and component boundaries describe isolated groups of patches.
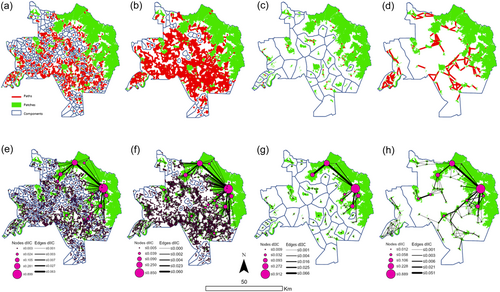
From the perspective of a small arboreal mammal subgroup with a minimum patch size of 5 ha and an interpatch crossing distance of 250 m (Figure 3a) the landscape is very fragmented especially in the highly urbanised areas away from the larger contiguous green areas. At this interpatch dispersal distance, connectivity was low, with a total of 274 components representing isolated patches. A total of 2218 paths connected patches within Greater KL. However, there was also a belt of connected patches around the outskirts of the highly urbanised areas, from the northwest down to the southeast consisting of larger patches. In contrast, the small terrestrial mammal subgroup (Figure 3b) with a minimum patch size of 5 ha and an interpatch crossing distance of 1000 m perceived the landscape as generally well connected, with 6722 connectivity paths connecting patches and 28 component boundaries. These 28 components were found to be at the edge of the study areas and the majority of the study area was well-connected.
The largest components were located in the east, where continuous forest can be found. The NCs increased by 1307% and 1950% for small and medium terrestrial mammals, respectively. These components were distributed evenly throughout the study area for both guilds and were only absent where large forest patches exist, in the east, indicating that habitat patches within urban areas are most likely isolated from each other.
The medium-size arboreal mammal subgroup (Figure 3c) with a minimum patch size of 100 ha and an interpatch crossing distance of 500 m had poor connectivity. In total there were 34 components, 41 linkages and 67 patches. As large patches were far apart from each other, most patches were isolated from each other and connectivity existed mainly within small patch clusters. In contrast the medium terrestrial mammal subgroup (Figure 3d) with a minimum patch size of 100 ha and an interpatch crossing distance of 5000 m perceived the landscape well connected, with only two components (i.e., the majority of patches were connected).
The analysis of dIIC (Figure 3e–h) for all subgroups shows that the eastern ranges provide the largest and most connected areas of habitat. Important linkages extend from the east into the urban matrix, especially for terrestrial small and medium mammals (Figure 3e,g). In addition, several large patches such as Ayer Hitam are key focal points for connectivity deep within the urban matrix. The CC analysis showed similar values for most patches and subgroups, indicating there were very small differences in terms of neighbourhood connectivity and levels of redundancy (Supporting Information Appendix 6). Only for large terrestrial mammals, specific patches were identified as important stepping-stones with little redundancy.
2.6.2 Major roads as barriers
The assessment of main roads acting as a barrier for movement for terrestrial mammals (Figure 4) showed a large reduction in connectivity compared with those cases where major roads were not considered as barriers (Figure 3). The small terrestrial mammal subgroup (Figure 4a) had 394 components, 2240 connectivity paths and 1612 patches. The only part of the landscape connected was located in the east. The medium terrestrial mammal subgroup had 41 components, 41 connectivity paths and 67 patches (Table 2 and Figure 4b).
| Patches | Linkages | Components | ||||||||||
|---|---|---|---|---|---|---|---|---|---|---|---|---|
| Group | Subgroup | Model | N | Mean ± SD size (ha) | Largest (ha) | Total area (ha) | N | Mean ± SD distance (m) | N | Mean size (ha) | Largest (ha) | IIC |
| Small | Arboreal | Default | 1612 | 68 ± 1109 | 42,334 | 109,554 | 2218 | 75.6 ± 76.5 | 274 | 1137.1 | 170,321.6 | 0.01059 |
| Terrestrial | Default | 6722 | 458 ± 325 | 28 | 11,127 | 276,476 | 0.01211 | |||||
| Roads | 2240 | 271.7 ± 281.0 | 394 | 790.8 | 77,781 | 0.00765 | ||||||
| Medium | Arboreal | Default | 67 | 1298 ± 5329 | 42,334 | 86,966 | 41 | 81.9 ± 131.4 | 34 | 8902.1 | 116,094 | 0.00981 |
| Terrestrial | Default | 152 | 2179.4 ± 1650 | 2 | 155,786.1 | 277,177 | 0.01114 | |||||
| Roads | 41 | 912.6 ± 1228.5 | 41 | 7599.3 | 85,943 | 0.00745 | ||||||
- Abbreviation: IIC, integral index of connectivity.
2.6.3 Landscape-scale graph metrics
A number of landscape-level graph metric statistics were calculated to allow for comparison between different groups and with the major road scenario (Table 2). For the default scenarios, both small terrestrial and arboreal groups had a larger total patch area than their medium-sized counterparts due to the smaller minimum patch size. However, all terrestrial groups had higher IIC values and fewer components than arboreal groups, indicating a more connected landscape. Species in the small mammal groups had more patches and larger total patch area compared with species in the medium-size groups. Higher IIC values were observed for the terrestrial groups, with small terrestrial species having the highest IIC value as many of the patches were connected with a large number of linkages and there was a greater overall area of habitat in the landscape. The opposite is true for the medium and small terrestrial groups in the scenario where major roads acted as barriers to movement. These scenarios resulted in lower IIC values, increased NCs and reduced number of linkages indicating an overall poorer degree of connectivity compared with the default scenarios.
2.7 Priorities for connectivity in the Greater KL
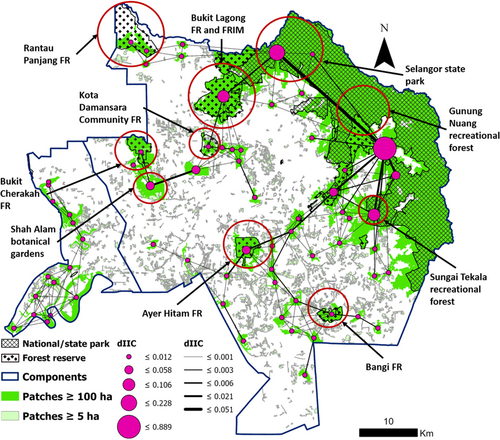
Figure 5 illustrates the potential for connections across Greater KL using Medium Terrestrial species group as a surrogate species, due to its long-distance dispersal between protected areas and FRs being severed due to urban development. Kota Damansara Community FR, Ayer Hitam FR, Rantau Panjang FR and Bukit Cherakah FR are few areas that could be isolated from surrounding areas for species with low dispersal capacity (Figure 3a–c). While the 545-ha forested site of the Forest Research Institute of Malaysia (FRIM) and adjacent Bukit Lagong FR are connected to the large forest patches at the east of the study area, many of the patches at their south and west are unreachable to arboreal mammals (Figure 3a,c). Efforts should be made to connect these isolated patches with FRIM, as isolated patches are immune to the “rescue effect”; where small patches receive emigrants from larger patches (van Schmidt & Beissinger, 2020). Overtime isolation may lead to a gradual population decline in these smaller and isolated patches.
3 DISCUSSION
3.1 Overall connectivity
The connectivity analysis of the four dispersal guilds showed large differences in the effects of fragmentation within Greater KL (Figure 3). Depending on the movement capacity of the dispersal guild, the landscape ranges from one dominated by isolated patches to a network of connected patches in which species exist in large metapopulations. In general, the landscape was less connected for smaller-bodied mammals, while terrestrial mammals perceived the landscape as more connected, due to their capacity to disperse farther than arboreal mammals (Lechner et al., 2017). The concentration of small components representing clusters of linked but isolated patches, especially for arboreal mammals, is spatially consistent with highly urbanised areas (townships like KL, Petaling Jaya, Shah Alam, Klang, Gombak and Sepang), where forested areas are few and far between. Patches available to medium-sized arboreal mammals were also isolated in clusters within highly urbanised areas, while terrestrial mammals were able to disperse across the landscape, even in urbanised areas. Our analysis also showed that, if major roads were treated as total barriers for small and medium terrestrial mammals, the landscape became considerably more fragmented (Figure 4). Thus, how species respond to infrastructure barriers is also likely to have a large influence on connectivity in Greater KL. Patch and landscape-level connectivity have great implications for the viability of populations in Greater KL.
3.2 Implications of connectivity for biodiversity within Greater KL
As urban expansion continues, forested patches and dispersal corridors are increasingly fragmented, leading to decreased connectivity and increased habitat isolation (Kong et al., 2010). However, the effects of urbanisation can have radically different connectivity impacts for different functional groups, as shown by our results, with smaller arboreal mammals found mostly in isolated patches. Species inhabiting urban patches are highly susceptible to anthropogenic pressures (Baker & Harris, 2007; Burger et al., 2004; Mooney & Hobbs, 2000), and the lack of immigration to these isolated patches can lead to a shrinking population (Bouchy et al., 2005). Both of these effects have negative impacts on the overall health of species (Romero, 2004), reducing genetic diversity in the long term (Lacy, 1987; Morandin et al., 2014), which can ultimately lead to local extinction (Fahrig, 2002). By contrast, species capable of dispersing to new patches, such as the medium-sized mammals in our study, are able to exploit new resources, find new mates and avoid conspecific threats and competition (Ramakrishnan, 2008). The long-term survival of a metapopulation depends on colonisation through local dispersal (van Nouhuys, 2016). Species found in isolated patches in Greater KL are likely to become locally extinct over time.
The matrix between patches, in particular linear infrastructure such as roads and highways, pose an overwhelmingly high mortality risk and barrier for many species, and can be linked to population decline in surrounding areas (Jamhuri et al., 2020; Zimmermann Teixeira et al., 2017). Connectivity for terrestrial mammals decreased drastically when roads were treated as total barriers, as shown by the decrease in dIIC values (Figure 4, Table 2). Mortality and road avoidance are the two outcomes that contribute to decreased dispersal and genetic diversity in areas fragmented by roads (Forman et al., 2003), and this is especially true in highly urbanised areas, where roads are in abundance. Populations separated by roads have reduced gene flow and increased divergence between populations (Jackson & Fahrig, 2011). If this scenario closely represents the current state of connectivity within Greater KL, forest-dependant terrestrial mammal populations will undergo biotic homogenisation (McKinney, 2006; Tee et al., 2018), and species more adapted to urban conditions may prevail in future (Francis & Chadwick, 2012).
3.3 Priorities for connectivity in Greater KL
The effects of urbanisation on the broader patterns of fragmentation are difficult to reverse (though theoretically possible), especially in Greater KL, through restoring green spaces (Lourdes et al., 2022). Proper land-use management is therefore necessary to mitigate such effects. Restoring ecological connectivity is essential for urban sustainable development (Nor, Corstanje, Harris, Grafius, et al., 2017), and this can be done by ensuring the movement of individuals and genes over multiple scales (Minor & Urban, 2007). Our analysis identified a potential network of green patches which could be used to connect all the key FRs and remnant vegetation patches in Greater KL (Figure 5). Revegetation efforts should be carried out to support existing connectivity, creating stepping-stones between those patches (Lechner et al., 2017). Urban wildlife corridors, if properly designed and established, have been shown to improve ecological connectivity within urban areas (Jain et al., 2014; McRae et al., 2012). It is important for urban planners to realise the great potential for creating a functional network of urban green spaces supporting biodiversity in Greater KL and the high risk of ecological collapse due to urban development if no action is taken (Jamhuri et al., 2018; Kanniah & Siong, 2017).
A wildlife connectivity scheme in Greater KL would also require the mitigation of the negative impacts of roads on connectivity. Wildlife crossings or eco-viaducts over major roads and underpasses can be a viable solution to reduce wildlife collisions (van der Grift et al., 2013) and improve connectivity across such anthropogenic features (Mimet et al., 2016). Several eco-viaducts have been constructed in Peninsular Malaysia for the purpose of enabling free crossings for wildlife across roads, such as the Sungai Yu eco-viaduct (MYCAT, 2019) and several along the Kuala Berang Highway (Samantha et al., 2020; Tan, 2014a). However, questions have been raised concerning their effectiveness (Samantha et al., 2020; Tan, 2014b), as many have been observed to be used by very few species. For example, eco-viaducts in Sabah, Malaysian Borneo, have been observed to be ineffective. Furthermore, existing studies in Southeast Asia are generally from rural settings, and the efficacy within urban environments needs to be tested. Several factors, such as sound from passing cars and the amount of light at wildlife crossing, which is much more common in urban environments, might discourage fauna from utilising wildlife crossings effectively (van der Ree et al., 2015).
3.4 Planning connected urban green spaces in Southeast Asia and modelling limitations
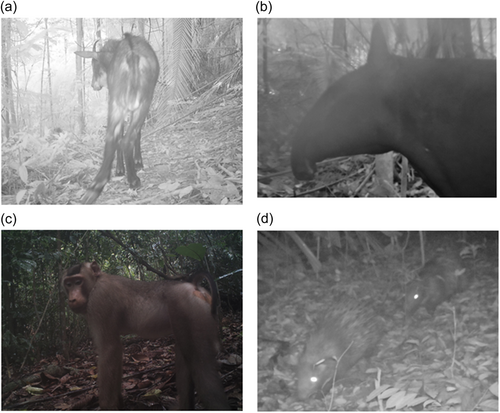
Our study represents the first connectivity modelling study in a global Southeast Asian city, to the best of our knowledge. Field-based studies in Greater KL have shown that the larger urban forests have the capacity to support a surprising amount of biodiversity, including species of conservation concern (such as International Union for Conservation of Nature (IUCN)-threatened species), even though they are surrounded by urbanisation (Tee et al., 2018) (Figure 6). Unlike many high-income nations, urbanisation is relatively recent in Southeast Asia, and the remnant green patches are surprisingly biodiverse (Figure 6). Thus, there is an urgent need to prioritise these last remaining green spaces to provide a unique opportunity to develop cities where both highly diverse nature and human residents coexist. Southeast Asian cities, such as Indonesia's new planned capital in Borneo (Teo et al., 2020) and Johor's Forest City (in Malaysia; Rahman, 2017) claim to promote green and sustainable urbanisation models. However, commonly, urban design approaches in Southeast Asia focus on developing urban green spaces, which are aesthetically pleasing but may not support ecological processes and functional connectivity required to maintain self-sustaining populations (Lechner et al., 2021). There is a need to embed quantitative approaches in assessing connectivity in urban design and planning in the region. Supporting biological diverse and functioning green spaces will also provide benefits to residents in terms of ecosystem services. On the hand coexisting with nature can bring ecosystem disservices in the form of human–wildlife conflicts, although urban citizens are relatively tolerant towards these problems (e.g., Tan et al., 2020).
While connectivity modelling techniques hold great promise to support planning connected urban green spaces, there are a number of commonly recognised limitations to applying multispecies connectivity modelling in general (see Sawyer et al., 2011; Wood et al., 2022), and also limitations specific to their application in urban Southeast Asia. Data and knowledge-poor regions, such as Malaysia, are challenging to paramaterise, and expert opinion can be highly uncertain, though the only option; representing the best approximation. Urban areas are also particularly complex for capturing movement behaviour (apart from the effects of linear infrastructure), due to an absence of ecological knowledge of movement behaviour in the matrix and the difficulty of mapping key features that promote connectivity in the urban context, such as street trees, underpasses or powerlines.
4 CONCLUSIONS
Greater KL may be perceived as well connected or highly fragmented, depending on species dispersal abilities and minimum patch size requirements. The discrepancy in connectivity between small and medium arboreal versus small and medium terrestrial mammals has important implications for species persistence within cities. Before the last green spaces and the functional connectivity between them are lost to urban growth, it is necessary to identify, conserve and link them. This is especially important for tropical Southeast Asia which is a hotspot for global biodiversity as well as a region for growing urbanisation. Our research identified a network of green spaces and linkages that could support connecting the major urban forests in the Greater KL. Our findings showed that Southeast Asia's Global South megacities have the capacity to support biodiversity in urban settings, as well as the possibility of new models of urban development that promote biodiversity through the protection, restoration and creation of networks of high-biodiversity green spaces.
AUTHOR CONTRIBUTIONS
Jennifer Danneck: Data curation; methodology; writing—original draft. Darrel Chin Fung Tiang: Data curation; methodology; writing—original draft. Khanh Ngo Duc: Data curation; methodology; writing—original draft. Badrul Azhar: Writing—review and editing. Ruzana Sanusi: Writing—review and editing. Ahimsa Campos-Arceiz: Writing—review and editing. Alex M. Lechner: Supervision; writing—original draft; writing—review and editing.
ACKNOWLEDGEMENTS
We would like to thank the experts who assisted with parameterising the model and the anonymous reviewers for their constructive feedback.
CONFLICT OF INTEREST STATEMENT
The authors declare no conflict of interest.
Open Research
DATA AVAILABILITY STATEMENT
The data that support the findings of this study are available from the corresponding author upon reasonable request.


