A predictive model for ischemic colitis: Integrating clinical and laboratory parameters
[Correction added on 28 September 2024, after first online publication: The third sentence in section 2.3 has been removed. In Section 3.1 second paragraph, the text has been changed from “the median age” to “the mean age”. In Table 1 and 2, the text has been changed from “media [SD]” to “mean [SD]”. ]
Abstract
Objective
We aimed to develop a predictive model for the clinical diagnosis of ischemic colitis (IC).
Methods
Clinical data were collected from patients with acute IC lesions who were diagnosed and admitted to Beijing Tsinghua Changgung Hospital from January 2016 to December 2022. These patients were included in the IC case group in this retrospective observational study. The control group comprised patients aged ≥40 years who were diagnosed with abdominal pain during the same period, excluding those with IC. All patients were divided into a training and test sets based on the time window. Least absolute shrinkage and selection operator regression was used to screen risk factors for the occurrence of IC. Logistic stepwise regression (maximum likelihood ratio method) was performed in multifactorial analysis, and a diagnostic prediction model for IC was established using R language. The area under the receiver operating characteristic (ROC) curve (AUC) was examined to assess differentiation using working ROC curves. We used bootstrap resampling (1000 times) for internal validation. Model calibration curves and decision curve analysis (DCA) were also applied.
Results
Our study indicates that constipation, hematochezia, neutrophil counts, and specific abdominal computed tomography (CT) (plain scan) findings, including intestinal wall edema and thickening, intestinal lumen stenosis, and dilation, are independent predictors of IC. The predictive model exhibited high discriminative ability with an AUC of 0.9788 in the training set, and the calibration and DCA curves demonstrated excellent model performance. After validation, the AUC remained robust at 0.9868, underscoring the model's reliability in predicting IC.
Conclusion
According to our model, constipation accompanied by hematochezia necessitates careful consideration of IC. Abdominal CT (plain scan) is an effective diagnostic tool for IC, and it is common for patients to exhibit elevated neutrophil counts. The predictive model, demonstrating high discriminative ability and accuracy, shows promise for practical application in clinical settings, aiding in the early diagnosis and management of IC.
Abbreviations
-
- AUC
-
- area under curve
-
- CI
-
- credible interval
-
- CT
-
- computed tomography
-
- DCA
-
- decision curve analysis
-
- IC
-
- ischemic colitis
-
- LASSO
-
- least absolute shrinkage and selection operator
-
- ROC
-
- receiver operating characteristic curve
1 INTRODUCTION
Ischemic colitis (IC) is a common vascular disease of the digestive system. IC occurs when blood flow to the colon decreases to a level that is insufficient to maintain cellular metabolic functions. This leads to hypoxia, dysfunction, and eventual death of colon cells [1]. IC is also known as colon ischemia and often causes ischemic and inflammatory changes in the colonic mucosa [2]. The incidence of IC has been increasing in recent years owing to the aging population, the rise in cardiovascular and cerebrovascular diseases, and the increased acceptance of colonoscopy. Studies have shown a nearly fourfold increase in the incidence of IC in recent decades, reaching 22.9/100,000 people per year [3]. However, it is important to note that the actual incidence may be higher owing to factors such as patients not seeking medical attention or underdiagnosis.
IC is more commonly observed in older patients with atherosclerosis of the mesenteric arteries [4]. Although reduced blood supply to the colon owing to various diseases and physical conditions can lead to IC, several well-established risk factors are associated with atherosclerosis, age-related diseases, and medications [5]. Typically, older female patients have a higher risk of developing IC [1]. However, in recent years, there has been an increase in the number of younger patients, possibly owing to factors such as hypercoagulability, vascular disease, long-distance running, smoking, constipation, and use of oral contraceptives [6, 7]. Additionally, patients with IC often present with various systemic diseases, along with a history of drug use, abdominal surgeries, and examinations. These factors make it challenging to identify the specific risk factors for IC and further complicate the diagnosis and treatment process.
Patients with IC often present with abdominal pain and hematochezia [8]. However, these clinical manifestations lack typicality, and the laboratory test indicators lack specificity. Computed tomography (CT) examination is often unable to identify vascular lesions, and timely colonoscopy is necessary to identify IC. Consequently, diagnosing IC is challenging and prone to misdiagnosis or even missed diagnosis. However, if left untreated, IC can progress to severe complications such as intestinal necrosis, gastrointestinal perforation, and peritonitis, leading to a poor prognosis and increased mortality rate. Given the multiple potential causes of a patient's abdominal pain, the possibility of IC is often overlooked by primary care physicians despite the serious impact of IC on patient prognosis. Additionally, there is still a lack of current research on developing predictive models for the diagnosis of IC. Therefore, it is crucial to summarize the clinical data of patients with IC, identify the risk factors, and develop a diagnostic prediction model that can provide valuable decision-making information for health care professionals.
The purpose of this study was to develop a clinical prediction model for IC to enhance the timely diagnosis of this disease.
2 METHODS
2.1 Study design
This retrospective observational study adheres to the Declaration of Helsinki of the World Medical Association and was approved by Beijing Tsinghua Changgung Hospital Ethics Committee (approval number 23638-6-01). Informed consent was waived owing to the retrospective nature of the study and anonymity of the clinical data.
2.2 Patients and study setting
This study focused on inpatients who were diagnosed with acute IC lesions for the first time at Beijing Tsinghua Changgung Hospital. The study period was from January 1, 2016 to December 31, 2022. The control group comprised inpatients aged 40 years or older who had symptoms of abdominal pain during the same period. These patients underwent colonoscopy and abdominal CT examinations, which excluded IC. The inclusion criteria for the case group were based on the clinical guidelines for IC issued by the American College of Gastroenterology in 2015 [1]. Patients with incomplete clinical record data and those with serious diseases in other organs were excluded from the study. Demographic, clinical, laboratory, and imaging data were collected from the electronic medical records of both groups using standardized forms. The abdominal CT plain scan with a 5 mm slice thickness sequence was used to measure the abdominal aortic calcium index of patients [9]. These data were chosen because they could potentially be related to the reality of clinical practice as well as to previously proposed risk factors for IC [1, 4, 5].
2.3 Statistical analysis and clinical predictive model development
We used IBM SPSS 22.0 (IBM Corp.) for statistical analysis of the data. Continuous variables that followed a normal distribution are described using mean ± standard deviation, and an independent samples t-test was used for comparisons between groups. Count data are presented using frequency and percentage, and the chi-square test or Fisher's exact probability test was used for comparisons between groups. Patients were divided into a training and test sets based on the cutoff date of December 31, 2020. The training set included patients who were treated before this node; the remaining patients were included in the verification set. Least absolute shrinkage and selection operator (LASSO) regression was applied to screen predictive factors influencing the occurrence of IC in the training set. Logistic stepwise regression (maximum likelihood ratio method) was conducted in multifactor analysis to establish a regression model. The results of multifactor analysis were visualized using R software to create a nomogram (The R Project for Statistical Computing, Vienna, Austria). Receiver operating curve (ROC) analysis was performed on both the training set and validation set to assess the discrimination ability of the model, and bootstrap resampling (1000 times) was used for internal validation. Additionally, model calibration curves and decision curve analysis (DCA) were applied. Statistical significance was set at p < 0.05 (two-sided).
3 RESULTS
3.1 Patient characteristics
A total of 331 patients were included in this study, comprising 118 (35.6%) in the case group and 213 (64.4%) in the control group.
Table 1 presents the demographic, clinical, laboratory, and imaging characteristics of patients in the case and control groups. The mean age of the case group was 66.6 (±9.3) years and 65 patients (55.1%) were women. In the control group, the mean age was 65.4 (±8.4) years and 111 patients (52.1%) were women.
| Variables | Case group (n = 118) | Control group (n = 213) | p |
|---|---|---|---|
| Demographic characteristics | |||
| Age-years (mean [SD]) | 66.6 ± 9.3 | 65.4 ± 8.4 | 0.231 |
| Female-n (%) | 65 (55.1) | 111 (52.1) | 0.686 |
| Risk factors for IC | |||
| BMI-kg/m2 (mean [SD]) | 22.7 ± 4.0 | 24.0 ± 3.7 | 0.003 |
| Smoking-n (%) | 43 (36.4) | 50 (23.5) | 0.017 |
| Drinking-n (%) | 26 (22.0) | 34 (16.0) | 0.221 |
| Hypertension-n (%) | 72 (61.0) | 86 (40.4) | <0.001 |
| Diabetes-n (%) | 38 (32.2) | 39 (18.3) | 0.006 |
| Cerebral infarction-n (%) | 16 (13.6) | 11 (5.2) | 0.014 |
| Atrial fibrillation-n (%) | 11 (9.3) | 5 (2.3) | 0.010 |
| Coronary artery disease-n (%) | 27 (22.9) | 18 (8.5) | <0.001 |
| Dyslipidemia-n (%) | 37 (31.4) | 48 (22.5) | 0.104 |
| Chronic heart failure-n (%) | 11 (9.3) | 0 (0.0) | <0.001 |
| Chronic kidney disease-n (%) | 8 (6.8) | 2 (0.9) | 0.008 |
| Bowel resection-n (%) | 14 (11.9) | 23 (10.8) | 0.910 |
| Constipation-n (%) | 51 (43.2) | 20 (9.4) | <0.001 |
| Beta-blockers-n (%) | 33 (28.0) | 27 (12.7) | 0.001 |
| Diuretics-n (%) | 25 (21.2) | 10 (4.7) | <0.001 |
| NSAIDs-n (%) | 37 (31.4) | 23 (10.8) | <0.001 |
| Clinical manifestation at the time of IC diagnosis-n (%) | |||
| Nausea | 27 (22.9) | 25 (11.7) | 0.012 |
| Vomiting | 23 (19.5) | 22 (10.3) | 0.031 |
| Abdominal pain | 82 (69.5) | 213 (100.0) | <0.001 |
| Abdominal distension | 32 (27.1) | 40 (18.8) | 0.105 |
| Diarrhea | 35 (29.7) | 26 (12.2) | <0.001 |
| Hematochezia | 90 (76.3) | 31 (14.6) | <0.001 |
| Peritonitis | 12 (10.2) | 5 (2.3) | 0.005 |
| Vital signs at IC the diagnosis | |||
| Fever (>37°C)-n (%) | 20 (16.9) | 13 (6.1) | 0.003 |
| Systolic blood pressure-mm Hg- (mean [SD]) | 129.6 ± 19.8 | 129.1 ± 16.1 | 0.810 |
| Diastolic blood pressure (mean [SD]) | 73.2 ± 10.7 | 70.7 ± 10.2 | 0.036 |
| Heart rate-bpm (mean [SD]) | 80.2 ± 16.2 | 78.9 ± 10.8 | 0.367 |
| Laboratory findings at IC diagnosis-(mean [SD]) | |||
| Hemoglobin-g/L | 120.2 ± 30.3 | 134.1 ± 17.2 | <0.001 |
| C-reactive protein-mg/L | 41.2 ± 59.7 | 7.5 ± 22.7 | <0.001 |
| Leukocytes- × 109 cells/L | 9.5 ± 5.3 | 6.1 ± 1.9 | <0.001 |
| Neutrophils- × 109 cells/L | 7.3 ± 5.2 | 3.7 ± 1.6 | <0.001 |
| Lymphocytes- × 109 cells/L | 1.5 ± 0.7 | 1.8 ± 0.7 | <0.001 |
| Serum sodium level-mmol/L | 140.3 ± 3.5 | 142.1 ± 2.8 | <0.001 |
| Serum albumin-g/L | 38.4 ± 6.7 | 42.5 ± 4.2 | <0.001 |
| Lactate dehydrogenase-U/L | 211.9 ± 138.9 | 182.4 ± 181.8 | 0.127 |
| Serum creatinine-µmol/L | 95.7 ± 120.8 | 62.6 ± 13.6 | <0.001 |
| Blood uric acid level-µmol/L | 329.6 ± 114.5 | 329.9 ± 88.2 | 0.981 |
| Total cholesterol level-mmol/L | 4.4 ± 1.1 | 4.4 ± 0.9 | 0.595 |
| Triglyceride levels-mmol/L | 1.5 ± 0.6 | 1.5 ± 0.7 | 0.990 |
| HDL cholesterol level-mmol/L | 1.1 ± 0.4 | 1.1 ± 0.3 | 0.120 |
| LDL cholesterol level-mmol/L | 2.6 ± 0.9 | 2.7 ± 0.8 | 0.295 |
| Glycated hemoglobin level-% | 6.5 ± 1.6 | 5.9 ± 0.6 | <0.001 |
| D-dimer-mg/LFEU | 2.7 ± 4.8 | 0.5 ± 0.7 | <0.001 |
| Imaging examinations at IC diagnosis | |||
| Carotid atherosclerotic plaque-n (%) | 79 (66.9) | 75 (35.2) | <0.001 |
| Lower extremity thrombosis-n (%) | 13 (11.0) | 6 (2.8) | 0.005 |
| Abdominal aortic calcification index (mean [SD]) | 0.2 ± 0.2 | 0.1 ± 0.1 | <0.001 |
| Abdominal CT (plain scan) indicating intestinal wall edema and thickening, intestinal lumen stenosis, and intestinal dilation-n (%) | 74 (62.7) | 8 (3.8) | <0.001 |
- Abbreviations: BMI, body mass index; CT, computed tomography; HDL, high-density lipoprotein; IC, ischemic colitis; LDL, low-density lipoprotein; NSAIDS, nonsteroidal anti-inflammatory drugs; SD, standard deviation.
Significant differences were observed among various risk factors for IC, such as body mass index (22.7 ± 4.0 kg/m2 vs. 24.0 ± 3.7 kg/m2, p = 0.003), smoking (36.4% vs. 23.5%, p = 0.017), hypertension (61.0% vs. 40.4%, p < 0.001), diabetes (32.2% vs. 18.3%, p = 0.006), cerebral infarction (13.6% vs. 5.2%, p = 0.014), atrial fibrillation (9.3% vs. 2.3%, p = 0.010), coronary heart disease (22.9% vs. 8.5%, p < 0.001), chronic heart failure (9.3% vs. 0.0%, p < 0.001), chronic kidney disease (6.8% vs. 0.9%, p = 0.008), constipation (43.2% vs. 9.4%, p < 0.001), beta blockers (28.0% vs. 12.7%, p = 0.001), diuretics (21.2% vs. 4.7%, p < 0.001), and nonsteroidal anti-inflammatory drugs (31.4% vs. 10.8%, p < 0.001). Clinical manifestations at the time of IC diagnosis also exhibited statistically significant differences in nausea (22.9% vs. 11.7%, p = 0.012), vomiting (19.5% vs. 10.3%, p = 0.031), abdominal pain (69.5% vs. 100.0%, p < 0.001), diarrhea (29.7% vs. 12.2%, p < 0.001), hematochezia (76.3% vs. 14.6%, p < 0.001), and peritonitis (10.2% vs. 2.3%, p = 0.005). Fever (16.9% vs. 6.1%, p = 0.003) and diastolic blood pressure (73.2 ± 10.7 mmHg vs. 70.7 ± 10.2 mmHg, p = 0.036) at the time of IC diagnosis showed a significant difference among vital signs. Laboratory parameters, including hemoglobin (120.2 ± 30.3 g/L vs. 134.1 ± 17.2 g/L, p < 0.001), C-reactive protein (41.5 ± 59.7 mg/L vs. 7.5 ± 22.7 mg/L, p < 0.001), leukocytes (9.5 ± 5.3 × 10⁹/L vs. 6.1 ± 1.9 × 10⁹/L, p < 0.001), neutrophils (7.3 ± 5.2 × 10⁹/L vs. 3.7 ± 1.6 × 10⁹/L, p < 0.001), lymphocytes (1.5 ± 0.7 × 10⁹/L vs. 1.8 ± 0.7 × 10⁹/L, p < 0.001), serum sodium (140.3 ± 3.5 mmol/L vs. 142.1 ± 2.8 mmol/L, p < 0.001), serum albumin (38.4 ± 6.7 g/L vs. 42.5 ± 4.2 g/L, p < 0.001), serum creatinine (95.7 ± 120.8 μmol/L vs. 62.6 ± 13.6 μmol/L, p < 0.001), glycated hemoglobin (6.5% ± 1.6% vs. 5.9% ± 0.6%, p < 0.001), and D-dimer (2.7 ± 4.8 mg/LFEU vs., 0.5 ± 0.7 mg/LFEU, p < 0.001) demonstrated statistically significant differences. Imaging examinations revealed significant differences in carotid atherosclerotic plaques (66.9% vs. 35.2%, p < 0.001), lower extremity thrombosis (11.0% vs. 2.8%, p = 0.005), abdominal aortic calcification index (0.2 ± 0.2 vs. 0.1 ± 0.1, p < 0.001), and abdominal CT (plain scan) indicating intestinal wall edema and thickening, intestinal lumen stenosis, and intestinal dilation (62.7% vs. 3.8%, p < 0.001).
3.2 Training set and validation set
According to internationally recognized practices for establishing and verifying prediction models [10], a total of 331 patients from the case and control groups were divided into training and validation sets based on time windows. Patients treated before December 31, 2020 were assigned to the training set, and the remaining patients were assigned to the validation set. The training set included 223 patients, and the validation set comprised 98 patients. A comparison of the clinical data between the two groups showed no significant difference, indicating that the validation set was comparable to the training set (Table 2).
| Variables | Training set (n = 233) | Validation set (n = 98) | p |
|---|---|---|---|
| Demographic characteristics | |||
| Age-years (mean [SD]) | 65.5 ± 8.8 | 66.4 ± 8.6 | 0.399 |
| Female-n (%) | 126 (54.1) | 50 (51.0) | 0.698 |
| Risk factors for IC | |||
| BMI-kg/m2 (mean [SD]) | 23.5 ± 4.1 | 23.5 ± 3.2 | 0.896 |
| Smoking-n (%) | 66 (28.3) | 27 (27.6) | 0.993 |
| Drinking-n (%) | 43 (18.5) | 17 (17.3) | 0.934 |
| Hypertension-n (%) | 112 (48.1) | 46 (46.9) | 0.946 |
| Diabetes-n (%) | 53 (22.7) | 24 (24.5) | 0.841 |
| Cerebral infarction-n (%) | 21 (9.0) | 6 (6.1) | 0.511 |
| Atrial fibrillation-n (%) | 12 (5.2) | 4 (4.1) | 0.894 |
| Coronary artery disease-n (%) | 31 (13.3) | 14 (14.3) | 0.950 |
| Dyslipidemia-n (%) | 60 (25.8) | 25 (25.5) | 0.999 |
| Chronic heart failure-n (%) | 7 (3.0) | 4 (4.1) | 0.870 |
| Chronic kidney disease-n (%) | 9 (3.9) | 1 (1.0) | 0.304 |
| Bowel resection-n (%) | 27 (11.6) | 10 (10.2) | 0.862 |
| Constipation-n (%) | 55 (23.6) | 16 (16.3) | 0.185 |
| Beta-blockers-n (%) | 43 (18.5) | 17 (17.3) | 0.934 |
| Diuretics-n (%) | 27 (11.6) | 8 (8.2) | 0.466 |
| NSAIDs-n (%) | 42 (18.0) | 18 (18.4) | 0.999 |
| Clinical manifestation at IC the diagnosis-n (%) | |||
| Nausea | 41 (17.6) | 11 (11.2) | 0.197 |
| Vomiting | 37 (15.9) | 8 (8.2) | 0.090 |
| Abdominal pain | 204 (87.6) | 91 (92.9) | 0.222 |
| Abdominal distension | 49 (21.0) | 23 (23.5) | 0.730 |
| Diarrhea | 45 (19.3) | 16 (16.3) | 0.628 |
| Hematochezia | 85 (36.5) | 36 (36.7) | 0.999 |
| Peritonitis | 12 (5.2) | 5 (5.1) | 0.999 |
| Vital signs at IC the diagnosis | |||
| Fever (>37°C)-n (%) | 24 (10.3) | 9 (9.2) | 0.913 |
| Systolic blood pressure-mm Hg- (mean [SD]) | 128.8 ± 16.4 | 130.2 ± 19.9 | 0.506 |
| Diastolic blood pressure (mean [SD]) | 71.4 ± 10.7 | 71.9 ± 9.8 | 0.734 |
| Heart rate-bpm (mean [SD]) | 79.8 ± 12.2 | 78.4 ± 14.6 | 0.368 |
| Laboratory findings at IC diagnosis-(mean [SD]) | |||
| Hemoglobin-g/L | 129.1 ± 23.7 | 129.4 ± 23.8 | 0.924 |
| C-reactive protein-mg/L | 19.1 ± 41.0 | 20.5 ± 47.8 | 0.779 |
| Leukocytes- × 109 cells/L | 7.2 ± 3.8 | 7.5 ± 4.1 | 0.450 |
| Neutrophils- × 109 cells/L | 4.9 ± 3.7 | 5.2 ± 3.9 | 0.485 |
| Lymphocytes- × 109 cells/L | 1.7 ± 0.8 | 1.7 ± 0.6 | 0.334 |
| Serum sodium level-mmol/L | 141.4 ± 3.2 | 141.7 ± 3.3 | 0.557 |
| Serum albumin-g/L | 41.0 ± 5.6 | 41.0 ± 5.4 | 0.999 |
| Lactate dehydrogenase-U/L | 196.1 ± 197.1 | 185.3 ± 56.6 | 0.593 |
| Serum creatinine-µmol/L | 73.5 ± 69.1 | 76.4 ± 86.3 | 0.748 |
| Blood uric acid level-µmol/L | 326.6 ± 99.9 | 337.4 ± 94.2 | 0.360 |
| Total cholesterol level-mmol/L | 4.4 ± 1.0 | 4.4 ± 1.0 | 0.782 |
| Triglyceride levels-mmol/L | 1.5 ± 0.7 | 1.5 ± 0.7 | 0.622 |
| HDL cholesterol level-mmol/L | 1.1 ± 0.4 | 1.1 ± 0.3 | 0.660 |
| LDL cholesterol level-mmol/L | 2.7 ± 0.8 | 2.6 ± 0.9 | 0.429 |
| Glycated hemoglobin level-% | 6.2 ± 1.2 | 6.0 ± 0.9 | 0.206 |
| D-dimer-mg/LFEU | 1.4 ± 3.6 | 1.0 ± 1.4 | 0.265 |
| Imaging examinations at IC diagnosis | |||
| Carotid atherosclerotic plaque-n (%) | 111 (47.6) | 43 (43.9) | 0.613 |
| Lower extremity thrombosis-n (%) | 12 (5.2) | 7 (7.1) | 0.651 |
| Abdominal aortic calcification index (mean [SD]) | 0.1 ± 0.1 | 0.1 ± 0.1 | 0.821 |
| Abdominal CT (plain scan) indicating intestinal wall edema and thickening, intestinal lumen stenosis, and intestinal dilation-n (%) | 60 (25.8) | 22 (22.4) | 0.620 |
- Abbreviations: BMI, body mass index; CT, computed tomography; HDL, high-density lipoprotein; IC, ischemic colitis; LDL, low-density lipoprotein; NSAIDS, nonsteroidal anti-inflammatory drugs; SD, standard deviation.
3.3 Risk model development
In this study, LASSO regression was used to identify significant combinations of risk factors. LASSO is a compressed estimation method that uses penalized order function. Its main objective is to minimize the sum of squared residuals while ensuring that the sum of the absolute values of regression coefficients is less than a constant (lambda, λ). This constraint allows for the identification of regression coefficients that are exactly equal to zero, simplifying the model and enabling variable screening [11, 12]. To establish the LASSO regression model (Figure 1), the occurrence of IC disease was considered the dependent variable, and the remaining variables were treated as independent variables. The model's minimum mean square error was determined to be one standard deviation of lambda, specifically when lambda equals 0.0131. At this point, the model included seven variables with non-zero coefficients (Table 3): constipation, hematochezia, abdominal pain, neutrophils, glycated hemoglobin, abdominal aortic calcium index, and abdominal CT (plain scan) indicating intestinal wall edema and thickening, intestinal lumen stenosis, and intestinal dilation. These variables were then used as independent variables to establish a multifactor logistic regression model for predicting IC occurrence. The independent variables screened in the LASSO regression were analyzed using multifactor logistic regression in the training set (Table 4). The results showed that constipation (odds ratio [OR] = 9.459, 95% confidence interval [CI] = 2.295–38.986, p = 0.002), hematochezia (OR = 17.898, 95% CI = 4.958–64.605, p < 0.010), neutrophils (OR = 1.473, 95% CI = 1.165–1.862, p = 0.001), and abdominal CT (plain scan) indicating intestinal wall edema and thickening, intestinal lumen stenosis, and intestinal dilation (OR = 21.439, 95% CI = 5.877–78.214, p < 0.010) were independent predictors of IC.
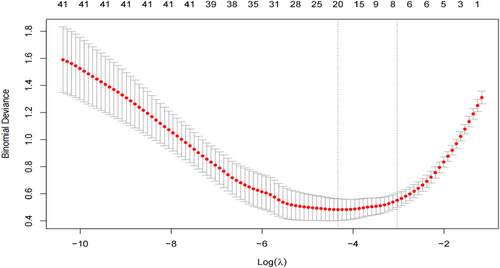
Least absolute shrinkage and selection operator regression selection influences.
| Variables | Modulus |
|---|---|
| Intercept | −3.979 |
| Constipation | 0.830 |
| Hematochezia | 1.418 |
| Abdominal pain | −1.528 |
| Neutrophils | 0.107 |
| Glycated hemoglobin level | 0.014 |
| Abdominal aortic calcification index | 1.317 |
| Abdominal CT (plain scan) indicating intestinal wall edema and thickening, intestinal lumen stenosis, and intestinal dilation | 1.895 |
- Abbreviation: CT, computed tomography.
| Predictor variables | OR | 95% CI | p |
|---|---|---|---|
| Constipation | 9.459 | 9.459 (2.295, 38.986) | 0.002 |
| Hematochezia | 17.898 | 17.898 (4.958, 64.605) | <0.010 |
| Abdominal pain | 0.000 | 0.000 (0.000, inf) | 0.99 |
| Neutrophils | 1.473 | 1.473 (1.165, 1.862) | 0.001 |
| Glycated hemoglobin level | 1.661 | 1.661 (0.983, 2.807) | 0.058 |
| Abdominal aortic calcification index | 4.416 | 4.416 (0.007, 2634.457) | 0.649 |
| Abdominal CT (plain scan) indicating intestinal wall edema and thickening, intestinal lumen stenosis, and intestinal dilation | 21.439 | 21.439 (5.877, 78.214) | <0.010 |
- Abbreviations: CI, confidence interval; CT, computed tomography; IC, ischemic colitis; OR, odds ratio.
3.4 Nomogram
Figure 2 presents a nomogram created using the R language to predict the occurrence of IC. This nomogram is based on the results of multifactor logistic regression analysis of the IC training set, which serves as a diagnostic prediction model for IC. The IC nomogram assigns scores to various factors including constipation, hematochezia, neutrophils, and abdominal CT (plain scan) indicating intestinal wall edema and thickening, intestinal lumen stenosis, and intestinal dilation. By summing the scores, the total score can be obtained, and the corresponding probability of IC can be determined. This probability represents the likelihood of the patient developing IC.
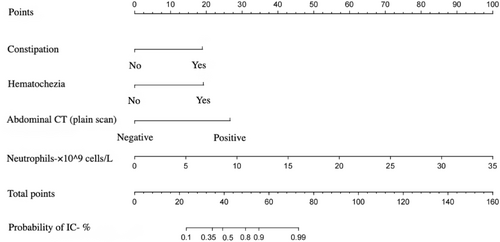
Nomogram to estimate the probability of ischemic colitis (IC). Instructions: Draw a line upward to the points axis to determine the points for each predictor variable. Sum all points from the variables and locate the sum on the “total points” axis. Draw a line down to the risk of IC axis to determine the patient's probability of IC (%). CT, computed tomography.
3.5 Model validation
The diagnostic prediction model of IC mentioned above was applied to the validation set for verification. Discrimination testing using the ROC and AUC was performed on both the training set and validation set.
As depicted in Figure 3, both the training set and validation set data were in the model for discrimination testing. The AUC for the training set was 0.9788 with a 95% CI of (0.9639, 0.9937); the AUC for the validation set was 0.9868 with a 95% credible interval of (0.9723, 1.000). AUC values exceeding 0.9 indicate a high level of discrimination.
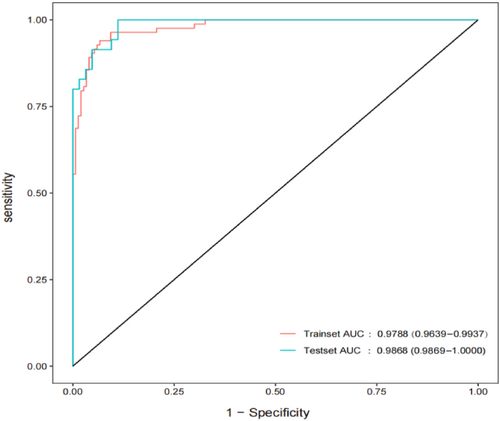
Area under the receiver operating characteristic curve according to the training and validation sets.
Figure 4 presents the calibration curve of the IC diagnosis prediction model, which was tested using the bootstrap (1000 times) random resampling method. The calibration curve closely resembles the ideal curve, suggesting that the IC diagnosis prediction model has a strong fitting effect and the predicted probabilities align well with the actual probabilities.
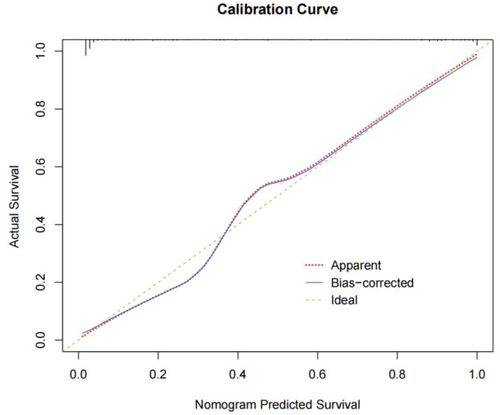
Calibration curves for ischemic colitis diagnostic prediction models.
Figure 5 presents the DCA curve of the IC diagnosis prediction model. The gray solid line represents the net benefit curve of all patients with IC, and the black solid line represents the net benefit curve of all patients without IC. The purple solid line represents the predicted outcome of the model. The net benefit curve obtained indicates that the model's predicted net benefit is greater than those of the gray and black curves. This suggests that the model's prediction effect has actual clinical value.
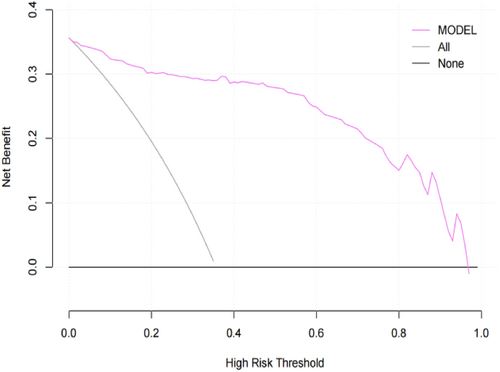
Decision curve analysis curves for ischemic colitis diagnostic prediction models.
4 DISCUSSION
This study presents a straightforward clinical prediction model that can assist clinicians in diagnosing IC. In our cohort, constipation, hematochezia, neutrophils, and abdominal CT (plain scan) indicating intestinal wall edema and thickening, intestinal lumen stenosis, and intestinal dilation were identified as independent predictors of IC. These variables were adopted to develop a user-friendly scoring system that exhibited exceptional diagnostic accuracy and practical clinical utility.
Previous studies have suggested that constipation is a risk factor for IC [13]. In this study, multifactor logistic regression analysis demonstrated that constipation independently predicts the occurrence of IC. These findings are in line with previous research. The underlying mechanism could be attributed to constipation causing an elevation in abdominal pressure, consequently leading to a decrease in colonic blood supply. According to previous research, the most common clinical manifestations of IC include abdominal pain, urgent defecation, and bloody diarrhea [8]. This study suggests that hematochezia symptoms are independent predictive factors in the clinical diagnostic model of IC. There are two possible reasons for this. First, vascular lesions, such as atherosclerosis, can obstruct blood circulation in the colon, which is a common cause of IC. Second, IC can lead to an insufficient oxygen supply to colon tissue, potentially resulting in tissue necrosis. When necrotic tissue mixes with feces or breaks off, it can cause bloody stools. Abdominal CT (plain scan) is commonly used to screen patients with hemodynamically stable acute abdominal pain. This is currently considered the primary non-invasive method for evaluating IC. This type of scan can provide information about the anatomical location and extent of the affected colon, as well as the timing and duration of ischemia. It can also help assess the severity and stage of the condition, identify any complications, and rule out other potential causes [14]. Suspicious symptoms of IC that may be detected during an abdominal CT (plain scan) examination include intestinal wall edema and thickening, intestinal lumen stenosis, and intestinal dilation [1]. Among the 118 patients with IC included in this study, 74 (62.7%) exhibited suspicious symptoms of intestinal ischemia on abdominal CT (plain scan). The OR value for this independent predictor was 21.439, highlighting the important role of abdominal CT (plain scan) examination in the diagnosis of IC. Furthermore, the study findings indicated that elevated neutrophil counts independently predict IC, which is a new finding. Previous studies have not identified which laboratory parameters predict the occurrence of IC. We consider that the cause of elevated neutrophil counts may be related to the inflammatory response triggered by hypoxia and necrosis of intestinal tissues during IC.
The model established in this study included a small sample size and several influencing factors, most of which are binary variables. Therefore, LASSO regression was used to screen factors when constructing the model. LASSO regression is a compressed estimation method that reduces the variable set by constructing a penalty function. It compresses the coefficients of the variables, causing some regression coefficients to become 0, thereby achieving the goal of variable selection [11, 12]. We identified seven predictors in the LASSO regression model and then used conventional logistic regression for modeling and verification. The model was visually represented using a nomogram, which provides an intuitive graphic display. The scores of each factor were aggregated to calculate a total score, which was then compared with the probability of diagnosis. Figure 2 demonstrates that a total score of 56 points in this model indicates a probability of over 90% for IC diagnosis. The model underwent internal verification and exhibited high discrimination and accuracy, making it clinically valuable. However, it is important to note that this study has limitations as it was a single-center retrospective observational study. Therefore, the predictive performance of the model may not be generalizable to other populations, races, ethnicities, and regions. To mitigate bias, future studies could consider conducting multi-regional and multi-center sample selection, if feasible.
As a quantitative tool for risk and benefit assessment, clinical diagnosis prediction models can offer physicians and patients more intuitive and rational information to aid in decision-making. Because IC is challenging to diagnose, misdiagnosis or missed diagnosis can seriously impact patient prognosis. Currently, there is a lack of sufficient research on the diagnosis and prediction of this disease. Hence, the findings of this study hold practical value for frontline medical workers and patients with IC. It is anticipated that this diagnostic prediction model can be tested and proven effective in clinical practice.
Through the establishment of a diagnostic prediction model for IC, it is evident that patients presenting with constipation accompanied by symptoms of hematochezia, an increase in neutrophil counts on laboratory testing, and findings of intestinal wall edema and thickening, intestinal stenosis, and intestinal dilation on abdominal CT scans (plain scan) should be clinically examined for possible IC. The diagnostic prediction model of IC (Figure 2) can be used to predict the probability of IC, enabling early intervention and prevention of disease progression in patients.
5 CONCLUSIONS
According to our findings, constipation, hematochezia, neutrophils, and abdominal CT (plain scan) indicating intestinal wall edema and thickening, intestinal lumen stenosis, and intestinal dilation were identified as independent predictors of IC. Based on these variables, we developed a simple clinical prediction model to estimate the probability of IC. However, it is important to note that our results require external validation before the developed model can be applied in clinical practice.
AUTHOR CONTRIBUTIONS
Chonghui Hu: Data curation (lead); writing – original draft (lead). Xiuying Zhao: Supervision (equal). Bo Jiang: Methodology (lead); supervision (supporting). Xuan Jiang: Supervision (supporting). Yutang Ren: Methodology (supporting); supervision (supporting). Jiaojiao Guo: Resources (supporting).
ACKNOWLEDGMENTS
We express our gratitude to Dr. Puzheng Wen and Dr. Pu Zeng for their invaluable data support in the context of this study.
CONFLICT OF INTEREST STATEMENT
The authors declare no conflicts of interest.
ETHICS STATEMENT
The study protocol was approved by the Ethics Committee of Beijing Tsinghua Changgung Hospital (approval number 23638-6-01).
INFORMED CONSENT
Informed consent was waived owing to the retrospective nature of the study and anonymity of the clinical data.
Open Research
DATA AVAILABILITY STATEMENT
The data that support the findings of this study are available on request from the corresponding author. The data are not publicly available due to privacy or ethical restrictions.


