Spatio-temporal analysis of snow depth and snow water equivalent in a mountainous catchment: Insights from in-situ observations and statistical modelling
Abstract
This research, conducted in the mountainous catchment near Abant Lake in the Western Black Sea region of Türkiye, aimed to investigate the spatiotemporal variations of snow depth (SD) and snow water equivalent (SWE) throughout the snow season from December 2019 to March 2020, encompassing both accumulation and melting periods. In total, 14 snow surveys were conducted, covering 58 permanent snow measurement points (PSMP) marked with snow poles. The classification and regression tree (CART) method was employed to statistically analyse their relationships with eight variables: snow period, forest canopy, aspect, slope, elevation, slope position, plan and profile curvature. The root mean square error (RMSE) for SD and SWE was determined to be 0.15 m and 46 mm, respectively. The study findings revealed that mean SD and SWE values were higher in forest gaps compared with under-forest and open areas. Although the snow cover disappeared earliest in under-forest areas, the melting rate was observed to be 43% and 17% slower compared with forest gaps and open areas, respectively. Wind redistribution resulted in minimum snow accumulation on western aspects, upper slope positions and ridges, while maximum accumulation was observed on southern aspects, valleys and lower slope positions. Higher elevations (>1580 meters) experienced faster snow melting rates, leading to earlier disappearance of snow cover. PSMPs located on slopes with lower degrees (<15°) exhibited lesser accumulation and earlier snow disappearance. The CART model identified the snow period as the most significant factor in predicting SD and SWE, based on variations in snowfall and air temperature. Other significant variables included forest canopy, aspect and elevation. The study suggests that the CART method is well-suited for modelling complex snow dynamics, providing valuable insights into spatiotemporal variations in SD and SWE in mountainous regions.
1 INTRODUCTION
Monitoring and analysing spatio-temporal changes in snow cover properties and their interactions with specific topographical, climatic and forest-related variables are valuable across various disciplines. However, conducting measurements and statistical analysis to understand these interactions poses challenges due to their intricate nature. This study investigates the variables significantly impacting snow accumulation/depth (SD), snow-water equivalent (SWE) and melting rate, considering temporal variations in a mountainous watershed. It particularly focuses on topographical and forest-related variables such as elevation, slope, aspect and forest canopy (Anderton et al., 2004; Boon, 2012; Clark et al., 2011; Dickerson-Lange et al., 2017; Duyar, 2018; Hubbart et al., 2015; Jeníček et al., 2017; Jost et al., 2007; Molotch et al., 2005; Revuelto et al., 2015; Rice et al., 2011; Roth & Nolin, 2017; Schelker et al., 2013; Varhola et al., 2010; Veatch et al., 2009; Zheng et al., 2016). Elevation, as a crucial topographic factor, significantly influences snow accumulation and melting processes due to its effects on air temperature, wind speed and precipitation, all of which change with altitude (Anderton et al., 2004). Typically, higher elevations experience greater snow accumulation, particularly in regions with lower vegetation density (Duyar, 2018; Hubbart et al., 2015; Jost et al., 2007; Roth & Nolin, 2017). The slope variable, as another critical topographic factor, plays a pivotal role in both snow accumulation and redistribution, as well as in the stability of the snow cover. When considered alongside aspect, another topographic variable, slope becomes crucial in influencing melting rates due to variations in solar radiation, which are contingent upon slope degrees (Anderton et al., 2004; Varhola et al., 2010). Aspect influences sublimation scales/levels based on the intensity of solar radiation and the duration of insolation during the accumulation period. Consequently, the melting rate and SWE during the melting period are impacted by slope and aspect variables (Molotch et al., 2005; Varhola et al., 2010). Additionally, wind speed and direction, as climatic variables, play crucial roles in analysing snow dynamics (Anderton et al., 2004; Currier & Lundquist, 2018; Hojatimalekshah et al., 2021; Murray & Buttle, 2003; Roth & Nolin, 2017; Varhola et al., 2010; Woods et al., 2006). As highlighted by Pomeroy et al. (1997), wind plays a primary role in reducing snow accumulation by redistributing it, particularly in open areas, and accelerating melting rates during the melting period. Since energy primarily drives snowmelt, the process is highly sensitive to local and short-term changes in weather systems (Varhola et al., 2010). Lundquist et al. (2004) observed the simultaneous melting of snow across 70% of the study area due to an anomalous temperature rise of 12°C within just 5 days in a study conducted in California. Furthermore, their findings indicated that abnormal temperature increases have a more significant impact on the snow melting process compared with other factors such as elevation, aspect and forest cover.
Indeed, while the interactions between forest cover and snow dynamics have been extensively studied in the past, recent research in this area has gained momentum, particularly with emerging concerns about the potential impacts of climate change. Presently, there is a heightened focus on understanding how snow dynamics may interact with various variables in the context of changing climate conditions. Researchers aim to predict potential future variations in snow cover based on different climate change scenarios. This evolving research direction reflects a critical need to anticipate and mitigate the potential consequences of climate change on snow dynamics and associated ecosystems. Studies on the interactions between forest cover and snow dynamics consistently demonstrate that an increase in forest canopy cover leads to enhanced snow interception, consequently reducing snow accumulation on the ground (Hojatimalekshah et al., 2021; Jenicek et al., 2018; Revuelto et al., 2015; Roth & Nolin, 2017; Varhola et al., 2010). Moreover, the presence of canopy cover diminishes solar radiation and wind speed, resulting in reduced rates of snowmelt compared with open areas and/or forest clearings (Hubbart et al., 2015; Jost et al., 2007; Sanmiguel-Vallelado et al., 2020; Stevens, 2017; Winkler et al., 2015).
As forest cover decreases, more spatial variations and differences in snow dynamics are observed. The main drivers of these variations and differences are generally the level of canopy closure and the areal size of the clearings or clear-cuts, which are crucial for determining whether they are sheltered by the surrounding forests (Altunkaynak & Aydın, 2012; Duyar, 2018; Golding & Swanson, 1986; Hubbart et al., 2015; Jost et al., 2007; Murray & Buttle, 2003; Roth & Nolin, 2017; Schelker et al., 2013; Veatch et al., 2009). Due to the lack of shelter in larger open areas and clearings, there is lower snow interception, rendering these areas more vulnerable to higher sublimation losses owing to exposure to intense solar radiation and wind. Moreover, snow redistribution by wind further diminishes snow accumulation and SWE in such areas (Clark et al., 2011; Currier & Lundquist, 2018; Dickerson-Lange et al., 2017; Murray & Buttle, 2003; Pomeroy et al., 2002; Roth & Nolin, 2017; Woods et al., 2006). Consequently, more snow accumulation and higher SWE can be expected in medium-sized clearcuts (Varhola et al., 2010; Veatch et al., 2009).
While forest canopy is indeed a significant variable, it alone cannot fully explain snow dynamics from all perspectives. The amount of snowfall can also influence the effect of forest canopy and clearings on SD and SWE (Boon, 2009; Jost et al., 2007; Lundquist et al., 2013; Revuelto et al., 2015; Varhola et al., 2010). The impact of snowfall on SD and SWE is closely linked to interception rates, which depend on the storage capacity of the forest canopy. During periods of high snowfall in a season, tree branches may not be able to support snow loads indefinitely. If the snow load exceeds the threshold that branches can withstand, the snow-holding capacity of the forest canopy diminishes (Boon, 2012). Additionally, forest stand types become more influential on snow parameters when snowfall amounts drop below the annual average.
As previously discussed, snow parameters are influenced by numerous drivers in a complex manner, making their field measurement and statistical analysis challenging. The primary difficulties stem from the need to continuously sample and measure these parameters spatially and accurately at frequent time intervals while minimizing risks for surveyors (Egli et al., 2012; Grünewald et al., 2010; Lehning et al., 2008; Schweizer et al., 2008). In situ measurement methods, such as snow surveys, snow pads and snow pits, are commonly used to obtain snow parameters. While these methods offer precise and accurate data, they are also risky, labor-intensive, time-consuming and costly, particularly in large and high-altitude mountainous areas, where they may struggle to fully represent the catchment in all its aspects (Deems et al., 2013; Hill et al., 2019; Jaakkola et al., 2014; Luzi et al., 2009; Miziński & Niedzielski, 2017; Vander Jagt et al., 2015). Nevertheless, in situ measurements remain crucial, especially for snow parameters like SWE, which is a key variable in snow hydrology (Harder et al., 2016, 2020).
In recent studies, the regression tree method, also known as CART (classification and regression tree), has been commonly employed for the statistical analysis of snow parameters such as SD and SWE along with related predictors (Anderton et al., 2004; Erxleben et al., 2002; Hojatimalekshah et al., 2021; Molotch et al., 2005; Musselman et al., 2008; Wetlaufer et al., 2016). As the snow data were not normally distributed, the CART method developed by Breiman et al. (1984) was employed in the present study to analyse the interactions of SD and SWE with the selected variables. The regression tree is constructed through a two-stage procedure: (i) the dataset is successively split into smaller sub-groups by binary recursive partitioning based on different predictors, and (ii) the full tree is pruned using cross-validation (Therneau & Atkinson, 1997). CART is a decision tree-based technique that simplifies complex datasets into visually interpretable graphs, highlighting significant predictors in the model. This method is advantageous as it ensures reliable results even in datasets with intricate relationships. The present study, conducted in a mountainous catchment near Abant Lake in the Western Black Sea region of Türkiye, aimed to explore spatio-temporal variations of SD, SWE and melting rate, focusing on their relationships with forest canopy and topographic characteristics. The catchment consisted partly of coniferous forests with varying canopy closures. In situ measurements of both SD and SWE were conducted at permanent snow measurement points (PSMPs), randomly distributed but ensuring representation of catchment characteristics including coniferous forest, forest gaps and open areas. In situ measurements were performed throughout the entire snow season, covering both accumulation and melting periods, with varying time intervals, approximately weekly, depending on weather conditions. SD and SWE data were analysed using the non-parametric statistical method CART, and the importance of selected predictors was determined.
2 MATERIALS AND METHODS
2.1 Study area
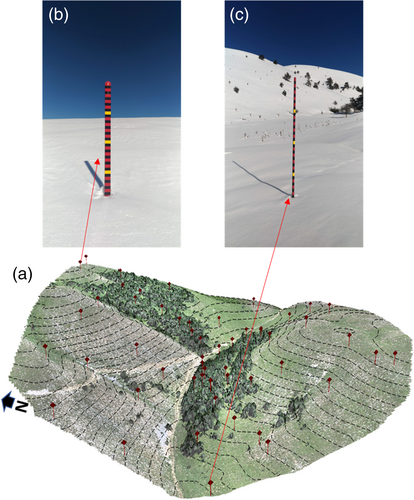
The study area, depicted in Figures 1 and 2, showcases the picturesque landscape of Bolu Abant Lake National Park (40°35′25″–41°35′50″N and 31°15′13″–31°15′57″ E). The figures offers a visual representation of the catchment's layout, delineating the intricate interplay between forested and open areas. Spanning 71 hectares, the area comprises 11 hectares of coniferous forest and 60 hectares of open terrain. Scotch pine (Pinus sylvestris L.) trees predominantly populate the forested regions. Additionally, a small number of beech trees (Fagus orientalis Lipsky) are scattered, particularly on the north-facing slopes with gentler gradients. The general data regarding the canopy closure and stand types of the forest in the study catchment were obtained from the General Directorate of Forestry of Türkiye. The coniferous forests primarily consist of mature trees, approximately 60–80 years old, with a canopy closure ranging from 41% to 70%. Sparse meadow grasses cover much of the catchment ground, while patches of dwarf juniper (Juniperus communis L.) species dot the landscape.
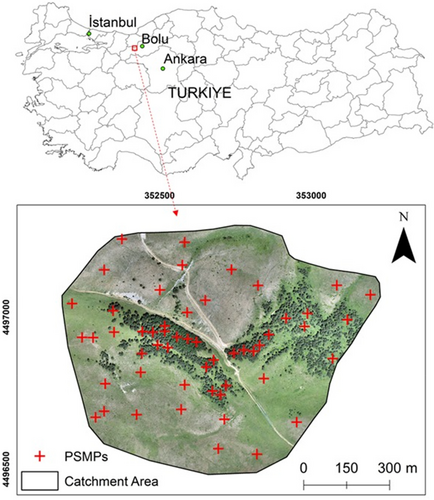
The topographic characteristics of the catchment, including elevation, slope and aspect, were derived from a digital elevation model (DEM) with a spatial resolution of 5 m. This DEM was generated from overlapping images acquired during a UAV (unmanned aerial vehicle) flight conducted during the snow-free period. Slope and aspect data were computed using Esri ArcGIS 10.8 software. The slope values ranged from 0° to 61°, with an average slope of 21°. Based on the slope data, approximately 33% of the catchment area had slope values lower than 15°, while 63% had slope values ranging between 15° and 30°. The remaining portion of the catchment had slope values exceeding 30°. Elevation data indicated a range from 1440 m above sea level (m a.s.l) to 1660 m a.s.l, with an average elevation of 1555 m a.s.l.
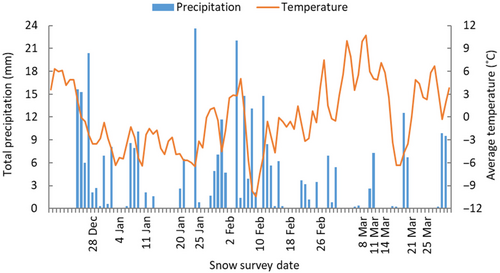
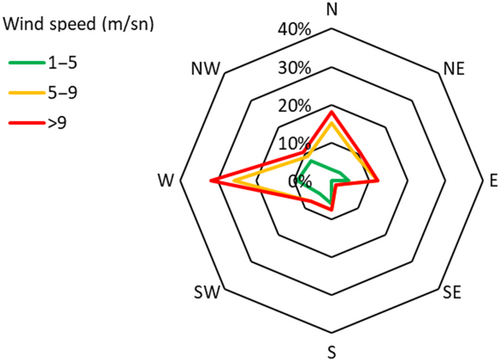
For the present study, two meteorological stations operated by the Turkish State Meteorological Service (TSMS) were considered. The closest station, named Abant Lake, is situated at an altitude of 1365 m above sea level (m a.s.l) and is approximately 1.5 km away from the study area. This station records temperature, humidity and precipitation data. Figure 3 illustrates the daily total precipitation and average temperature values recorded by this station for the period spanning December 2019 to March 2020. The second station, known as Mudurnu, provides wind data and is located approximately 11 km from the study area at an altitude of 785 m a.s.l. According to data from this station, strong winds during the study period predominantly originated from the west and north directions, as depicted in Figure 4. Field observations conducted during the study period corroborated these prevailing wind directions as indicated by the station data.
2.2 Data collection and analysis
In situ measurements of SD and SWE were conducted through a total of 14 snow surveys during the snow season from December 2019 to March 2020 (Table 1). The first six snow surveys, conducted from December 28 to February 2, captured the initial accumulation period. These surveys aimed to assess the significance of forest canopy and topographic factors in spatio-temporal variations in SD and SWE accumulation, influenced by new snowfalls and snow interception. Subsequently, the last five snow surveys, conducted from March 8 to March 25, represented the melting period. These surveys aimed to examine the importance of forest canopy and topographic factors in snowmelt and snow disappearance time, driven by high air temperature and solar radiation. Mean SWE values during the maximum accumulation period (February 10–February 26) were considered to determine the spatio-temporal variation in average melting rate and snow disappearance time.
| Snow survey date | Number of SD observation | Number of SWE observation |
|---|---|---|
| 28-Dec-19 | 48 | 48 |
| 4-Jan-20 | 54 | 40 |
| 11-Jan-20 | 57 | 51 |
| 20-Jan-20 | 56 | 55 |
| 25-Jan-20 | 58 | 57 |
| 2-Feb-20 | 55 | 52 |
| 10-Feb-20 | 57 | 39 |
| 18-Feb-20 | 58 | 51 |
| 26-Feb-20 | 58 | 50 |
| 8-Mar-20 | 58 | 58 |
| 11-Mar-20 | 58 | 58 |
| 14-Mar-20 | 58 | 57 |
| 21-Mar-20 | 58 | 43 |
| 25-Mar-20 | 58 | 58 |
| Total | 791 | 717 |
- Note The number represents the number of poles that could be visited in each survey period depending on weather and field conditions.
For each of the snow surveys, in situ SD measurements were manually conducted by the individuals visiting each designated pole. These measurements were recorded for a total of 58 PSMPs where snow poles were installed. Specifically, 18 poles were situated under forested areas, 14 in forest gaps and 26 in open areas. The snow poles were marked with different colours (black and red) at 5 cm intervals, with additional 50 cm sections marked in yellow on each pole to facilitate quick measurements of SD (Figure 2). Given that SDs were recorded as integers (e.g., 50 cm rather than 50.1 cm), the observational error was assumed to be less than 1 cm for this study. SWE measurements were taken at locations closest to the snow poles, where the snow cover remained undisturbed. This was accomplished using a 1-m cylindrical PVC pipe with a diameter of 7.2 cm. SWE was calculated by multiplying the snow density by its depth, measured meticulously using a wooden ruler. Snow density was determined by weighing snow samples collected with the cylindrical PVC pipe. Throughout the study period, a total of 791 SD and 717 SWE measurements were carried out, which were subsequently utilized in the CART analysis. These measurements were conducted based on prevailing weather and snow conditions in the area, as detailed in Table 1.
- Snow periods, classified as initial accumulation, maximum accumulation and melting.
- Forest canopy types, classified as under-forest, forest gaps and open areas.
- Aspects, including six directions (except NW and SE).
- Elevation (m a.s.l), classified into three different ranges representing different elevation categories.
- Slope in degrees, categorized into three classes.
- Slope positions, classified into five classes.
- Plan curvature.
- Profile curvature, classified as convex, flat and concave (Table 2).
| Variable | Number of classes | Categorized class | Number of samples for SD | Mean SD (m) (std. deviation) | Number of samples for density and SWE | Mean SWE (mm) (std. deviation) |
|---|---|---|---|---|---|---|
| Snow period | 3 | Initial accumulation | 328 | 0.30 (0.13) | 303 | 69.3 (37.6) |
| Maximum accumulation | 173 | 0.59 (0.29) | 140 | 140.8 (68.6) | ||
| Melting | 290 | 0.09 (0.13) | 274 | 30.2 (50.9) | ||
| Forest canopy | 3 | Under forest | 247 | 0.23 (0.20) | 214 | 48.3 (45.2) |
| Forest gaps | 195 | 0.42 (0.29) | 184 | 100.1 (72.0) | ||
| Open areas | 349 | 0.25 (0.25) | 319 | 63.4 (62.8) | ||
| Elevation (m a.s.l.) | 3 | 1440–1510 | 230 | 0.33 (0.26) | 199 | 78.9 (66.9) |
| 1510–1580 | 373 | 0.28 (0.25) | 342 | 63.8 (59.0) | ||
| 1580–1660 | 188 | 0.26 (0.26) | 176 | 65.1 (68.3) | ||
| 3 | 1440–1500 | 202 | 0.32 (0.26) | 171 | 76.3 (66.0) | |
| 1500–1600 | 511 | 0.27 (0.25) | 471 | 62.7 (59.7) | ||
| 1600–1660 | 78 | 0.33 (0.30) | 75 | 85.5 (78.6) | ||
| 2 | 1440–1550 | 505 | 0.30 (0.25) | 445 | 70.2 (62.0) | |
| 1550–1660 | 286 | 0.27 (0.27) | 272 | 65.2 (66.8) | ||
| Aspect (direction) | 6 | N | 289 | 0.33 (0.26) | 250 | 78.7 (65.1) |
| NE | 136 | 0.26 (0.24) | 124 | 59.9 (57.2) | ||
| E | 27 | 0.28 (0.25) | 24 | 60.8 (57.7) | ||
| S | 95 | 0.33 (0.31) | 92 | 80.4 (77.1) | ||
| SW | 120 | 0.27 (0.25) | 112 | 61.8 (58.1) | ||
| W | 124 | 0.22 (0.24) | 115 | 53.0 (58.5) | ||
| Slope (°) | 3 | <15 | 123 | 0.20 (0.23) | 114 | 52.8 (60.7) |
| 15–25 | 477 | 0.31 (0.27) | 436 | 73.7 (66.1) | ||
| >25 | 191 | 0.29 (0.25) | 167 | 64.9 (58.2) | ||
| Slope position | 5 | Valley | 68 | 0.34 (0.25) | 63 | 83.4 (67.4) |
| Lower slope | 42 | 0.42 (0.26) | 40 | 99.2 (61.5) | ||
| Middle slope | 519 | 0.29 (0.26) | 470 | 66.5 (62.5) | ||
| Upper slope | 96 | 0.24 (0.25) | 86 | 61.2 (64.9) | ||
| Ridge | 66 | 0.22 (0.24) | 58 | 56.3 (64.1) | ||
| Plan curvature | 3 | Convex | 556 | 0.27 (0.25) | 497 | 63.4 (61.1) |
| Flat | - | - | - | - | ||
| Concave | 235 | 0.33 (0.28) | 220 | 79.5 (68.5) | ||
| Profile curvature | 3 | Convex | 329 | 0.24 (0.24) | 293 | 58.1 (58.6) |
| Flat | 67 | 0.28 (0.26) | 64 | 68.0 (61.9) | ||
| Concave | 395 | 0.33 (0.27) | 360 | 76.7 (67.1) |
In the CART method, elevation and slope were treated as real values. The CART analysis utilized the “rpart” (recursive partitioning and regression trees) package in the R statistical software (Version 4.3.2). The “rpart” package allows the construction of classification or regression models of a general structure, representing the model results as binary trees (Therneau & Atkinson, 1997). The optimal tree size, that is, the number of terminal nodes, for both prediction models was determined by pruning to the complexity parameter value at which the nodes added to the tree no longer substantially reduced the 10-fold cross-validated error. In the CART method, 70% of the dataset was used for training, and the remaining 30% for validating the model. After optimizing the model's structure to enhance prediction accuracy, we applied it to predict SD across the entire study area for the maximum accumulation period. To do this, we first converted each of the eight environmental parameters from their original raster format into CSV files, ensuring compatibility with the model's input requirements. These CSV files contained geospatial data, representing the spatial distribution of each parameter across the catchment. With this input data, the CART model generated predicted SD values. Following model execution, we converted the resulting predictions from CSV back into raster format to create a comprehensive SD map.
3 RESULTS
3.1 Temporal variation of SD and SWE in the catchment
Within the study area, snow accumulation commenced on 25 December 2019, with the melting process initiating on 27 February, 2020, coinciding with an average daily temperature of 8°C. Despite subsequent snowfall events after the end of February, the rise in air temperature and solar radiation prompted the disappearance of the snow cover in the majority of the catchment area by the end of March. On 25 March 2020, only a partial snow patch remained unmelted on the north-facing lower slope. While there was an increase in SD over time due to new snowfalls during the accumulation period, there were also decreases due to melting and compression processes. The mean highest value of SD (77 cm) in the catchment was recorded immediately after heavy snowfall on 10 February 2020 (Figure 5).
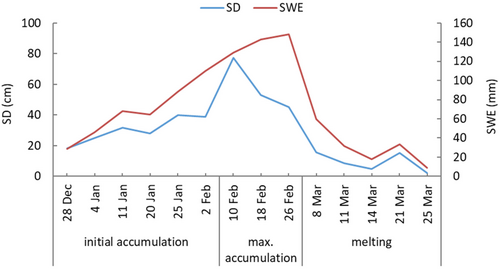
During the accumulation period, the mean snow density in the catchment was 0.16 g/cm3 on 28 December 2019, and increased to 0.32 g/cm3 on 26 February 2020. The maximum snow density was measured during the melting period, reaching 0.48 g/cm3 on 8 March 2020. Initially, deeper snow cover exhibited a low SWE value due to the low snow density at the beginning of the accumulation period. However, the SWE of shallow snow covers increased compared with earlier stages due to higher snow density resulting from compaction and melting processes in subsequent periods. The mean SWE value of the catchment increased from 28 December 2019, and peaked at its maximum value (148 mm) on 26 February 2020.
3.2 Temporal variation of SD and SWE in relation to forest canopy
During the initial accumulation period, the mean SD value for under-forest and open areas was found to be similar, while the mean SD value for forest gaps was approximately 45% higher than those. Similarly, the mean SWE value for forest gaps was found to be 39% and 23% higher than under-forest and open areas, respectively, during this period. In contrast, for the maximum accumulation period, the mean SD value for forest gaps was found to be 81% and 60% higher than under-forest and open areas, respectively, while the mean SWE value was found to be 95% and 61% higher, respectively. Notably, compared with the initial accumulation period, the SD and SWE values for forest gaps increased more than 2 times during the maximum accumulation period (Figure 6). Additionally, the SD and SWE values for forest gaps and open areas exhibited a tendency to increase in the snow surveys for the maximum accumulation period, while they increased only slightly for under-forest areas. Although some of the lowest SD and SWE values were measured at certain PSMPs in open areas during the accumulation periods, the mean SD and SWE values for under-forest areas were found to be lower than in open areas. Overall, for the entire accumulation period, the mean SD values for under-forest, open areas and forest gaps were found to be 34, 37 and 54 cm, respectively. Similarly, the mean SWE values for under-forest, open areas and forest gaps were measured at 72, 88 and 120 mm, respectively.
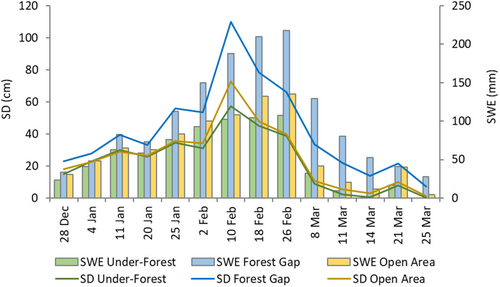
While the snow cover in under-forest areas disappeared on 25 March 2020, with an average daily melting rate of 3.8 mm/day, snow cover was still present in forest gaps and open areas. Up until this date, the average daily melting rates in forest gaps and open areas were found to be 6.8 and 4.7 mm/day, respectively. Despite this, a considerable portion of the SWE values had melted, with 87% and 97% of the SWE values melted in forest gaps and open areas, respectively.
3.3 Temporal variation of SD and SWE in relation to aspect
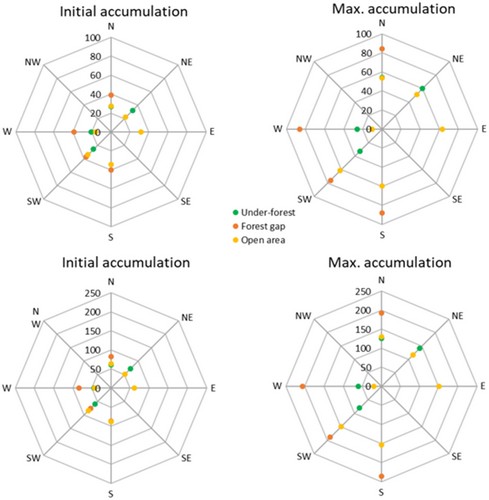
The smallest discrepancies in SD and SWE values for forest gaps were noted across all aspect directions during the accumulation periods. Greater snow accumulation was evident under the forest canopy on northern and northeastern aspects compared with other directions. Conversely, SD and SWE values for open areas displayed variations among the aspects, with the lowest values observed on the western aspect (Figure 7). This discrepancy likely stemmed from prevailing westerly winds redistributing snow cover within open areas on the western aspect. Additionally, SD and SWE values in open areas on the western and northeastern aspects were lower than those under forest canopy cover.
Due to the influence of wind, the lowest mean SD and SWE values for the accumulation period were observed on the western aspects, while the highest mean values were recorded on the southern aspect (Table 3). Snow cover on the southwestern aspect vanished on 11 March 2020, with an average daily melting rate of 6.7 mm/day. By this date, a total of 98% of the SWE value had melted on the southern aspect. Three days later, snow cover disappeared on aspects facing east, south and west. However, snow persisted on northern and northeastern aspects until 25 March 2020, albeit a significant portion of the SWE values (86% and 99%, respectively) had melted by that time.
| Aspect | SD (cm) | SWE (mm) | ||||||||
|---|---|---|---|---|---|---|---|---|---|---|
| Initial accumulation | Max. accumulaion | Mean | Initial accumulation | Max. accumulaion | Mean | |||||
| Mean | Max. | Mean | Max. | Mean | Max. | Mean | Max. | |||
| Northern | 31 | 40 | 64 | 78 | 42 | 69 | 114 | 151 | 165 | 92 |
| Northeastern | 27 | 35 | 56 | 70 | 37 | 62 | 95 | 128 | 146 | 85 |
| Eastern | 32 | 40 | 63 | 100 | 41 | 60 | 108 | 151 | 162 | 85 |
| Southern | 37 | 54 | 72 | 104 | 49 | 88 | 154 | 188 | 196 | 121 |
| Southwestern | 32 | 43 | 57 | 81 | 41 | 76 | 103 | 137 | 147 | 97 |
| Western | 31 | 34 | 42 | 55 | 32 | 59 | 91 | 103 | 111 | 74 |
3.4 Temporal variation of SD and SWE in relation to elevation
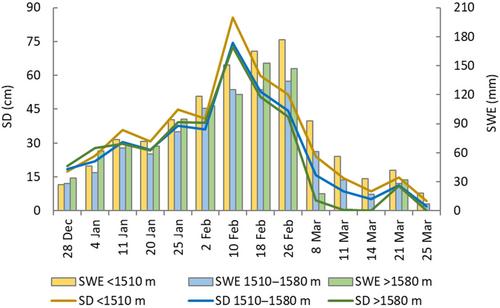
The elevation of PSMPs ranged from 1440 to 1660 m (a.s.l). Notably, the highest elevation is approximately 1600 m on the northern aspect and 1660 m on the southern aspect, with no forest cover at these elevations. Due to northerly winds prevailing in open areas, snow accumulation occurred at the higher elevations of the southern aspect, whereas redistribution of snow was observed at the higher elevations of the northern aspect. Consequently, variations in mean SD and SWE values depended on the elevation range considered during the accumulation periods. For instance, when areas above 1600 m (a.s.l) represented the high elevation class, the mean SD and SWE values at these elevations were higher than those in the middle (1500–1600 m) and low (<1500 m) elevation classes. The melting rate for low, middle and high elevation classes was 5.7, 4.4 and 9.3 mm/day, respectively. Conversely, when areas above 1580 m (a.s.l.) constituted the high elevation class, including the high elevations on the northern aspect, the mean SD and SWE values at high (>1580 m) and middle (1510–1580 m) elevation classes were lower than those in the low (<1510 m) elevation class (Figure 8). Based on this elevation classification, the melting rate for the low, middle and high elevation classes was 8.6, 7.3 and 10.4 mm/day, respectively. When elevation was categorized into two classes (<1550 and >1550 m), the SD and SWE values of the classes were similar. Consequently, based on three different elevation classifications, snow cover at the high elevation classes disappeared earliest.
3.5 Temporal variation of SD and SWE in relation to slope
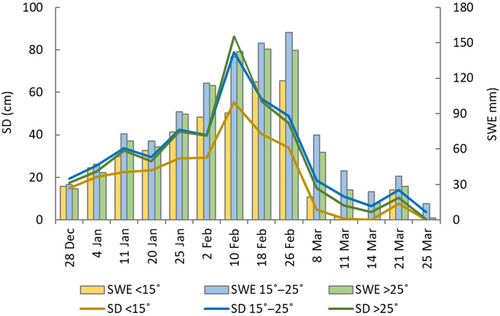
The slope of the PSMPs ranged from 10° to 38°. PSMPs with slope values between 0° and 15° were situated in open areas around hills and ridges. During the initial accumulation period, the mean SD and SWE values for this slope class were approximately 25% and 15% lower than those for the medium (15°–25°) and high slope classes (>25°), respectively (Figure 9). This discrepancy increased to over 30% for SD and over 25% for SWE during the maximum accumulation period. Throughout the accumulation period, the mean SD values for the slope classes, ranging from low to high, were 30, 42 and 42 cm, respectively, while the SWE values were 78, 95 and 92 mm, respectively.
The snow cover in the low slope class disappeared on 14 March 2020, with an average daily melting rate of 6.9 mm/day. However, it persisted in the medium and high slope classes until 25 March 2020. By this date, a total of 91% and 99% of the SWE values had melted in the medium and high slope classes, respectively.
3.6 Temporal variation of SD and SWE in relation to slope positions
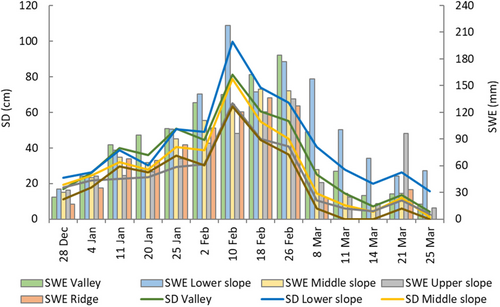
Significant variations in SD and SWE were observed for different slope positions in both the accumulation and melting periods (Figure 10). During the initial accumulation period, lower snow accumulation was observed on the ridge and upper slope positions, whereas higher snow accumulation was noted on the valley bottom and lower slope positions. In the maximum accumulation period, the SD and SWE values for the lower slope positions showed a greater increase compared with other positions, reaching the highest values. Conversely, the upper slope positions had the lowest mean SD and SWE values for the accumulation period (Table 4).
| Slope position | SD (cm) | SWE (mm) | ||||||||
|---|---|---|---|---|---|---|---|---|---|---|
| Initial accumulation | Max. accumulation | Mean | Initial accumulation | Max. accumulation | Mean | |||||
| Mean | Max. | Mean | Max. | Mean | Max. | Mean | Max. | |||
| Valley | 36 | 51 | 65 | 81 | 46 | 88 | 131 | 166 | 184 | 109 |
| Lower slope | 36 | 51 | 80 | 100 | 51 | 76 | 140 | 174 | 217 | 107 |
| Middle slope | 31 | 41 | 60 | 79 | 41 | 70 | 111 | 141 | 146 | 92 |
| Upper slope | 25 | 31 | 50 | 65 | 33 | 58 | 85 | 119 | 135 | 79 |
| Ridge | 26 | 36 | 48 | 63 | 34 | 66 | 102 | 128 | 136 | 84 |
The snow cover on the ridges disappeared on 11 March 2020, with an average daily melting rate of 6.2 mm/day. However, on the other slope positions, the snow cover persisted until 25 March 2020. By this date, a total of 70% of the SWE value was melted on the lower slope position, whereas more than 90% of the SWE value on the other slope positions was melted.
3.7 Temporal variation of SD and SWE in relation to curvatures
In the study, both plan and profile curvature were categorized into three classes: concave, flat and convex. In both accumulation periods, the mean SD and SWE values were higher on concave-shaped surfaces than on convex-shaped surfaces for both plan and profile curvature. Specifically, during the accumulation period, the mean SD values for both concave and convex-shaped surfaces were 46 and 38 cm for plan curvature, and 45 and 34 cm for profile curvature, respectively. Similarly, the mean SWE values for concave and convex-shaped surfaces were 107 and 85 mm for plan curvature, and 101 and 80 mm for profile curvature, respectively. Melting rates for concave and convex surfaces for both plan and profile curvatures were approximately 5.9 and 4.5 mm/day, respectively. The snow cover persisted on both surfaces until 25 March 2020, with about 95% of the SWE values melted in total for concave and convex surfaces in both plan and profile curvatures.
3.8 CART analysis
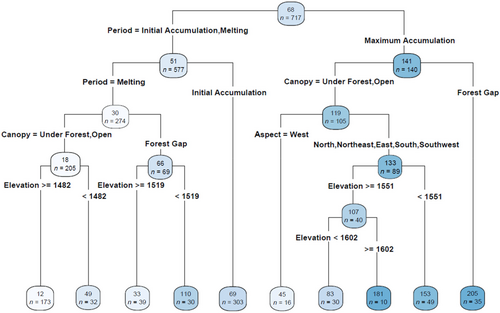
Due to the collinearity between SD and SWE, SD data were excluded from the CART analysis for the SWE prediction model. The optimal trees generated for both SD and SWE prediction comprised nine internal nodes and 10 terminal nodes. The outcomes of the CART method for SD and SWE analysis are depicted in Figures 11 and 12. The results highlighted that the snow period was identified as the most significant factor for both SD and SWE models. Following this, forest canopy emerged as the second most important factor for both prediction models. Additionally, aspect and elevation were found to be significant factors, albeit with lower importance. The root mean square error (RMSE) values for the CART models were calculated as 0.15 m for SD and 46 mm for SWE.
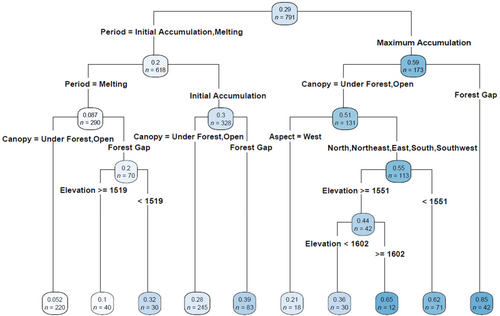
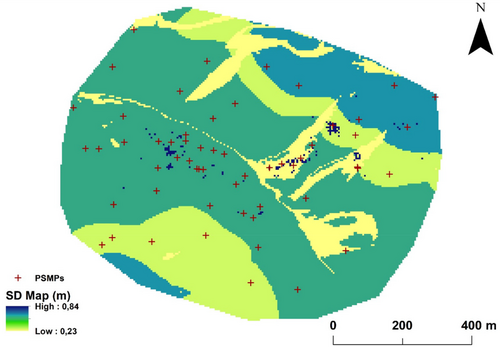
In both the SD and SWE regression trees, the initial split is based on the snow period. Across all snow periods, SD values in forest gaps consistently exceeded those in under forest and open areas. This trend was also observed in the SWE regression model, except for the initial accumulation period. During the melting period, SD values decreased solely in forest gaps in correlation with elevation increase, while SWE values decreased across all forest canopy classes with rising elevation. Furthermore, SD and SWE values in the maximum accumulation period were approximately double those observed in the initial accumulation period. Specifically, in the maximum accumulation period, SD and SWE values on the western aspect were lower compared with other aspect directions for under forest and open areas. In contrast, on other aspect directions, the highest SD and SWE values were recorded at elevations above 1602 m, while the lowest values were observed at elevations ranging from 1551 to 1602 m (Figures 11 and 12). The SD map of the catchment produced for the maximum accumulation period using the regression tree is shown in Figure 13.
4 DISCUSSION
Snow accumulation is primarily characterized by the maximum SWE value observed on the ground before the snow begins to melt (Varhola et al., 2010). Hence, in situ measurements taken before March were categorized into the accumulation period, while those taken in March were designated as part of the melting period, given the higher observed melting rates compared with accumulation rates. A study conducted in a region proximate to our study area reported a rapid decline in both SD and SWE values beginning in March (Duyar, 2018).
Findings from similar research indicate that forest canopy, aspect and elevation significantly influence the spatial distribution of SD, SWE and melting rate (Clark et al., 2011; Duyar, 2018; Hubbart et al., 2015; Jost et al., 2007; Murray & Buttle, 2003; Rice et al., 2011; Roth & Nolin, 2017; Veatch et al., 2009). In this study, lower SD, SWE and melting rates were observed for under-forest areas compared to both open areas and forest gaps. This aligns with other studies that have found reduced SD and SWE values in forested areas with high canopy cover compared with those with low canopy cover (Duyar, 2018; Roth & Nolin, 2017). Similarly, our findings suggest that forest canopy contributes to losses through interception and sublimation by retaining snow (Boon, 2012; Dickerson-Lange et al., 2017; Huerta et al., 2019; Jenicek et al., 2018; Murray & Buttle, 2003; Pomeroy et al., 2002; Revuelto et al., 2015; Roth & Nolin, 2017; Schelker et al., 2013; Varhola et al., 2010).
Both SD and SWE values were observed to be higher for forest gaps compared with those for open areas located away from the forest. This phenomenon can be attributed to the shelter effect of surrounding forests, which mitigates the impact of wind drift, thereby altering turbulent energy and sublimation processes (López-Moreno & Latron, 2007; Pomeroy et al., 2002; Roth & Nolin, 2017; Woods et al., 2006). Wind dynamics play a crucial role in shaping the spatial distribution of SD and SWE values, particularly in open areas where they exhibit a pronounced effect. Strong winds have been noted to accelerate snow redistribution rates, leading to preferential deposition in open areas and consequently contributing to spatially heterogeneous snow accumulation patterns (Clark et al., 2011; Lehning et al., 2008). In instances of strong winds, the variability of SD and SWE values in open areas based on aspect, elevation and slope alone may not provide a comprehensive explanation (Anderton et al., 2004; Jost et al., 2007). Furthermore, as observed in other studies, snow accumulation in open areas can sometimes resemble that found under forest canopy (Dickerson-Lange et al., 2017).
The findings of this study align with related research, indicating that snow cover tends to persist longer in forest gaps compared with areas under forest canopy (Dickerson-Lange et al., 2017; Sanmiguel-Vallelado et al., 2020). Boon (2009) and Hubbart et al. (2015) also reported that the melting rate in forested areas was lower than in clear-cut areas. The impact of forest canopy on reducing incoming shortwave radiation becomes more significant during spring when shortwave radiation levels are high enough to influence melting differences (Lundquist et al., 2013). The higher melting rate observed in open areas and forest gaps compared with under-forest areas can be attributed to the forest canopy's role in reducing evaporation by diminishing wind speed and incoming shortwave radiation (Boon, 2009; Jenicek et al., 2018; Jeníček et al., 2017; Schelker et al., 2013). However, due to lesser snow accumulation, the snow cover under the forest tends to disappear earlier than in open areas and forest gaps where greater snow accumulation occurs (Dickerson-Lange et al., 2017; Hubbart et al., 2015; Lundquist et al., 2013; Revuelto et al., 2015; Sanmiguel-Vallelado et al., 2020). When snow accumulation is insufficient, the influence of forest canopy on snow accumulation and interception becomes more dominant than its effect on melting, thereby exerting control over the snow melting process (Roth & Nolin, 2017; Sanmiguel-Vallelado et al., 2020).
Consistent with the station data, the dominant wind direction during our field studies was north and west, and local topography also had an impact on snow drift and accumulation. In the accumulation periods, the least snow accumulated on the western aspect, while the most snow accumulated on the southern aspect. This distribution can be attributed to prevailing westerly and northerly winds, which likely redistributed the snow cover in open areas. Additionally, northerly winds may have caused preferential snow deposition on the upper slopes and ridges of the southern aspect. Our observations supported this phenomenon, as the snow cover on the south-facing upper slope appeared deep and wavy, whereas the snow cover on the north-facing upper slope was shallow and homogeneous. Previous studies have highlighted similar findings, showing that while snow cover on the upwind slope and ridge is redistributed, preferential snow deposition occurs on the downwind slope (Currier & Lundquist, 2018; Hubbart et al., 2015; Molotch et al., 2005; Mott et al., 2014; Murray & Buttle, 2003). The snow cover on the southern and southwestern aspects melted faster and disappeared earliest on the southwestern aspect. The slightly longer snow disappearance time on the southern aspect may be attributed to higher SWE values compared with the southwestern aspect.
In our study, the influence of elevation on snow accumulation was somewhat obscured by the combined effects of winds in open areas, aspect directions, upper slopes and ridges. Anderton et al. (2004) similarly found no direct correlation between SD and elevation in a catchment with a 215 m elevation difference, noting instead that elevation played a key role in ridge cornice formation. Moreover, forested areas and forest gaps were not uniformly distributed across all aspect directions and elevation levels within our study catchment (Figures 1 and 7). As a result, the ability of PSMPs to represent all catchment characteristics at each elevation level was limited. For instance, the maximum elevation on the southern slope of the catchment (1660 m) is 60 m higher than on the northern slope (1600 m), with only open areas present in this range. High wind speeds can significantly enhance turbulent energy exchange and snow sublimation, leading to preferential snow deposition at higher elevations (Hubbart et al., 2015; Roth & Nolin, 2017). Nonetheless, the observed faster melting at higher elevations and prolonged snow duration as elevation decreased suggests that elevation remains a significant factor in the melting process within our study catchment (Figures 8, 11 and 12).
Since the low slope areas within the study catchment are situated near the upper slopes and ridges exposed to wind, this has limited our ability to fully explain the relationship between slope and snow accumulation, as well as slope and snow melting. Anderton et al. (2004) similarly noted a weak correlation between snow distribution in a catchment and slope, attributing this to snow removal by wind in low slope areas. Therefore, wind events can influence the strength of the relationship between topographic characteristics and snow dynamics (Hojatimalekshah et al., 2021). Snow accumulation, SWE and melting rate were observed to be higher on concave surfaces compared with convex surfaces. These differences may arise from snow removal on convex surfaces and subsequent redeposition on concave surfaces due to wind redistribution (Clark et al., 2011; Sexstone & Fassnacht, 2014). However, despite these observed trends, the CART analysis did not detect a significant effect of curvatures on snow dynamics.
Research like ours is crucial for advancing the understanding of SD and SWE, especially in forested and mountainous regions. Given the intricate interactions between forest canopy, aspect, elevation, wind dynamics and snowpack, comprehensive monitoring and mapping are essential for accurately assessing snow distribution patterns. To fully understand the effects of these variables on forests, it is vital to conduct long-term studies that account for the evolving nature of forest ecosystems and the changing climate. As climate change leads to shifts in weather patterns, the impacts on snowfall and snowmelt could be significant, affecting not only local ecosystems but also water resources downstream. Therefore, continued research into these dynamics will play a key role in guiding forest management practices, developing adaptive strategies and predicting the hydrological impacts of climate change.
5 CONCLUSIONS
In this extensive study, we delved into the spatio-temporal dynamics of SD and SWE concerning forest canopy and topography within a mountainous catchment. Through 14 meticulous snow surveys conducted at 58 PSMPs throughout the snow season, we gained valuable insights. Our findings underscored the role of forest canopy in reducing snow accumulation, SWE and the melting rate. Additionally, the influence of wind resulted in less snow accumulation in open areas compared with forest gaps. This disparity in snow accumulation and SWE between forested and open areas contributed to the earlier disappearance of snow cover beneath the forest canopy.
A primary limitation of our study pertains to the infrequency of snow surveys and the limited coverage of PSMPs representing the diverse forest canopy and topographic features of the catchment. This constraint arose due to resource constraints, including the availability of experienced personnel and adequate equipment. Furthermore, the heterogeneous distribution and size of forest gaps within the catchment posed challenges to the study's spatial representation. In future research endeavours, it would be beneficial to explore the impact of forest gap size and surrounding tree height on the distribution of SD and SWE within coniferous forests.
The positioning of measurement points relative to wind direction emerges as a critical factor influencing both the extent and duration of snow melting. Our observations indicate that wind-induced redistribution and selective deposition of snow play a predominant role in shaping the spatial variability of SD, SWE and melting rates, surpassing the influence of topographic characteristics. Notably, these wind effects are particularly pronounced on the western and southern aspects, at higher elevations, on upper slope positions and ridges, as well as on low slopes. Leveraging the CART method, we gained valuable insights into the key drivers shaping snow accumulation and melting dynamics within the catchment. The CART model exhibited robust performance in predicting SD and SWE when considering distinct snow periods. In summary, our study not only enriches our understanding of the intricate interplay between forests, topography and wind in snow dynamics but also underscores the efficacy of the CART model in unravelling these complex relationships. These findings carry significant implications for land management, hydrology and environmental planning in mountainous regions, paving the way for further exploration into the captivating realm of snow dynamics. Based on this study, we conclude that comprehensive, long-term monitoring of snow distribution is crucial, particularly in the context of climate change. As weather patterns shift, gaining a deeper understanding of these dynamics becomes increasingly important for forest management, hydrological planning and the adaptation of water resource strategies.
ACKNOWLEDGEMENTS
This study was funded by The Scientific and Technological Research Council of Türkiye (TUBITAK), with Project No: 119O760. We thank Burak Türkay and Ece Alkan for their support during in situ measurements.
FUNDING INFORMATION
The Scientific and Technological Research Council of Türkiye (TUBITAK), Project, Grant/Award Number: 119O760.
CONFLICT OF INTEREST STATEMENT
The authors declare no conflicts of interest.
Open Research
DATA AVAILABILITY STATEMENT
Data sharing is not applicable to this article as no new data were created or analyzed in this study.


