Modelling ecohydrological feedbacks in forest and grassland plots under a prolonged drought anomaly in Central Europe 2018–2020
Abstract
Recent studies have highlighted the importance of understanding ecohydrological drought feedbacks to secure water resources under a changing climate and increasing anthropogenic impacts. In this study, we monitored and modelled feedbacks in the soil–plant-atmosphere continuum to the European drought summer 2018 and the following 2 years. The physically based, isotope-aided model EcH2O-iso was applied to generic vegetation plots (forest and grassland) in the lowland, groundwater-dominated research catchment Demnitzer Millcreek (NE Germany; 66 km2). We included, inter alia, soil water isotope data in the model calibration and quantified changing “blue” (groundwater recharge) and “green” (evapotranspiration) water fluxes and ages under each land use as the drought progressed. Novel plant xylem isotope data were excluded from calibration but were compared with simulated root uptake signatures in model validation. Results indicated inter-site differences in the dynamics of soil water storage and fluxes with contrasting water age both during the drought and the subsequent 2 years. Forest vegetation consistently showed a greater moisture stress, more rapid recovery and higher variability in root water uptake depths from a generally younger soil water storage. In contrast, the grassland site, which had more water-retentive soils, showed higher and older soil water storage and groundwater recharge fluxes. The damped storage and flux dynamics under grassland led to a slower return to younger water ages at depth. Such evidence-based and quantitative differences in ecohydrological feedbacks to drought stress in contrasting soil-vegetation units provide important insights into Critical Zone water cycling. This can help inform future progress in the monitoring, modelling and development of climate mitigation strategies in drought-sensitive lowlands.
1 INTRODUCTION
Sustaining water resources and ecosystem services are complex challenges in the context of accelerating land use and climate change in the Anthropocene (Gleeson et al., 2020). The important role of vegetation in regulating terrestrial water fluxes (Dubbert & Werner, 2019; Jasechko et al., 2013) as well as the potential for manipulating land cover for climate change mitigation (Silva & Lambers, 2020) are increasingly recognized. However, the precise ways in which different vegetation communities affect ecohydrological partitioning are poorly understood, with quantitative separation of interception, evaporation and transpiration usually being highly uncertain (Dubbert & Werner, 2019). Consequently, the ways in which vegetation and ecohydrological partitioning respond to climate change as well as the effects on water availability for root zone storage and groundwater recharge is still a key challenge (Brooks et al., 2015). This makes it difficult to assess the sensitivity and resilience of different land use strategies to climate change (Li, Migliavacca, et al., 2021).
Under climate change, in many areas, droughts are predicted to become more frequent, with multiple impacts on hydrological systems (Mishra & Singh, 2010). The expected increase in drought occurrence in central Europe in the 21st century, underline the need to develop effective mitigation to ensure integrated and sustainable land and water management policies for future climatic conditions (Samaniego et al., 2018). Of course, there are differences in drought-induced reductions of blue (recharging ground and surface water) and green water (transporting moisture back to the atmosphere; Falkenmark and Rockström, 2006) fluxes in near-natural systems across Europe (Orth & Destouni, 2018). Contrasting vegetation communities show varying sensitivity to water scarcity, depending on physiological adaptations and the nature of subsurface water storage (Lobet et al., 2014). Thus, there is potential for mitigating the effects of drought and subsequent “memory effects” through management of local green water fluxes, rather than basing management decisions solely on maintaining the provision of blue water fluxes (Rockström et al., 2009).
One way forward to address existing knowledge gaps is integrating multiple streams of relevant data into the calibration and validation of process-based ecohydrological models (Fatichi et al., 2016; Guswa et al., 2020). Such models facilitate quantitative estimates of blue and green water fluxes from different soil-vegetation systems. This helps to inter-compare between landuses and thus, to understand differences in partitioning under drought conditions and subsequent recovery. To constrain models and reduce uncertainty, multi-criteria calibration is invaluable, potentially incorporating high information content on key processes.
The abundances of the heavier stable isotopes, deuterium (δ2H) and oxygen-18 (δ18O), in the water molecule are particularly useful (Birkel & Soulsby, 2015; Turner & Barnes, 1998) and well-established tracers (Gat & Gonfiantini, 1981) for providing such additional information. Isotopes are natural tracers that reflect phase changes (e.g., evaporative effects) and mixing with storage in different compartments of the Critical Zone. This is the thin, dynamic, life-sustaining skin of the Earth that extends between the atmospheric boundary layer and the bottom of the groundwater. Using isotopes in the calibration and/or validation of ecohydrological models can test whether process-based conceptualisations are “getting the right answers for the right reasons” (Kirchner, 2006). Importantly, such models can also estimate water ages (Sprenger et al., 2019) and provide insight into large scale ecohydrological partitioning (Smith et al., 2021; Tetzlaff et al., 2015). Water age is an important metric of hydrological function which indexes linkages between mixing, storages and fluxes in landscapes. Observations of water stable isotope dynamics in the subsurface are useful to understand the pathways of water (Li, Sullivan, et al., 2020) and can substantially aid multi-criteria calibration (Smith, Tetzlaff, Kleine, et al., 2020). Recently, the model EcH2O (Maneta & Silverman, 2013) has been advanced to EcH2O-iso (Kuppel et al., 2018) to quantify the relevant fluxes governing ecohydrological partitioning and to track the isotopic (δ2H, δ18O) composition and age of water through the model domain. This allows isotopes to be used as both calibration constraints for key processes, as well as a means of validating model performance if sufficient isotope time series are available (Smith et al., 2021; Smith, Tetzlaff, Kleine, et al., 2020). The quantification of water ages in green water fluxes helps to assess the resilience of the associated ecohydrological fluxes and ecosystem services, as well as the temporal dimension of feedbacks to climate extremes (Kuppel et al., 2020).
The State of Brandenburg in NE Germany forms part of the Northern European Plain and is a drought-sensitive lowland area surrounding the capital city of Berlin. The region has high societal importance for the provision of several ecosystem services; these include food and timber production, groundwater recharge and contributions to drinking water supplies for over 5 million people. The Demnitzer Millcreek experimental catchment (DMC, 40 km SE of Berlin) was established in 1990 to understand the effects of agricultural pollution on surface water quality (Gelbrecht et al., 2000, 2005). Latterly, work has focused on understanding ecohydrological partitioning at the catchment scale (Kleine et al., 2021), adding spatially distributed monitoring of soil moisture and groundwater, to complement the long-term rainfall and stream flow measurements (Smith et al., 2021). Extensive monitoring of isotope dynamics in the catchment started just before the European drought in 2018 and was expanded to more ecohydrological compartments thereafter (Kleine et al., 2020). The drought of 2018 was followed by a prolonged period of reduced rainfall when most monthly rainfall anomalies were negative and temperatures remained above average. Such conditions are anticipated to become more common in the next decades (Lüttger et al., 2011). Future climate may result in lower groundwater recharge, stream network disconnections and reduced production of soil organic matter (Fleck et al., 2016).
- To quantify the impacts of prolonged drought on ecohydrological fluxes in two common soil-vegetation (forest and grassland) units;
- To use the water stable isotopes dynamics of soil and vegetation in model calibration and evaluation, respectively;
- To explore the contrasting time-variant impact of ongoing drought conditions on the storage-age-flux dynamics between sites.
2 STUDY SITE
The data used in this study were collected from the DMC, which is located in NE Germany (52°23′N, 14°15′E; Figure 1). This lowland region experiences a temperate humid warm summer climate (Kottek et al., 2006). Mean air temperature is 9.6°C with a mean annual precipitation of 567 mm/yr (DWD, 2020, for the period 2006–2015). Precipitation falls throughout the year, but seasonal differences lead to higher summer precipitation from fewer, high intensity, convective events and lower amounts during more frequent frontal rain in winter.
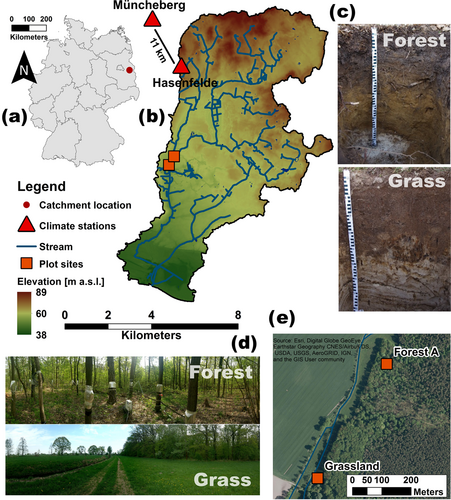
The DMC lowland landscape (Figure 1(b)) was shaped by the last glaciation (Weichselian), which resulted in generally sandy soils on glacial and fluvial deposits. The catchment is groundwater-dominated and historically had little surface runoff and was characterized by numerous peat fens and freshwater lakes in hollows, but these were drained during a long history of anthropogenic usage (Nützmann et al., 2011). Current land use is dominated by forestry and farming (for more details see Kleine et al., 2020; Smith et al., 2021). The relatively sparsely populated catchment is a setting for recovering wildlife populations including recolonization of beaver (Smith, Tetzlaff, Gelbrecht, et al., 2020), wolf (Vogel, 2014) and even sporadic sighting of elk (Martin, 2014).
For the landscape to maintain its important ecosystem services in this lowland part of Brandenburg, sufficient seasonal precipitation input is needed to retain root zone soil moisture levels that sustain crop and tree growth (Drastig et al., 2011). Further, adequate groundwater recharge is needed to sustain groundwater-surface interactions. However, the low water retention in the dominant sandy soils and high (~90%) proportions of evapotranspiration losses dominate the water balance (Smith et al., 2021), resulting in drought sensitivity of the catchment (Kleine et al., 2020). Additionally, the imprint of vegetation by mediating ecohydrological partitioning results in temporary catchment scale patterns of stream network disconnections during droughts (Kleine et al., 2021; Smith et al., 2021).
In this study, the ecohydrological fluxes in the near-surface Critical Zone were investigated at two plot sites in the western parts of the catchment (Figure 1). As the topography is flat, elevation differences between the sites are negligible. Given the high permeability of the soils, the occurrence of surface ponding of water or surface runoff was not observed during the study period. The plots are characterized by different soil properties and vegetation types. The forested site is dominated by broad-leaved trees (mainly European oak) with one mature Scots Pine in the plot. Other species like maple and elm tree or hazel are present in the immediate vicinity (<10 m). The soil is a sandy freely draining Lamellic Brunic Arenosol (Humic; Table 1). The second, grassland site is characterized by pasture including higher proportions of finer grain sizes in the upper soil relative to the forest and a somewhat more water retentive Eutric Arenosol (Humic, Transportic; Table 1). This site is in close spatial proximity to the forested site (~400 m) as well as the stream (~10 m) and subject to some shading effects (Smith, Tetzlaff, Kleine, et al., 2020). The grassland site is fenced and usual management (with cutting once a year) was simulated within the plot.
| Depth | Clay | Silt | Sand | Porosity | PWP (pF 4.2) | Dry bulk density |
|---|---|---|---|---|---|---|
| upper - lower cm | < 0.002 mm | 0.002–0.063 mm | 0.063–2.0 mm | vol. % | vol. % | g cm−3 |
| Grassland | ||||||
| 0–8 | 6.3 | 6.3 | 82.4 | - | - | - |
| 8–28 | 7.7 | 7.7 | 81.3 | 48.7 | 10.3 | 1.3 |
| 28–42 | 3.8 | 3.8 | 87.6 | 45.9 | 8.7 | 1.4 |
| 42–70 | 1.0 | 1.0 | 97.3 | 42.4 | 1.1 | 1.5 |
| 70–95 | 0.8 | 0.8 | 98.8 | - | - | - |
| Forest | ||||||
| 0–5 | 3.2 | 3.2 | 83.7 | - | - | - |
| 5–18 | 3.7 | 3.7 | 84.1 | 59.8 | 8.4 | 1.0 |
| 18–35 | 1.3 | 1.3 | 89.1 | 45.4 | 3.6 | 1.4 |
| 35–65 | 1.9 | 1.9 | 93.1 | 41.2 | 2.2 | 1.0 |
| 65–70 | 8.9 | 8.9 | 83.2 | - | - | - |
| 70–120 | 7.3 | 7.3 | 89.6 | - | - | - |
3 DATA AND METHODS
3.1 Climatic input data
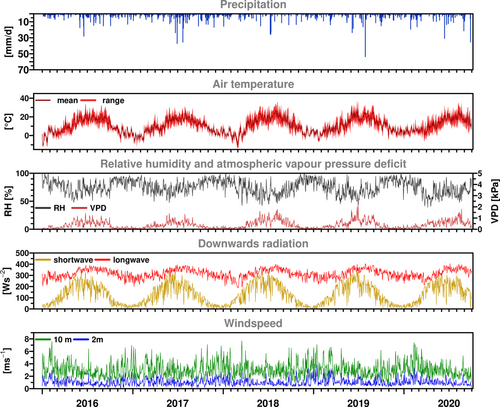
The model forcing climatic daily input data (see Table 2) for the study period (January 2018–September 2020) and spin-up period (2016 and 2017) were based on long-term weather station data of the German Weather Service (Deutscher Wetterdienst (DWD), 2020) and an automatic weather station (AWS, Environmental Measurement Limited, UK) at Hasenfelde, which was installed in May 2018. This data was further supplemented by global atmospheric reanalysis dataset ERA 5 (Hersbach et al., 2020) for radiation, as well as MODIS (Running et al., 2017) data for 8 day estimates of evapotranspiration and latent heat. We also calculated vapour pressure deficit (VPD) (Allen et al., 1998).
| Data | Unit | Acquisition | Timestep | Period | Further |
|---|---|---|---|---|---|
| Forcing | |||||
| Precipitation | mm/d | Weather station | Daily | 2016–2020 | |
| Temperature | °C | Weather station | Daily | 2016–2020 | At 2 m |
| Windspeed | m/s | Weather station | Daily | 2016–2020 | At 10 and 2 m |
| Relative humidity | % | Weather station | Daily | 2016–2020 | At 2 m |
| Shortwave radiation | W/m2 | Reanalysis (ERA5) | Daily | 2016–2020 | 500 m grid |
| Longwave radiation | W/m2 | Reanalysis (ERA5) | Daily | 2016–2020 | 500 m grid |
| δ2H | ‰ VSMOW | Collector | Daily | From July 2018 | Modified ISCO |
| δ18O | ‰ VSMOW | Collector | Daily | From July 2018 | Modified ISCO |
| Calibration | |||||
| Transpiration | mm/d | Sap flow | Daily | Summer 2018 | Granier-type |
| Latent heat | W/m2 | MODIS | 8 days | ||
| Soil moisture | |||||
| (3 depth) | vol. % | SMT-100 | Daily | From June 2018 | 6 per depth |
| Soil isotopes | |||||
| (6 depths) | ‰ VSMOW | Manual | Monthly | 09.2018–11.2019 | Direct equilibrium |
3.2 Plot site installations
Transpiration rates were derived from 12 trees at the forested site using 2–4 Granier-type sensors per tree (Thermal Dissipation Probes, Dynamax Inc., Houston, details in Smith et al., 2020). The time-series was normalized by subtracting the data's mean and dividing by the standard deviation. Volumetric soil moisture content was measured by 36 sensors (SMT-100, Umwelt-Geräte-Technik GmbH, Müncheberg, Germany) per site. The sensors were installed at 20, 60 and 100 cm below the surface in June 2018. Arithmetic means of the 15 minutes measurement interval from six sensors per depth were aggregated to daily values and used for model calibration. The grassland site ended its operation in January 2020. For more details see Kleine et al. (2020).
3.3 Isotopic sampling
Stable water isotopes in precipitation were sampled daily from July 2018 onwards with a modified ISCO 3700 autosampler (Teledyne ISCO, Lincoln) at the Hasenfelde AWS (Figure 1(b)). cm of paraffin oil in the autosampler bottles (International Atomic Energy Agency, 2014) to prevent evaporation.
Monthly bulk soil water isotopes were sampled manually with a soil auger from September 2018 until October 2019 at six depths (0–5, 5–10, 10–20, 20–30, 40–60, 80–100 cm) with 3 replicates per site and depth. The sampled soil volume was quickly placed in diffusion tight bags (CB400-420siZ, Weber Packaging, Güglingen, Germany) and stored – protected from radiation and heat (Styrofoam box) – until further processing on the same day after return from the field. In the isotope laboratory of the Leibniz Institute of Freshwater Ecology and Inland Fisheries (IGB), the isotopic signatures of δ18O and δ2H in bulk soil water were derived using the direct equilibrium method (Wassenaar et al., 2008). The time for equilibration between liquid water and added dry air headspace was ~48 h at room temperature (21°C). Quality criteria for measurements were applied to a 2 minute plateau in the standard deviation of water content (< 100 ppm), δ2H (< 0.55 ‰) and δ18O (< 0.25 ‰). Derived isotopic signatures were corrected for potential gas matrix change (Gralher et al., 2018) effects of the used cavity ring-down spectrometer (CRDS, L2130-i, Picarro, Inc., CA).
Plant xylem isotopes were sampled monthly from twig samples in forest vegetation above breast height (September 2018–October 2019). The grassland vegetation was sampled by collecting above ground culms excluding leave sheaths (October 2018–October 2019). As for the soil isotopes, three replicates were obtained per site and sampled vegetation type. Samples were rapidly taken and immediately placed in sealable glass vials (9.190605, Faust Lab Science GmbH, Klettgau, Germany) and frozen at −20°C upon return to the laboratory. Water from vegetation samples was extracted in January 2020 in the laboratory of the Ecosystem Physiology (University Freiburg) using a cryogenic extraction line routine described in Dubbert et al. (2013, 2014). The samples were heated to 100°C, the applied extraction pressure was 0.03 Pa and the extraction time approximately 90 min. After extraction, samples were weighed and oven-dried for 24 h at 105°C. We excluded samples with bad extraction efficiency (<97.7% or > 101%) or that were flagged for organic contamination by the CRDS Software (ChemCorrect; Picarro, Inc., CA). For soft validation of the model performance, we adapted the isotopic signature of the woody forest vegetation based on findings from Chen et al. (2020) by increasing the measured δ2H values by +8.1 ‰ following Allen and Kirchner (2021) to assess the offset between forest plant xylem isotopes as well as soil isotopes and model output on the other. This method is useful for visual comparison between modelled and simulated xylem isotopes to strengthen the confidence in the model results despite methodological uncertainties in xylem isotope sampling from woody plants.
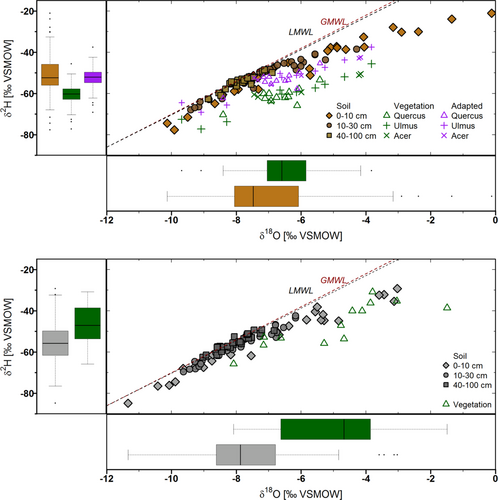
We used an amount weighted least squares regression (Hughes & Crawford, 2012) to calculate the LMWL with precipitation exceeding 1 mm (Kleine et al., 2021) resulting in a slope (a) of 7.9, an intercept (b) of 8.6 and R2 = 0.98. For the global meteoric water line (GMWL) displayed in Figure 4, a = 8 and b = 10 (Craig, 1961).
3.4 Standardized precipitation index (SPI)
The Standardized Precipitation Index (SPI, McKee et al., 1993) was calculated using the R (R Core Team, 2013) package “SCI” (Stagge & Gudmundsson, 2016) on long-term (1951–2020) monthly precipitation totals from the DWD station Müncheberg by fitting a gamma distribution. The SPI drought index (Zargar et al., 2011) indicates the deviation from normal precipitation amounts in the same periods in the long-term data from the value of 2 (extreme wet) to −2 (extreme dry). The SPI can be calculated for a specific period (here 6 months) and phenomena reflected by the SPI vary with the set period.
3.5 The EcH2O-iso model
The spatially distributed ecohydrological model EcH2O (Maneta & Silverman, 2013) was extended to EcH2O-iso to include tracking of water stable isotopes and water ages by Kuppel et al. (2018). A comprehensive description of model structure and parametrisation as well as the isotope routine of EcH2O-iso is provided in Kuppel et al. (2018).
Here, the two plot sites were implemented into EcH2O-iso as two individual, one-dimensional (no lateral flow), model domains with one pixel each that spans the base area dimensions of the plots (10 by 10 m) and covers one vegetation and soil unit. We minimized the number of model parameters to 32 (cf. Smith, Tetzlaff, Kleine, et al., 2020) by excluding vegetation dynamics for this application and focused on vertical fluxes in the upper Critical Zone (soil parameters shown with ranges in Appendix A). Based on the soil profiles (Table 1) and these previous simulations, the soil in the model application was discretised into three soil layers (1, 2, 3) to match the soil conditions with fixed depth dimensions of 15, 35 and 50 cm, respectively, from top to lower boundary of the soil profile. Mixing of water, isotopes and water ages in the soil layers was assumed to be complete for each time step in this application. Soil evaporation in the model is limited to soil layer 1. Infiltration was computed by estimating water movement through the subsurface (percolation between soil layers) by gravity drainage (Heber Green & Ampt, 1911).
EcH2O-iso (Kuppel et al., 2018) uses an energy balance scheme and flux-gradient similarity to compute ecohydrological fluxes. At the canopy level, energy balance calculations of latent heat of transpiration and evaporation, sensible heat and net radiation are iteratively solved using canopy temperature. Canopy interception evaporation occurs from a linear bucket storage, estimated for included vegetation types. The energy balance at the surface is also calculated by including weighted vegetation type for longwave radiation from vegetation and dynamically solves the energy balance with surface sensible and latent heat from a hydrostatic top soil (10 cm in this study), ground heat from two thermal layers, surface temperature, net radiation and snow heat and snowmelt (if present) (Maneta & Silverman, 2013).
Root water uptake from each soil layer is derived from the transpiration flux estimated in the canopy energy balance. The transpiration flux is partitioned for each layer using an exponentially distributed rooting density covering the complete soil depth and plant available soil moisture (above residual water content) in the individual layers.
Set-up of the model (pixels and vegetation/soil percentages) was conducted similarly to Smith, Tetzlaff, Kleine, et al. (2020) (see above for detail) however, the primary differences come with calibration, duration of the study period and parameterisation. The type and origin of model forcing data used for the model spin up period (2016–2017) and the calibrated study period (January 2018–September 2020) are shown in more detail in Figure 2 and Table 2. We used the model to derive flux and storage quantities during the study period and therefore deliberately excluded a validation time-series. We produced 100 000 parameter sets per site for Monte Carlo calibration using Latin Hypercube Sampling. We then identified the “best” 30 runs by multi-criteria calibration over the study period, covering drought and recovery conditions. We included soil moisture, δ2H and lc-excess for the three soil layers, evapotranspiration, latent heat (and additionally sap flow at the forested site; see Table 3) in the calibration. The multi-criteria calibration used the combination of all efficiency criteria of calibration parameters ranked between 0 (worst) and 1 (best) for all runs to identify the best parameter sets. We used the mean absolute error (MAE) and the Nash-Sutcliffe efficiency (NSE, Nash & Sutcliffe, 1970) as efficiency criteria for model calibration. NSE was exclusively used for volumetric soil moisture in layers 1 and 2, as well as sap flow due to the observed high temporal variability, whereas less dynamic variables were assessed with the MAE (see Table 3). To assess annual differences of the water balance within and between sites, the best 30 model runs were averaged and aggregated over calendar years. As the study period ended in September 2020, the values allow inter-site comparison rather than inter-annual comparisons.
| Parameter | Description | Criteria | Forest | Grassland | ||||
|---|---|---|---|---|---|---|---|---|
| Mean | Min | Max | Mean | Min | Max | |||
| SMCL1 | Soil Moisture Content Layer 1 | NSE | 0.50 | 0.40 | 0.64 | 0.54 | 0.49 | 0.62 |
| SMCL2 | Soil Moisture Content Layer 2 | NSE | 0.46 | 0.41 | 0.52 | 0.46 | 0.41 | 0.54 |
| SMCL3 | Soil Moisture Content Layer 3 | MAE (vol. %) | 0.06 | 0.02 | 0.15 | 0.04 | 0.01 | 0.11 |
| ET | Evapotranspiration | MAE (mm/d) | 0.82 | 0.73 | 0.96 | 0.85 | 0.72 | 0.95 |
| LE | Latent heat | MAE (W/m2) | 23.5 | 21.0 | 27.5 | 24.4 | 21.1 | 26.8 |
| Sap flow (N) | Normalized Sap flow | NSE | 0.29 | 0.10 | 0.40 | - | - | - |
| d2HL1 | δ2H Layer 1 | MAE (‰) | 5.67 | 2.92 | 17.9 | 3.93 | 2.19 | 6.05 |
| LCxL1 | lc-excess Layer 1 | MAE (‰) | 2.58 | 1.32 | 5.29 | 0.19 | 0.00 | 0.36 |
| d2HL2 | δ2H Layer 2 | MAE (‰) | 5.20 | 1.52 | 8.98 | 3.70 | 1.83 | 4.15 |
| LCxL2 | lc-excess Layer 2 | MAE (‰) | 0.92 | 0.26 | 2.09 | 0.41 | 0.37 | 0.51 |
| d2HL3 | δ2H Layer 3 | MAE (‰) | 4.53 | 0.00 | 7.55 | 0.68 | 0.33 | 1.14 |
| LCxL3 | lc-excess Layer 3 | MAE (‰) | 1.46 | 0.66 | 3.23 | 2.61 | 1.82 | 3.07 |
4 RESULTS
4.1 Dynamics in hydroclimate, subsurface moisture and water stable isotopes
Exceptional climatic conditions during the study period – due to the European drought of 2018 and an ongoing period of below-average rainfall and above-average temperatures; reflected in the temporal dynamics in the climate data (Figure 2). Annual precipitation was lowest in 2018 (386 mm; 68% of the 2006–2015 average annual rainfall) and higher in 2019 (510 mm; 90% of average). Mean annual temperature was above average in 2018 and 2019 (both 10.7°C). Relative humidity (at 2 m) showed seasonal dynamics with higher values in winter and lower values during summer. Mean annual relative humidity decreased from pre-drought values of 77.5% (2016–2017) to 73.8 and 75.0% in 2018 and 2019, respectively, though was higher in the summer of 2019. Mean annual atmospheric vapour pressure deficits (Figure 2) increased from 0.35 and 0.33 kPa (2016, 2017) to 0.45 and 0.42 kPa in 2018 and 2019, respectively. These patterns were also reflected in increased mean annual shortwave solar radiation of ~135 W/m2 in 2018 and ~130 W/m2 in 2019 in the re-analysis model forcing data. The annual mean longwave downward radiation from the same dataset had minor variability from 2016 to 2019 (314–317 W/m2). Measured windspeed had a mean of 3.1 m/s (standard deviation, SD: 1.2 m/s) at 10 m and a lower mean value of 1.0 m/s (SD: 0.4 m/s) at 2 m height during the study period.
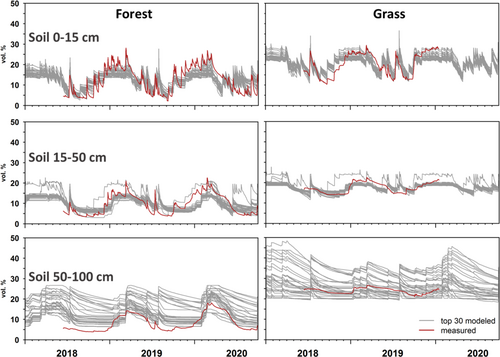
The observed soil moisture dynamics in the three soil layers (Figure 3 - starting in June 2018) showed clear differences between sites and depths. Volumetric soil moisture was most responsive to precipitation events in the upper soil layers at both sites; but generally lower and more dynamic under forest vegetation. At the forest site, mean daily soil moisture was most variable in the upper soil and had the highest soil moisture content, with a mean of 12.1%. The second soil layer had more damped dynamics and a lower water content (mean of 9.3%). The upper horizons were wetter in the early summers of 2019 and 2020 with more frequent rainfall inputs. Soil moisture in layer 3 was least variable and generally lowest (mean: 8.2%); and although wetness successively increased through the winters of 2018/19 and 2019/20 summer levels were similar across the 3 years. The grassland site's soil profile was generally wetter than the forest site. Again, soil moisture in the upper soil was most variable, but with a mean of 20.2% in soil moisture. As under forest, the soil moisture dynamics were lower with increasing depth and soil moisture observations resulted in a mean of 17.5% and 23.9% in soil layers 2 and 3, respectively. Interestingly, minimum summer levels in 2019 were slightly lower than in 2018.
The measured precipitation isotope signatures showed strong seasonality and were more depleted in heavy isotopes in winter and more enriched in summer ranging from −140.2 to −7.1‰ in δ2H, respectively. The bulk soil water samples generally plotted along the LMWL and showed more pronounced deviations (more negative lc-excess) in the upper soil under forest than grassland. The averaged (3 replicates) bulk soil isotope values under forest and grass ranged from −77.7 to −21.1‰ and −84.8 and −29.2‰ in δ2H, respectively. Under the forest site, δ2H signatures were damped with increasing depth with the highest variability in layer 1. The grassland exhibited similar damping with depth but showed generally slightly less enrichment.
Plant xylem isotopes from the forest ranged from −77.3 to −45.6‰ in δ2H (Figure 4). Grassland plant xylem isotopes showed a smaller range with −65.8 to −30.8‰ in δ2H. Plant xylem isotopes deviated from the LMWL (following evaporation dynamics) for both vegetation types. However, whereas the grassland isotopes showed general accordance with upper soil bulk water, the forest vegetation exhibit more complex characteristics in the dual-isotope space, generally plotting further away from the soil isotopic signature and showing species-specific differences. When adapted (Figure 4, in purple) according to Allen and Kirchner (2021), the tree samples plotted much closer to the LMWL and to the bulk soil samples.
4.2 Model performance
The site-specific dynamics and damping of volumetric soil moisture with depth were well reproduced for layer 1 and 2 by the model, both in 2018 and the subsequent two summers (Figure 3). The model also hindcast the moisture conditions at the start of 2018 following a wetter autumn and winter. The NSE for soil moisture simulations (Table 3) were highest in the upper soil layers (forest: 0.50; grassland: 0.54) and decreased in the deeper soil layer 2 (forest: 0.46; grassland: 0.46) where there was less variability at both the forested site and grassland site. Soil moisture simulations in layer 3 usually resulted in overestimations at both sites and greater uncertainty (MAE forest: 0.06%, grassland: 0.04%), though this mostly reflects the comparison of a modelled layer with a point measurement.
The calibrated isotopic dynamics in bulk soil water δ2H signatures between September 2018 and October 2019 (Figure 5) were adequately simulated by the model. As with soil moisture, the variability in the isotopic signature was damped during passage through the soil profile. For the forest site, the best 30 parameter sets resulted on average in a decreasing mean MAE in δ2H with layer depth (Layer 1: 5.7‰; Layer 2: 5.2‰; Layer 3: 4.5‰). The soil isotopic dynamics at the grassland site were more efficiently captured with a MAE of 2.2, 1.8 and 0.3‰ in soil layer 1, 2 and 3, respectively. Simulations were generally more uncertain within deeper soils; however, the fixed soil layer depths in the model and complete mixing assumption still captured the damping of soil isotope and moisture dynamics with depth adequately.
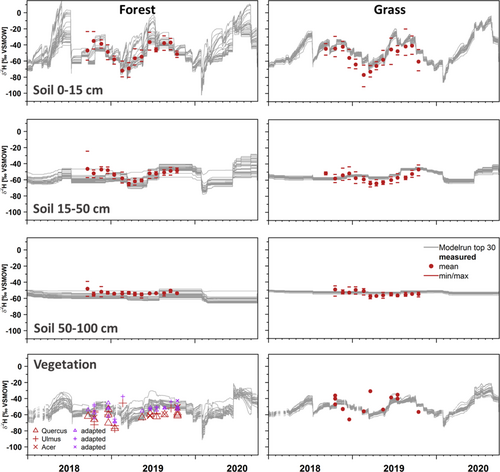
Even though plant xylem isotopes were not included in the calibration their general dynamics were well captured by the model. Simulations were better for the grassland site, though the adaption (Allen & Kirchner, 2021; Chen et al., 2020) brought xylem samples from trees close to root water uptake composition simulated by the model.
4.3 Prolonged drought impacts on ecohydrological fluxes
The 6 months SPI (Figure 6, top panel) indicated the prevalence of below-normal precipitation anomalies over the study period occurred from May 2018 until June 2019, reaching −1.8 in January 2019. Only very brief periods with above-average precipitation were observed after summer 2018, however, the catchment experienced a shift back towards more normal precipitation conditions in the beginning of 2020 (Feb/Mar). The plots show clear vegetation-related differences in partitioning feedbacks to the drought conditions (Figure 9, lower panel). Interestingly, in the early spring of 2018 when rainfall anomalies were positive, blue water fluxes to groundwater recharge were similar under both land uses. However, as the summer progressed, recharge from the forest site ceased, whilst the grassland site continued to recharge through the summer following rainfall in July. The forested site showed overall higher and more dynamic ecohydrological fluxes of combined daily ET and groundwater recharge (mean: 1.2 mm/d; SD: 0.9). Groundwater recharge under the forest was mainly restricted to late winter / early spring rewetting outside of the vegetation-growing period in 2019 and 2020 and was on average 9.4% of all ecohydrological fluxes and ET 90.6% over the study period (SD: 10.1%).
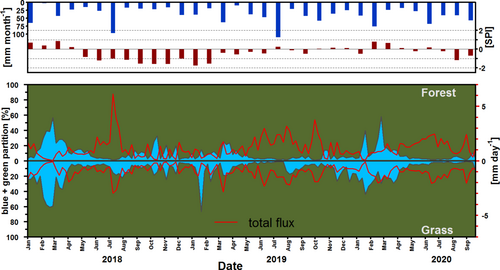
In relation to the forest site, the grassland site showed lower total combined green and blue water fluxes (mean: 1.0 mm/d; SD: 0.6) probably due to partial shading of this site and plant water use characteristics. There were seasonal patterns with stronger fractions of groundwater recharge outside of the growing period. Though overall, recharge fluxes under grassland were more persistent during the study period, especially in summer (e.g., summer 2018 and 2019) and less restricted to winter with a mean share of 12.6% of total fluxes and ET = 87.4% (SD: 12.6%). The exception was summer 2020 where there was little recharge after May.
4.4 Storage-age-flux dynamics under forest and grassland
Mean model estimates for the different annual ecohydrological fluxes are displayed in Figure 7 along with the standard deviation (±SD) from the best 30 model runs.
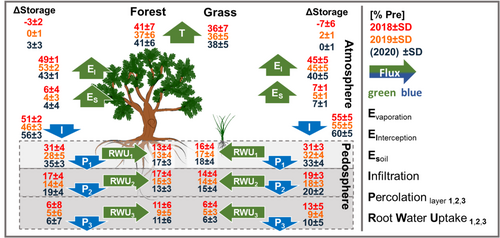
The patterns of root water uptake (RWU) and groundwater recharge characteristics differed between sites. The forested site had high fractions of green water fluxes throughout the study period. In 2018, evapotranspiration from the interception storage (EI; 49 ± 1%), transpiration (41 ± 7%) and soil evaporation (6 ± 4%) were dominating the water balance with only 6% of precipitation percolating as groundwater recharge from the lower boundary of the model domain. The water stored in the soil within the model domain was reduced by 3 ± 2% of the annual precipitation. Higher annual precipitation in 2019 resulted in greater inputs during the vegetation period and higher fractions of evaporation from the intercepted precipitation (53 ± 2%). The storage showed no annual net change but did not replenish the 2018 deficit. Annual groundwater recharge remained was lower than in 2018 as a percentage of annual precipitation. RWU for transpiration was sourced throughout the soil profile. Highest proportions relative to total RWU were taken up from soil layer 2 (2018: ~41 ± 9%; 2019: ~40 ± 9%) during drier conditions (Figure 9; relative to transpiration). In the wetter summer of 2020, dominant RWU shifted to the upper soil layer (~41 ± 7%) and the deeper soil remained an important source for transpiration water through all 3 years (28 ± 15%; 25 ± 15%; 28 ± 14%).
The grassland site experienced less inter-annual variability as the values of transpiration (36 ± 7%) and EI (45 ± 5%) from 2018 stayed the same for 2019, but groundwater recharge was reduced from 2018 (13 ± 5%) to 2019 (9 ± 4%) in the relative annual water balance (Figure 7). The change in soil storage under grassland was positive in 2019, partly refilling the deficit from 2018. RWU for transpiration was less variable than the forest and predominantly sourced from the upper soil layer 1 (2018: 45 ± 10%; 2019: 46 ± 12%; 2020: 47 ± 12%), with secondary contributions from layer 2 (38 ± 11%; 39 ± 11%; 38 ± 11%) and less from the deeper soil (17 ± 11%; 15 ± 8%; 15 ± 9%).
The simulated differences in water ages of the soil storages and RWU patterns have direct implications for the estimated ages of groundwater recharge and transpiration (Figure 8). At the forest site, mean annual water ages increased with soil depth. The water in the upper-most soil layer was youngest and became younger throughout the study period. The same temporal development was simulated for the second soil layer though water age increased with depth. Soil layer 3 showed the oldest water in the soil profile. It was youngest (460 ± 91 days) during 2018 and became ~30 days older in 2019 and 2020. Absolute uncertainties in water age estimates increased with soil depth from few days in layer one to few months in layer 3.
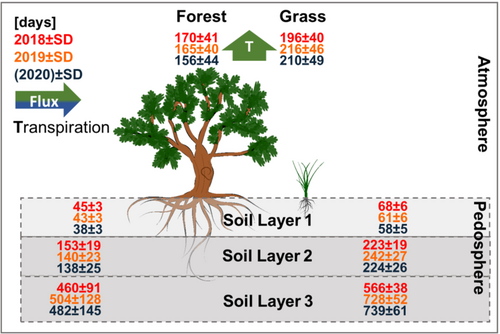
Under the grassland, simulated water ages were generally older than under the forest throughout the profile and between years (Figure 8). Mean annual water age in soil layer 1 decreased from 68 ± 6 days in 2018 to 61 ± 6 and 58 ± 5 in the following years. The oldest water in soil layer 2 occurred in 2019 (242 ± 27 days). The deepest soil layer showed the oldest water ages increasing in age over the study period. Like the forest site, uncertainties in water age estimates increased with soil depth but were less pronounced from few days in layer 1–2 months in layer 3.
Weekly transpiration sources and their ages also differed between the sites (Figure 9). Transpiration fluxes at the forest showed higher mean simulated fluxes (3.4 ± 1.1 mm/week) and higher maximum values of 22.3 ± 4.7 mm/week over the study period. Peak transpiration rates were much higher in 2018 (after a rain event), though overall transpiration amounts were similar to 2019 and only 10% higher than 2020. Infiltration of precipitation events into the low storages of soil layer 1 increased soil moisture and fractions of RWU from layer 1, resulting in younger associated water in transpiration (shown in the lower panel of Figure 9). This led to a mean transpiration age (weighted by transpiration flux) of 162 days. There was no evidence of soil water ages systematically increasing. Soil water in deeper storage only became older during times of very low transpiration fluxes and RWU in winter.
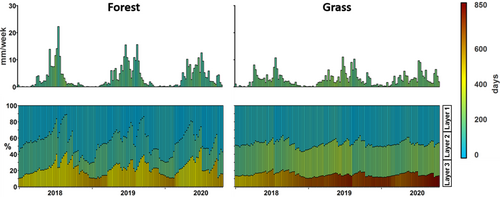
The grassland site showed lower variability in transpiration fluxes during the study period with a lower mean (2.7 ± 0.8 mm/week) and lower RWU dynamics in all 3 soil layers (Figure 9). This led to the youngest water ages in transpiration at the end of summer (as under forest), but with less pronounced influences of new precipitation on water ages in the soil storages. The RWU was generally from higher and therefore younger, soil storages compared to the forest. Soil water in layer 3, which also feeds groundwater recharge, became older throughout the year as RWU was limited. New precipitation water of larger precipitation events in late summer percolated down the soil profile to mix with the existing older water. However, the continued increase in modelled ages of water in 2019 and 2020 indicated limited percolation relative to storage. The low fraction of RWU derived from the older storage in soil layer 3 resulted in weighted mean transpiration age of 204 days.
5 DISCUSSION
5.1 Impacts of prolonged drought on ecohydrological fluxes
The reduced precipitation input during the European drought of 2018 (see SPI values; Figure 6) and prolonged rainfall anomaly in the DMC during monitoring were also observed in other parts of Europe (Graf et al., 2020). The drought was particularly severe in the Northern European Plain (Ahmed et al., 2021) with ongoing water deficits through 2019 and into 2020. In the DMC, this resulted in periods of low water storage in the upper Critical Zone driven by high atmospheric moisture demand given high energy inputs, increased air temperatures and reduced relative humidity. This was similar to impacts of other recent European droughts (Hanel et al., 2018), nearby observations in 2018 (Heinrich et al., 2019) and observations from agricultural land use elsewhere in the Northern European Plain (Buitink et al., 2020). The severity of impacts from the drought which started in 2018 on green water fluxes was evident in reduced crop yields (esp. 2018) in the catchment and also communicated by local stakeholders engaged in DMC farming and forestry, where crop yields were 40% lower in 2018 and the effects of reduced groundwater are expected to persist for several years (Kannenberg et al., 2019). Such conditions are expected to occur more often in future (Samaniego et al., 2018).
A strong seasonality in ecohydrological fluxes and water partitioning was apparent under both plots (Figure 6) and the time-variable response is in accordance with previous studies (Sprenger et al., 2016; Thaw et al., 2021). Both sites showed small negative storage dynamics in their water balance in 2018, with drought effects seemingly mitigated by a wet winter in 2017–2018 (Figures 6 and 7). Thus, subsurface storage sustained green water demands, with no observed major limitation in forest transpiration due to precipitation input of an summer rain event (10–12.7.2018, 59 mm) that likely mediated the developing soil water deficit. Groundwater recharge primarily occurred at both sites in winter and was reduced in 2019, when subsurface storages were not fully rewetted and many blue water fluxes almost completely ceased in the subsequent growing season. We also observed a return to shallower RWU under wetter conditions in 2020. Overall, our findings were similar as in Orth and Destouni (2018) in terms of drought impacts being stronger on blue rather than green water fluxes in NE Germany. More precipitation inputs in late 2019 and early 2020 recovered the 6 months SPI and fractions of blue water fluxes increased. However, the effect was transient and at the end of the study period, with the SPI declining again, blue water fractions were reduced at both sites.
Our study underlined the differences in the drainage characteristics of subsurface storage between sites. Besides the differences in soil characteristics (Table 1), soil moisture dynamics were influenced by the higher interception losses (Kleine et al., 2021) and deeper RWU under forest vegetation. The more retentive grassland soil storage showed higher water content and less variability in RWU depths. The dominant oak at the forest site can adapt to drought conditions by plasticity in physiological characteristics (e.g., inter-calary veins, leaf size etc.) and therefore shows acclimation properties (Günthardt-Goerg et al., 2013). In addition to the regional indications for higher oak drought resistance (Scharnweber et al., 2011), the rooting depth of the oak forest stand might be deeper than in monocultural conifer stands (Bello et al., 2019) which are common in Brandenburg and contribute greater resilience to changing climate (Pretzsch et al., 2020).
Whilst grassland vegetation can also show physiological drought adaptations (Hanslin et al., 2019) and species-dependent water use strategies (Nippert & Knapp, 2007), we did not find such dynamics in the grassland plot due to limited drought effects on shallow soil water storage. Nevertheless, grassland in the DMC could still provide further potential in drought mitigation strategies (Volaire et al., 2014). Drought adaptations are dependent on the hydraulic properties of the soil-root system (Lobet et al., 2014) and the more retentive grassland soil provided higher soil moisture in the upper soil profile throughout the study. The observed vegetation strategies of RWU under drought were linked to plant-available soil moisture.
The forest site also showed higher variability in groundwater recharge fluxes which is consistent with the soil water dynamics. Annual groundwater recharge fractions in the forest water balance were also lower reflecting the higher interception, transpiration and more freely draining soil (Figure 7). The simulated groundwater recharge is consistent with other modelling studies in the region (Douinot et al., 2019; Smith et al., 2021). This flux is especially important in DMC where green water fluxes dominate (Smith, Tetzlaff, Gelbrecht, et al., 2020), but surface water presence and related ecosystem services are dependent on groundwater (Kleine et al., 2021). In drought and climate change mitigation efforts, understanding vegetation effects on hydrological functioning (Levia et al., 2020) and cross-scale assessment of the water cycle will be essential to enable the management of future societal demands (Gleeson et al., 2020).
5.2 Dynamics in stable water isotopes under different land use types
During passage through the soil–plant atmosphere continuum, the stable isotopic signature of water is affected by phase changes, flow paths, hydrological connectivity and associated mixing with water stored in the Critical Zone (Kendall and McDonnell, 1998). This has motivated the extensive isotope sampling conducted at DMC. Integrated into hydrological models, water stable isotopes have the potential to assess mixing relationships between fluxes and storages as associated effect on water ages (Birkel & Soulsby, 2015). Over a 14 months period we observed site specific temporal dynamics in bulk soil water isotopic signatures and damping with depth (Kleine et al., 2020). Dynamics in soil moisture and soil isotope signatures were quite well reproduced by EcH2O-iso for the 14 months in the upper two layers. The subsurface sampling strategy of bulk soil isotopes was important to constrain model parameters, providing six datasets per site in the multicriteria calibration strengthening our confidence in the representation of subsurface processes. We assumed lateral water movement was negligible as done by others in less flat landscapes and areas dominated by freely draining soils (McGuire & McDonnell, 2010; Sprenger et al., 2016).
The dry conditions were reflected by evaporatively enriched isotopic signatures (Craig et al., 1963) mainly in the upper soil profile (Sprenger et al., 2017), which were well captured in the modelling, as was the mixing and dampened dynamics with depth. It seemed important to exclude potential misinterpretation from higher organic material in the upper soil (Table 2) and associated effects on isotope measurements (Gralher et al., 2018). Although vegetation isotopes were not used in model calibration, the simulated isotopes represented well the measured dynamics at both sites (Figure 5). In the forest, plant xylem isotopes showed much less similarities to upper soil layer isotopes than under grassland (Figure 4).
Recent scientific studies emphasize the need to consider methodological uncertainties in isotope sampling and analysis (Chen et al., 2020; Orlowski et al., 2018). New investigations suggest a potential correction range for the water isotopic signal of woody plant matrix extracts with a mean of ~ + 8.1 ‰ in δ2H (Allen & Kirchner, 2021; Chen et al., 2020). If we consider these uncertainties, the offset in woody forest vegetation relative to the soil isotopes (Figure 4) and simulated transpiration isotopes (Figure 5) might support such an adaptation magnitude at our site. Regardless of the adaptation, the forest vegetation isotope signatures still reflected deeper water sources than at the grassland site which more clearly resembled bulk soil water isotope dynamics in the shallow soil water (Figure 4). These observed patterns in grassland RWU were supporting the modelled dominance of the upper soil water on transpiration fluxes here and as observed for other lowland sites (Prechsl et al., 2015).
5.3 Drought impact on storage-age-flux dynamics
We assessed water ages in soil–plant storage and fluxes at our two sites as well as their temporal variations under prolonged, exceptional atmospheric conditions to understand interactions between multiple ecohydrological compartments (Dimitrova-Petrova et al., 2020; Evaristo et al., 2019; Sprenger et al., 2019). Soil water ages in the forest site were generally younger and more dynamic. This was explained by the smaller soil water retention capacity and higher “water use” by the forest vegetation relative to grassland (Douinot et al., 2019). The older soil water ages under grassland were supported by the reduced variability in soil moisture and higher water retention. In soil layer 3, water ages still became older during 2020, showing a slower response to rewetting conditions due to higher water content and limited depletion by RWU.
Transpiration ages were younger for the forested site and directly linked to RWU patterns from the younger, more limited soil storage (Figure 9). The lower clay content in the upper forest soil profile promotes younger water ages (Sprenger et al., 2016). The depth of RWU at the forest site was more dynamic and deeper soil storage was especially important for vegetation under drought conditions to sustain green rather than blue water fluxes (Orth & Destouni, 2018). We simulated that during the growing season, the depth of modelled RWU from the forest shifted downwards as soils dried (Figure 9), underlining the importance of older soil water for temperate forests (Brinkmann et al., 2018). Forest vegetation accessing younger water and being more dynamic in exploiting water sources was also found in other recent research (Thaw et al., 2021). This reflects the higher transpiration potential in summer coupled with low soil potential in layer 1, in combination with the time-invariant root proportion distribution in EcH2O-iso, which exponential decreases with depth. The continuously increasing grassland transpiration ages beyond drought conditions also how the root distribution is conceptualized, allowing grassland RWU from older layer 3 storage. It is interesting that transpiration at both sites is depressed in 2020 compared to 2019, despite increasing wetness, which is rather related to lower atmospheric demand than to the (not simulated) adaptation by the vegetation cover.
Water ages derived from integrating extensive isotope data into ecohydrological models can give important insights on temporal aspects of storage and flux vulnerability to drought (Kuppel et al., 2020). Younger water ages of forest soil storages and transpiration highlight the potential vulnerability to drought conditions; and although faster recovery (of the soil storage) occurs, the differences in soil water ages and soil moisture are more vulnerable to negative rainfall anomalies. Further, the grassland site experienced a longer drought legacy in deeper soil water ages after rewetting. The older soil water ages during the drought (forest) and during rewetting (grassland) highlight the importance of transpiration water sources fallen prior to the growing season (Brinkmann et al., 2018).
5.4 Wider implications
The observed differences in blue and green water fluxes emphasize the need for considering spatially discretised mitigation objectives in the DMC and comparable lowland landscapes (Smith et al., 2021). It is crucial to further assess such water dynamics and related effects on forest ecosystems under a changing climate (Vido & Nalevanková, 2021). It is also important to further investigate how spatial and temporal patterns of green water use in droughts impact blue water provision (Freire-González et al., 2017) from more soil/vegetation units over subsequent growing seasons. We emphasize that the complex and dynamic vegetation effects on soil properties and vice versa associated with land use management strategies (Silva & Lambers, 2020) will increasingly need to be included in long-term ecohydrological modelling to understand effects on subsurface water storage by sustainable management. Forest water use and reduced drought recovery could also be assessed by expanding more routine monitoring of radial stem growth and sap flow dynamics over a wider range of species (Dang et al., 2019). This is important to evaluate other long-term impacts for example, expected increased mortality in regional forest ecosystems by the 2018 drought and secondary drought impact events (Schuldt et al., 2020). The grassland differed in dynamics, indicated longer drought effects on the subsurface water ages in our study.
Isotope-aided ecohydrological modelling as a process- and evidence-based tool proved invaluable in assessing such drought feedbacks and can be used to help evaluate vegetation-focused drought mitigation strategies (Smith et al., 2021). Given, the differences in the persistence of drought effects between sites, multi-year assessments of drought events are required. On the basis of their importance in the DMC, we see potential in further development of the EcH2O-iso model (Kuppel et al., 2018). This could include the implementation of more explicit conceptualisation of vegetation-mediated processes, such as interception, finer resolution simulation of pools of water utilized in root water uptake, dynamic representation of root distributions vertically and horizontally and internal storage mechanisms in trees. However, this would also be dependent on detailed monitoring of different soil-vegetation units and hydroclimatic conditions to further test and constrain model structures and parameters.
6 CONCLUSIONS
Due to changing climate and anthropogenic demands, investigations of ecohydrological fluxes and impacts of hydroclimatic perturbations such as droughts are still a major research challenge. For an integrated assessment of ecosystem functioning, it is important to assess and quantify the dynamic role of vegetation in partitioning precipitation in water fluxes back to the atmosphere and water sustaining ground and stream water. The presented study quantified such partitioning in two land use units in a lowland, drought sensitive catchment that is dominated by green water fluxes and where surface water and associated ecosystem services (habitat provision and downstream discharge) are groundwater dependent.
Firstly, we could show the value of water stable isotopes to confirm water sources. Second, we investigated the response post-drought for two different landuses. The European drought of 2018 and ongoing negative rainfall anomalies in 2019 reduced blue water fluxes more severely than green water fluxes under both grassland and forested sites. At the grassland site, the more water retentive soil and shallower rooting depths resulted in generally less variable, older soil moisture and groundwater recharge. The forested site showed higher transpiration from a younger, more dynamic subsurface water pool with stronger dynamics in RWU depth and a temporally more focused and lower annual groundwater recharge. Post drought conditions lead to a faster decline in water ages of the forested subsurface stores and transpiration. The deeper grassland subsurface showed persisting drought impacts on soil storage in the lower profile and groundwater recharge ages in 2020. Third, this highlights differences in storage-age-flux dynamics under drought and rewetting between sites over subsequent growing seasons. Whereas the forest site showed a higher vulnerability to drought, the deeper grassland soil showed prolonged drought legacy in soil water ages.
Our research highlighted the role of consecutive drought years on lowland ecohydrological fluxes and stores and also the transitioning between states. These findings on storage-age-flux dynamics under different soil-land use plots indicate that reliance on drought and inter-annual memory effects can be highly variable and this has important implications for integrated water management and lowland drought mitigation strategies. The persistent drought impacts at the grassland site should be further evaluated in the future. Advancing our understanding on ecohydrological processes needs to consider the potential long-term nature of drought effects on differing soil/vegetation units. Further research potential remains to establish the optimum land covers to balance management of green and blue water fluxes.
Beyond quantifying the ecohydrological fluxes and stores under drought and recovery, we identified possibilities and required adaptations in further DMC research efforts, including a more sophisticated representation of the subsurface water movement and root distributions in modelling, as well as extended and more direct measurement of evaporation and transpiration fluxes. This would further strengthen the information value of vegetation isotopes and related confidence in modelling applications beyond the cautious use of a soft validation presented here. Still, the xylem isotope values increased confidence in model simulations. The modelled soil-vegetation differences in partitioning precipitation and their seasonal and drought dynamics should further be put into context with spatial aspects of climate mitigation and ecosystem protection objectives in such landscape with limited topographical controls. Understanding the dynamics of soil–plant-atmosphere interactions can contribute to inform sustainable management and policy solutions that are adapted to local requirements. Future progress through modelling in assessing the time dynamic vegetation effects on nonlinearity in the response of terrestrial hydrological systems should be supported by extended interdisciplinary field observation including extensive Critical Zone isotope sampling.
ACKNOWLEDGEMENTS
The authors are grateful to all colleagues involved in the sample collection and infrastructure installation in the DMC (in particular H. Dämpfling, J. Freymüller, H. Wang, S. Jordan, A. Douinot, A. Wieland, N. Weiß, L. Kuhlemann, C. Marx, L. Lachmann, W. Lehmann). We thank D. Dubbert for support with the extensive isotope analysis, as well as Department 6 of the IGB (in particular T. Rossoll) for help with the sampling, measurement equipment and insights to the long-term catchment infrastructure and background. We are thankful for trustful collaboration with B. Bösel and technical support by the WLV (Wasser und Landschaftspflegeverband Untere Spree). Contributions from Soulsby were supported by the Leverhulme Trust's ISO-LAND project (RPG-2018-375). Two anonymous reviewers are thanked for constructive comments.
APPENDIX
| Names | Grassland | Forest | ||
|---|---|---|---|---|
| Min | Max | Min | Max | |
| Anisotropy (−) | ||||
| Layer 1–3 | 0.01 | 0.4 | 0.01 | 0.4 |
| Brooks-Corey exponent parameter (−) | ||||
| Layer 1 | 2.5 | 7 | 2.5 | 7 |
| Layer 2 | 2.5 | 7 | 2.5 | 7 |
| Layer 3 | 3 | 7 | 2.5 | 4 |
| Rooting exponential distribution factor (−) | 0.01 | 10 | 0.01 | 10 |
| Soil Porosity (m3/m3) | ||||
| Layer 1 | 0.3 | 0.5 | 0.2 | 0.3 |
| Layer 2 | 0.2 | 0.5 | 0.2 | 0.3 |
| Layer 3 | 0.25 | 0.55 | 0.2 | 0.3 |
| Air-entry pressure head (m) | ||||
| Layer 1 | 0.05 | 0.4 | 0.05 | 0.5 |
| Layer 2 | 0.05 | 0.6 | 0.05 | 0.3 |
| Layer 3 | 0.05 | 0.6 | 0.05 | 0.25 |
| Residual soil moisture (m3/m3) | 0.01 | 0.02 | 0.01 | 0.05 |
Open Research
DATA AVAILABILITY STATEMENT
The data are available from the corresponding author upon reasonable request.


